| Characteristic | Male | Female |
|---|---|---|
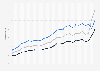
| 2024 | 1.6% | 2.5% |
| 2023 | 1.8% | 2.8% |
| 2022 | 2.2% | 3.2% |
| 2021** | 1.9% | 2.6% |
| 2020** | 1.5% | 2.3% |
| 2019* | 1.6% | 2.4% |
| 2018 | 1.6% | 2.5% |
| 2017 | 1.5% | 2.4% |
| 2016 | 1.6% | 2.5% |
| 2015 | 1.7% | 2.6% |
| 2014 | 1.6% | 2.5% |
| 2013 | 1.6% | 2.6% |
| 2012 | 1.7% | 2.7% |
| 2011 | 1.7% | 2.6% |
| 2010 | 1.8% | 2.8% |
| 2009 | 1.9% | 3% |
| 2008 | 2% | 3.1% |
| 2007 | 2.1% | 3.2% |
| 2006 | 2.2% | 2.9% |
| 2005 | 2.2% | 3.1% |
| 2004 | 2.3% | 3.3% |
| 2003 | 2.5% | 3.4% |
| 2002 | 2.4% | 3.5% |
| 2001 | 2.5% | 3.5% |
| 2000 | 2.5% | 3.5% |
| 1999 | 2.6% | 3.7% |
| 1998 | 2.5% | 3.6% |
| 1997 | 2.6% | 3.8% |
| 1996 | 2.5% | 3.6% |
| 1995 | 2.6% | 3.8% |
The chart is not accessible to screen readers. Please switch to the table view to access the data.
Zoomable Statistic: Select the range in the chart you want to zoom in on.
Loading statistic...
Download
Source
Release date
June 2025
More information
Region
United Kingdom
Survey time period
1995 to 2024
Age group
16 years and older
Supplementary notes
This statistic is using original data from the Office for National Statistics and includes copyright material from © Crown, licensed under the Open Government License v3.0.
*Data reweighted from 2019 onwards
**The source advises caution for these years due to the impact of government support policies during the COVID-19 pandemic
Citation formats