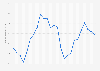
| Characteristic | Number of employees in millions |
|---|---|
| 2025* | 134.93 |
| 2024 | 133.36 |
| 2023 | 134.06 |
| 2022 | 132.25 |
| 2021 | 127.16 |
| 2020 | 123.19 |
| 2019 | 130.6 |
| 2018 | 128.57 |
| 2017 | 125.97 |
| 2016 | 123.76 |
| 2015 | 121.49 |
| 2014 | 118.72 |
| 2013 | 116.31 |
| 2012 | 114.81 |
| 2011 | 112.56 |
| 2010 | 111.71 |
| 2009 | 112.63 |
| 2008 | 120.03 |
| 2007 | 121.09 |
| 2006 | 119.69 |
| 2005 | 117.02 |
| 2004 | 114.52 |
| 2003 | 113.32 |
| 2002 | 112.7 |
| 2001 | 113.57 |
| 2000 | 113.85 |
| 1999 | 110.3 |
| 1998 | 108.2 |
| 1997 | 106.33 |
| 1996 | 103.54 |
| 1995 | 101.68 |
| 1994 | 99.77 |
| 1993 | 99.11 |
| 1992 | 97.66 |
| 1991 | 97.19 |
| 1990 | 98.67 |
The chart is not accessible to screen readers. Please switch to the table view to access the data.
Loading statistic...
Download
Source
Release date
January 2026
More information
Region
United States
Survey time period
1990 to 2025
Supplementary notes
*Annual estimates for 2025 are 11-month averages that exclude October. Data for October 2025 were not collected due to the federal government shutdown.
In line with the definition of the BLS, full-time is 35 hours or more per week.
The source did not indicate a release date. The date of access was taken as the release date.
Citation formats