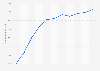
Over the course of 2013 to 2019, steady growth is observed for the total assets of SEAT S.A. Total assets increased from about * billion euros in 2013 up to *** billion euros in 2019. In 2020, total assets decreased amid the COVID-19 pandemic. By 2024, SEAT's total assets reached *****billion euros, an 18 percent increase compared to 2023.
Profit from the additional features of your individual account
Currently, you are using a shared account. To use individual functions (e.g., mark statistics as favourites, set
statistic alerts) please log in with your personal account.
If you are an admin, please authenticate by logging in again.
Learn more about how Statista can support your business.
Seat. (March 11, 2025). Total assets of SEAT S.A. from FY 2013 to FY 2024 (in million euros) [Graph]. In Statista. Retrieved May 08, 2026, from https://www.statista.com/statistics/1451715/seat-sa-total-assets/
Seat. "Total assets of SEAT S.A. from FY 2013 to FY 2024 (in million euros)." Chart. March 11, 2025. Statista. Accessed May 08, 2026. https://www.statista.com/statistics/1451715/seat-sa-total-assets/
Seat. (2025). Total assets of SEAT S.A. from FY 2013 to FY 2024 (in million euros). Statista. Statista Inc.. Accessed: May 08, 2026. https://www.statista.com/statistics/1451715/seat-sa-total-assets/
Seat. "Total Assets of Seat S.A. from Fy 2013 to Fy 2024 (in Million Euros)." Statista, Statista Inc., 11 Mar 2025, https://www.statista.com/statistics/1451715/seat-sa-total-assets/
Seat, Total assets of SEAT S.A. from FY 2013 to FY 2024 (in million euros) Statista, https://www.statista.com/statistics/1451715/seat-sa-total-assets/ (last visited May 08, 2026)
Total assets of SEAT S.A. from FY 2013 to FY 2024 (in million euros) [Graph], Seat, March 11, 2025. [Online]. Available: https://www.statista.com/statistics/1451715/seat-sa-total-assets/