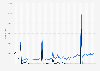
| Characteristic | Share of deaths due to plague |
|---|---|
| 1680 | 0% |
| 1679 | 0.01% |
| 1678 | 0.02% |
| 1677 | 0.01% |
| 1676 | 0.01% |
| 1675 | 0.01% |
| 1674 | 0.01% |
| 1673 | 0.03% |
| 1672 | 0.03% |
| 1671 | 0.03% |
| 1670 | 0% |
| 1669 | 0.02% |
| 1668 | 0.08% |
| 1667 | 0.22% |
| 1666 | 15.69% |
| 1665 | 70.5% |
| 1664 | 0.03% |
| 1663 | 0.06% |
| 1662 | 0.07% |
| 1661 | 0.1% |
| 1660 | 0.09% |
| 1659 | 0.24% |
| 1658 | 0.09% |
| 1657 | 0.03% |
| 1656 | 0.04% |
| 1655 | 0.08% |
| 1654 | 0.12% |
| 1653 | 0.07% |
| 1652 | 0.13% |
| 1651 | 0.21% |
| 1650 | 0.17% |
| 1649 | 0.64% |
| 1648 | 6.11% |
| 1647 | 25.59% |
| 1646 | 18% |
| 1645 | 16.3% |
| 1644 | 13.65% |
| 1643 | 7.54% |
| 1642 | 14.99% |
| 1641 | 16.77% |
| 1640 | 11.35% |
| 1639 | 3.18% |
| 1638 | 2.66% |
| 1637 | 26.2% |
| 1636 | 44.52% |
| 1635 | 0% |
| 1634 | 0.01% |
| 1633 | 0% |
| 1632 | 0.08% |
| 1631 | 3.28% |
| 1630 | 12.48% |
| 1629 | 0% |
| 1628 | 0.04% |
| 1627 | 0.05% |
| 1626 | 1.82% |
| 1625 | 65.27% |
| 1624 | 0.09% |
| 1623 | 1.53% |
| 1622 | 0.18% |
| 1621 | 0.14% |
| 1620 | 0.22% |
| 1619 | 0.11% |
| 1618 | 0.19% |
| 1617 | 0.07% |
| 1616 | 0.11% |
| 1615 | 0.47% |
| 1614 | 0.3% |
| 1613 | 0.21% |
| 1612 | 0.82% |
| 1611 | 8.54% |
| 1610 | 19.84% |
| 1609 | 35.98% |
| 1608 | 25.08% |
| 1607 | 29.32% |
| 1606 | 26.82% |
| 1605 | 6.95% |
| 1604 | 17.17% |
| 1603 | 86.27% |
The chart is not accessible to screen readers. Please switch to the table view to access the data.
Zoomable Statistic: Select the range in the chart you want to zoom in on.
Loading statistic...
Download
Source
Release date
May 2020
More information
Region
United Kingdom (England)
Survey time period
1603 to 1680
Supplementary notes
This data was calculated using the data from this statistic.
Citation formats