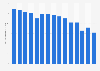
In 2021, approximately ******* tons of particulate matter (PM10) were emitted in South Korea, down from ******* tons in 2009. With the inclusion of fugitive dust and biocombustion emissions in calculations, 2015 showed higher levels of PM10 emissions than before.
Profit from the additional features of your individual account
Currently, you are using a shared account. To use individual functions (e.g., mark statistics as favourites, set
statistic alerts) please log in with your personal account.
If you are an admin, please authenticate by logging in again.
Learn more about how Statista can support your business.
KOSIS. (January 16, 2024). Emissions of particulate matter (PM10) in South Korea from 2009 to 2021 (in 1,000 metric tons) [Graph]. In Statista. Retrieved May 09, 2026, from https://www.statista.com/statistics/992926/south-korea-pm10-emissions/
KOSIS. "Emissions of particulate matter (PM10) in South Korea from 2009 to 2021 (in 1,000 metric tons)." Chart. January 16, 2024. Statista. Accessed May 09, 2026. https://www.statista.com/statistics/992926/south-korea-pm10-emissions/
KOSIS. (2024). Emissions of particulate matter (PM10) in South Korea from 2009 to 2021 (in 1,000 metric tons). Statista. Statista Inc.. Accessed: May 09, 2026. https://www.statista.com/statistics/992926/south-korea-pm10-emissions/
KOSIS. "Emissions of Particulate Matter (Pm10) in South Korea from 2009 to 2021 (in 1,000 Metric Tons)." Statista, Statista Inc., 16 Jan 2024, https://www.statista.com/statistics/992926/south-korea-pm10-emissions/
KOSIS, Emissions of particulate matter (PM10) in South Korea from 2009 to 2021 (in 1,000 metric tons) Statista, https://www.statista.com/statistics/992926/south-korea-pm10-emissions/ (last visited May 09, 2026)
Emissions of particulate matter (PM10) in South Korea from 2009 to 2021 (in 1,000 metric tons) [Graph], KOSIS, January 16, 2024. [Online]. Available: https://www.statista.com/statistics/992926/south-korea-pm10-emissions/