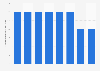
This statistic shows the preferred hard cider flavors among consumers in the United States as of January 2017. According to the survey, apple ciders in general were the most preferred cider flavor in the U.S., with a ** percent share of respondents stating that they prefer that flavor.
Profit from the additional features of your individual account
Currently, you are using a shared account. To use individual functions (e.g., mark statistics as favourites, set
statistic alerts) please log in with your personal account.
If you are an admin, please authenticate by logging in again.
Learn more about how Statista can support your business.
Nielsen. (April 5, 2017). Which of the following flavors of hard cider do you prefer to drink? [Graph]. In Statista. Retrieved May 08, 2026, from https://www.statista.com/statistics/878856/preferred-hard-cider-flavors-among-consumers-in-the-us/
Nielsen. "Which of the following flavors of hard cider do you prefer to drink?." Chart. April 5, 2017. Statista. Accessed May 08, 2026. https://www.statista.com/statistics/878856/preferred-hard-cider-flavors-among-consumers-in-the-us/
Nielsen. (2017). Which of the following flavors of hard cider do you prefer to drink?. Statista. Statista Inc.. Accessed: May 08, 2026. https://www.statista.com/statistics/878856/preferred-hard-cider-flavors-among-consumers-in-the-us/
Nielsen. "Which of The following Flavors of Hard Cider Do You Prefer to Drink?." Statista, Statista Inc., 5 Apr 2017, https://www.statista.com/statistics/878856/preferred-hard-cider-flavors-among-consumers-in-the-us/
Nielsen, Which of the following flavors of hard cider do you prefer to drink? Statista, https://www.statista.com/statistics/878856/preferred-hard-cider-flavors-among-consumers-in-the-us/ (last visited May 08, 2026)
Which of the following flavors of hard cider do you prefer to drink? [Graph], Nielsen, April 5, 2017. [Online]. Available: https://www.statista.com/statistics/878856/preferred-hard-cider-flavors-among-consumers-in-the-us/