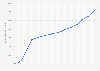
This figure refers to the current spending on healthcare of National Accounting (Spesa sanitaria corrente di Contabilità Nazionale). Data prior to 2014 from earlier publications by the source.
Public healthcare expenditure in Italy increased steadily in the past two decades. This figure stood at approximately ** billion euros in 2002, whereas it exceeded *** billion euros as of 2023. Similarly, private expenditure on healthcare has grown steadily recently, reaching nearly **** billion euros in 2022. This brought the annual healthcare expenditure (public and private combined) to *** percent of the country’s GDP in 2023.
Hospitals in Italy
Despite both the increase in government funding for healthcare and the increase in hospital spending, there has been a closure of smaller healthcare facilities and a decrease in the number of hospitals, which, as a consequence, led to a decline in the number of hospital beds. The number of individuals employed in hospitals fluctuated, reaching almost *** thousand individuals in 2020.
Hospitalization rates
The hospitalization rate per one thousand inhabitants in Italy stood at ***** in 2021. Hospitalization rates, however, varied significantly across regions and depended on the type of treatment. Aosta Valley, the Italian region neighboring France and Switzerland, for example, recorded a hospitalization rate of ******. By contrast, the rate registered in the region of Apulia stood at *****
Profit from the additional features of your individual account
Currently, you are using a shared account. To use individual functions (e.g., mark statistics as favourites, set
statistic alerts) please log in with your personal account.
If you are an admin, please authenticate by logging in again.
Learn more about how Statista can support your business.
Ministero dell'economia e delle finanze. (December 30, 2024). Public healthcare expenditure in Italy from 2002 to 2023 (in million euros) [Graph]. In Statista. Retrieved May 09, 2026, from https://www.statista.com/statistics/793788/public-healthcare-expenditure-in-italy/
Ministero dell'economia e delle finanze. "Public healthcare expenditure in Italy from 2002 to 2023 (in million euros)." Chart. December 30, 2024. Statista. Accessed May 09, 2026. https://www.statista.com/statistics/793788/public-healthcare-expenditure-in-italy/
Ministero dell'economia e delle finanze. (2024). Public healthcare expenditure in Italy from 2002 to 2023 (in million euros). Statista. Statista Inc.. Accessed: May 09, 2026. https://www.statista.com/statistics/793788/public-healthcare-expenditure-in-italy/
Ministero dell'economia e delle finanze. "Public Healthcare Expenditure in Italy from 2002 to 2023 (in Million Euros)." Statista, Statista Inc., 30 Dec 2024, https://www.statista.com/statistics/793788/public-healthcare-expenditure-in-italy/
Ministero dell'economia e delle finanze, Public healthcare expenditure in Italy from 2002 to 2023 (in million euros) Statista, https://www.statista.com/statistics/793788/public-healthcare-expenditure-in-italy/ (last visited May 09, 2026)
Public healthcare expenditure in Italy from 2002 to 2023 (in million euros) [Graph], Ministero dell'economia e delle finanze, December 30, 2024. [Online]. Available: https://www.statista.com/statistics/793788/public-healthcare-expenditure-in-italy/