Profit from the additional features of your individual account
Currently, you are using a shared account. To use individual functions (e.g., mark statistics as favourites, set
statistic alerts) please log in with your personal account.
If you are an admin, please authenticate by logging in again.
Learn more about how Statista can support your business.
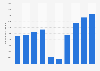
CLIA. (June 23, 2025). Year-over-year percentage change in the number of cruise passengers sourced from Europe from 2012 to 2024 [Graph]. In Statista. Retrieved May 08, 2026, from https://www.statista.com/statistics/685795/european-cruise-market-annual-growth-rate/
CLIA. "Year-over-year percentage change in the number of cruise passengers sourced from Europe from 2012 to 2024." Chart. June 23, 2025. Statista. Accessed May 08, 2026. https://www.statista.com/statistics/685795/european-cruise-market-annual-growth-rate/
CLIA. (2025). Year-over-year percentage change in the number of cruise passengers sourced from Europe from 2012 to 2024. Statista. Statista Inc.. Accessed: May 08, 2026. https://www.statista.com/statistics/685795/european-cruise-market-annual-growth-rate/
CLIA. "Year-over-year Percentage Change in The Number of Cruise Passengers Sourced from Europe from 2012 to 2024." Statista, Statista Inc., 23 Jun 2025, https://www.statista.com/statistics/685795/european-cruise-market-annual-growth-rate/
CLIA, Year-over-year percentage change in the number of cruise passengers sourced from Europe from 2012 to 2024 Statista, https://www.statista.com/statistics/685795/european-cruise-market-annual-growth-rate/ (last visited May 08, 2026)
Year-over-year percentage change in the number of cruise passengers sourced from Europe from 2012 to 2024 [Graph], CLIA, June 23, 2025. [Online]. Available: https://www.statista.com/statistics/685795/european-cruise-market-annual-growth-rate/