| Characteristic | Retail sales in billion U.S. dollars |
|---|---|
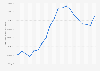
| 2022 | 1,536 |
| 2021 | 1,457 |
| 2020 | 1,225 |
| 2019 | 1,304 |
| 2018 | 1,296 |
| 2017 | 1,275 |
| 2016 | 1,268 |
| 2015 | 1,263 |
| 2014 | 1,241 |
| 2013 | 1,214 |
| 2012 | 1,192 |
| 2011 | 1,156 |
| 2010 | 1,114 |
| 2009 | 1,088 |
| 2008 | 1,136 |
| 2007 | 1,143 |
| 2006 | 1,110 |
| 2005 | 1,060 |
| 2004 | 1,004 |
| 2003 | 946 |
| 2002 | 913 |
| 2001 | 883 |
| 2000 | 863 |
| 1999 | 816 |
| 1998 | 758 |
| 1997 | 713 |
| 1996 | 683 |
| 1995 | 650 |
| 1994 | 616 |
| 1993 | 571 |
| 1992 | 533 |
The chart is not accessible to screen readers. Please switch to the table view to access the data.
Zoomable Statistic: Select the range in the chart you want to zoom in on.
Loading statistic...
Download
Source
Release date
January 2024
More information
Region
United States
Survey time period
1992 to 2022
Supplementary notes
GAFO (General Merchandise, Apparel and Accessories, Furniture and Other Sales) represents stores classified in the following NAICS codes: 442, 443, 448, 451, 452, and 4532. NAICS code 4532 includes office supplies, stationery, and gift stores.
Figures have been rounded.
Figures are not adjusted for price changes. Retail and food services total and other subsector totals may include data for kinds of business not shown. Additional information on sample design, estimation procedures, and measures of sampling variability can be found here.
Estimates have been adjusted using preliminary results of the 2017 Economic Census.
Citation formats