| Characteristic | Value added to GDP by agriculture in million U.S. dollars |
|---|---|
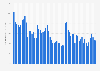
| 2024 | 3,785.45 |
| 2023 | 3,644.03 |
| 2022 | 3,130.17 |
| 2021 | 3,428.41 |
| 2020 | 3,908.21 |
| 2019 | 3,637.49 |
| 2018 | 3,764.97 |
| 2017 | 3,683.95 |
| 2016 | 3,510.68 |
| 2015 | 3,418.51 |
| 2014 | 3,468.49 |
| 2013 | 3,236.14 |
| 2012 | 2,254.6 |
| 2011 | 3,210.95 |
| 2010 | 3,038.47 |
| 2009 | 2,143.29 |
| 2008 | 2,426.73 |
| 2007 | 2,208.26 |
| 2006 | 1,910.29 |
| 2005 | 1,824.44 |
| 2004 | 1,823.33 |
| 2003 | 1,740.33 |
| 2002 | 1,588.62 |
| 2001 | 1,518.98 |
| 2000 | 1,361.15 |
| 1999 | 1,465.16 |
| 1998 | 1,452.31 |
| 1997 | 1,431.11 |
| 1996 | 1,332.66 |
| 1995 | 1,345.06 |
| 1994 | 1,187 |
| 1993 | 1,155.78 |
| 1992 | 1,081.72 |
| 1991 | 1,035.07 |
| 1990 | 1,046.99 |
| 1989 | 1,027.27 |
| 1988 | 933.2 |
| 1987 | 826.47 |
| 1986 | 750.87 |
| 1985 | 790.96 |
| 1984 | 751.64 |
| 1983 | 706.63 |
| 1982 | 723.4 |
| 1981 | 718.87 |
| 1980 | 649.97 |
| 1979 | 601.07 |
| 1978 | 561.13 |
| 1977 | 537.09 |
| 1976 | 508.81 |
| 1975 | 489.93 |
| 1974 | 446.45 |
| 1973 | 407.09 |
| 1972 | 382.03 |
| 1971 | 364.33 |
| 1970 | 341.24 |
| 1969 | 335.03 |
| 1968 | 327.32 |
| 1967 | 330.03 |
| 1966 | 314.06 |
| 1965 | 321.64 |
| 1964 | 299.01 |
| 1963 | 292.35 |
| 1962 | 281.41 |
The chart is not accessible to screen readers. Please switch to the table view to access the data.
Loading statistic...
Download
Source
Release date
February 2026
More information
Region
Paraguay
Survey time period
1962 to 2024
Special properties
Constant 2015 U.S. dollars
Citation formats