WO2015023271A1 - Improved array laterolog tool techniques - Google Patents
Improved array laterolog tool techniques Download PDFInfo
- Publication number
- WO2015023271A1 WO2015023271A1 PCT/US2013/054879 US2013054879W WO2015023271A1 WO 2015023271 A1 WO2015023271 A1 WO 2015023271A1 US 2013054879 W US2013054879 W US 2013054879W WO 2015023271 A1 WO2015023271 A1 WO 2015023271A1
- Authority
- WO
- WIPO (PCT)
- Prior art keywords
- excitation
- electrodes
- pair
- voltage difference
- monitor electrodes
- Prior art date
- Legal status (The legal status is an assumption and is not a legal conclusion. Google has not performed a legal analysis and makes no representation as to the accuracy of the status listed.)
- Ceased
Links
Classifications
-
- G—PHYSICS
- G01—MEASURING; TESTING
- G01V—GEOPHYSICS; GRAVITATIONAL MEASUREMENTS; DETECTING MASSES OR OBJECTS; TAGS
- G01V3/00—Electric or magnetic prospecting or detecting; Measuring magnetic field characteristics of the earth, e.g. declination, deviation
- G01V3/18—Electric or magnetic prospecting or detecting; Measuring magnetic field characteristics of the earth, e.g. declination, deviation specially adapted for well-logging
- G01V3/20—Electric or magnetic prospecting or detecting; Measuring magnetic field characteristics of the earth, e.g. declination, deviation specially adapted for well-logging operating with propagation of electric current
- G01V3/24—Electric or magnetic prospecting or detecting; Measuring magnetic field characteristics of the earth, e.g. declination, deviation specially adapted for well-logging operating with propagation of electric current using AC
-
- G—PHYSICS
- G01—MEASURING; TESTING
- G01V—GEOPHYSICS; GRAVITATIONAL MEASUREMENTS; DETECTING MASSES OR OBJECTS; TAGS
- G01V3/00—Electric or magnetic prospecting or detecting; Measuring magnetic field characteristics of the earth, e.g. declination, deviation
- G01V3/18—Electric or magnetic prospecting or detecting; Measuring magnetic field characteristics of the earth, e.g. declination, deviation specially adapted for well-logging
- G01V3/20—Electric or magnetic prospecting or detecting; Measuring magnetic field characteristics of the earth, e.g. declination, deviation specially adapted for well-logging operating with propagation of electric current
-
- E—FIXED CONSTRUCTIONS
- E21—EARTH OR ROCK DRILLING; MINING
- E21B—EARTH OR ROCK DRILLING; OBTAINING OIL, GAS, WATER, SOLUBLE OR MELTABLE MATERIALS OR A SLURRY OF MINERALS FROM WELLS
- E21B49/00—Testing the nature of borehole walls; Formation testing; Methods or apparatus for obtaining samples of soil or well fluids, specially adapted to earth drilling or wells
Definitions
- Various techniques may be used to evaluate geological formations. For example, measurements may be made using tools located within a borehole such as in support of geophysical and petrophysical exploration or resource extraction.
- an apparent resistivity (or conductivity) of a formation may be evaluated such as by injecting a current from a location within the borehole into a portion of the formation, and conductively measuring a resulting voltage induced by the current.
- Such resistivity information may provide a general indication of formation composition or geometry, including providing indicia of invasion or hydrocarbon presence.
- “galvanic”) measurement tools generally provided virtually no control over a radial depth of resistivity investigation into a formation.
- Later examples included one or more "guard” electrodes configured to provide an equal potential (or “equipotential") region in a medium nearby an electrode array, thus forcing a larger proportion of the injected current into the formation than earlier tools.
- Such a configuration is generally referred to as a “laterolog” or “guard log” tool.
- focusing of an injected current may be established using hardware or software techniques, or a combination of both hardware and software techniques.
- Measurements using such affected monitor electrodes may therefore be impractical because of error induced by noise or interference in the system. Also, an apparent formation resistivity determined using such confounded measurements may be inaccurate, particularly after software-based focusing of information obtained from the affected monitor electrodes.
- FIG. 1 illustrates generally an example of an apparatus including an array of current and monitor electrodes, such as for obtaining information indicative of a formation resistivity.
- FIG. 2 illustrates generally an example of an apparatus including an array of current and monitor electrodes, such as for obtaining information indicative of a formation resistivity.
- FIG. 3 illustrates generally an example of a current excitation mode provided by an array of current electrodes, arranged symmetrically about a central axis.
- FIGS. 4A through 4E illustrate generally examples of respective focusing modes, such as shown in relation to half of the symmetrical array of the example of FIG. 3.
- FIG. 5 illustrates generally an example of a technique, such as a method, including estimating a voltage difference corresponding to a first pair of monitor electrodes in a first excitation mode using information about a voltage difference received from a second pair of monitor electrodes.
- FIG. 6 illustrates generally an example of a technique, such as a method, including estimating a voltage difference corresponding to a first pair of monitor electrodes in a first excitation mode using information about an absolute voltage received from one electrode of the first pair of monitor electrodes in a different second excitation mode.
- FIG. 7 illustrates generally an example of a technique, such as a method, including estimating a voltage difference corresponding to a first pair of monitor electrodes in a first excitation mode using information about respective voltage differences received from a second pair of monitor electrodes respectively corresponding to a first resistivity and a different second resistivity.
- FIG. 8 illustrates generally an example of a technique, such as a method, including comparing information indicative of a measured signal (e.g., a conductively received signal from a monitor electrode) to a specified threshold, and in response, determining a resistivity using an estimated induced signal or inhibiting determining the resistivity using the estimated induced signal.
- a measured signal e.g., a conductively received signal from a monitor electrode
- FIG. 9 illustrates generally an example of a drilling apparatus, such as including a measure-while-drilling (MWD) or log-while-drilling (LWD) capability.
- MWD measure-while-drilling
- LWD log-while-drilling
- FIG. 10 illustrates generally an example of a wireline logging apparatus.
- Apparatus and techniques are described, such as for obtaining information indicative of a formation resistivity, such as using an array laterolog apparatus.
- an electrical excitation is coupled from a well tool in a borehole to a geologic formation through which the borehole extends, the excitation coupled through excitation electrodes on the well tool selected according to a specified excitation mode, and induced voltages are received from the geologic formation resulting from the excitation using monitor electrodes selected according to the specified excitation mode.
- a voltage difference between a first pair of monitor electrodes is estimated through use of the induced voltage received through at least one additional monitor electrode.
- the present inventors have recognized, among other things, that a voltage difference received from a first pair of monitor electrodes, or through other measurement, may be estimated.
- An estimate may be constructed using an algebraic combination of measurements received from other electrodes, and/or or from one or both electrodes in the first pair of monitoring electrodes, such as received in a different excitation mode.
- the present inventors have also recognized that certain deterministic relationships exist between voltages at different monitor electrodes and voltage differences between different monitor electrode pairs, particularly in cases where the formation resistivity is much larger than the mud resistivity. These relationships may be exploited to replace highly error-prone measurements corresponding to certain excitation modes with algebraic combinations of other measurements that are less susceptible to error. For example, when actual monitored voltages are at or near a noise floor of the system, such estimated measurements may instead be used, such as for determination of an apparent formation resistivity.
- FIG. 1 illustrates generally an example of an apparatus 100, including an electrode array 110 of current and monitor electrodes, such as for obtaining information indicative of a formation resistivity.
- An array laterolog tool such as including the electrode array 1 10, is generally used to obtain information indicative of a resistivity (or
- Such information from multiple depths may be used to correct for effects related to the presence of borehole and invasion layers, such as for determination of an "apparent" or corrected formation resistivity.
- the electrode array 1 10 may include ring-shaped electrodes, such as located along a longitudinal axis of a tool body sized and shaped for deployment within a borehole.
- Other electrode shapes may be used, such as rectangular or button-shaped electrodes.
- Such electrodes can be arranged or spaced radially around a tool body or otherwise arranged on the tool body.
- the electrode array 1 10 may be included as a portion of a drill string in a log-while-drilling (LWD) application (e.g., as shown in FIG. 9), or the electrode array 1 10 may be included as a portion of a wireline sonde (e.g., as shown in FIG. 10).
- LWD log-while-drilling
- Other configurations may be used, such as including a tubing-conveyed downhole logging configuration.
- the electrode array 1 10 is coupled to a excitation circuit 106 and a measurement circuit 108, such as controlled by a processor circuit 102 according to instructions stored in a processor-readable medium 104.
- the processor circuit 102 and processor-readable medium 104 may be located within a tool body or sonde downhole, or as a portion of a surface processing system.
- the processor circuit 102 may be coupled to a display 112, such as to present information indicative of a formation resistivity to a user, or to provide other information regarding status or control of various portions of the apparatus 100.
- processor-readable medium shall be taken to include any tangible non-transitory device which is capable of storing or encoding a sequence of instructions for execution by the machine and that causes the machine to perform any one of the described and/or claimed methodologies.
- processor-readable medium 104 includes a machine-readable medium or computer readable medium.
- non-transitory medium expressly includes all forms of storage devices, including drives (optical, magnetic, etc.) and all forms of memory devices (e.g., Dynamic Random Access Memory (DRAM), Flash (of all storage designs, including NAND or NOR topologies), Static Random Access Memory (SRAM), Magnetic Random Access Memory (MRAM), phase change memory, etc., as well as all other structures designed to store information of any type for later retrieval.
- DRAM Dynamic Random Access Memory
- Flash of all storage designs, including NAND or NOR topologies
- SRAM Static Random Access Memory
- MRAM Magnetic Random Access Memory
- phase change memory etc.
- one or more of the techniques described herein such as the techniques shown in FIGS. 5 through 8 may be implemented at least in part as instructions stored on the processor-readable medium 104. Such instructions cause the processor circuit 102 or other portions of the apparatus 100 to perform various operations, such as including portions or entireties of one or more techniques described herein.
- Coupled may refer to either direct coupling, such as conductive electrical coupling (e.g., as in the example of excitation currents conductively coupled into a formation), or indirect coupling (e.g., wireless, reactive, or electromagnetic coupling).
- direct coupling such as conductive electrical coupling (e.g., as in the example of excitation currents conductively coupled into a formation)
- indirect coupling e.g., wireless, reactive, or electromagnetic coupling
- “coupled” or “coupling” may refer to a direct mechanical connection, or an indirect mechanical connection through one or more other mechanical portions of an example.
- a centrally-located electrode A 0 is designated as a "survey electrode,” which in this example is coupled to the excitation circuit 106 and other electrodes (Ai, Ai', ... , A N , AN'), be referred to as “guard electrodes” are also coupled to the excitation circuit 106.
- a respective combination of the 2N guard electrodes and the survey electrode, Ao is used to couple an excitation generated by the excitation circuit 106 (e.g., one or more conductively coupled currents) to a formation from a location within a borehole.
- the respective combination is established according to a specified excitation mode. Examples of such excitation modes are shown illustratively in FIG. 3, and corresponding focusing modes are generally established using the information obtained from each excitation mode, such as shown FIGS. 4A through 4E.
- an excitation current injected into the formation using the excitation electrodes A 0 and Ai, Ai', ... , A N , A N ' will induce respective voltages which are received using one or more monitor electrodes, such as the 4N-4 monitor electrodes (Mi, Mi', M 2 , M 2 ', ..., ⁇ 2( ⁇ - ⁇ ), 2( - ⁇ )') shown in the illustrative example of the electrode array 110.
- the monitor electrodes may be coupled to a measurement circuit 108, to receive voltages induced in response to the specified current excitation mode.
- a hardware focusing technique, a software focusing technique, or a combination of hardware- and software-based focusing techniques may be used, to obtain information indicative of formation resistivity corresponding to a variety of radial depths within the formation.
- An excitation is generally a current injected into the formation by a specified combination of excitation electrodes according to the selected excitation mode.
- an excitation generated according to the selected excitation mode will include a specified alternating current (AC) current waveform at a specified frequency. In this manner, more than one excitation can be provided simultaneously, using different respective excitation frequencies corresponding to respective excitation modes.
- AC alternating current
- FIG. 2 illustrates generally an example of an apparatus 200, including an array of excitation electrodes 110B, A 0 and Ai, Ai', ... , A N , A N ', and an array of monitor electrodes 1 10A, Mi, Mi', M 2 , M 2 ', .. . , M 2 (N-I), M 2 (N-I)' , similar to the example 1 10 of FIG. 1, such as for obtaining information indicative of a formation resistivity.
- the excitation electrodes HOB may be coupled to respective channels of an excitation circuit 106, and may be independently controlled by a respective current source included within the excitation circuit 106.
- respective symmetrically-located current electrodes such as A N and A N ' may be conductively coupled together to establish a common potential at the respective symmetrically-located electrodes.
- respective currents injected between respective pairs of excitation electrodes 1 10B may be injected at different respective frequencies of excitation. In this manner, a current injected from a particular combination of excitation electrodes 1 10B may be discerned from other currents.
- the respective frequencies of such excitation currents are staggered in a non-harmonic relationship, but are closely-enough spaced so that a frequency dependence of formation parameters does not significantly impact a resulting resistivity estimate.
- the monitor electrodes 1 10A may be coupled to a measurement circuit 108.
- the measurement circuit 108 may include respective digital-to-analog converters, filters, or other signal conditioning circuitry, such as to conductively obtain signals independently from each of the monitor electrodes 1 10A, Mi, Mi', M 2 , M 2 ', ..., ⁇ 2( ⁇ - ⁇ ), ⁇ 2 ( ⁇ - ⁇ )'.
- respective symmetrically-located monitor electrodes such as M 2 (N I) and M 2 (N I)' may be conductively coupled together.
- adjacent monitor electrodes, such as Ml and M2 may be coupled to a differential voltage amplifier or detector, such as configured to provide information indicative of a voltage difference between the adjacent monitor electrodes.
- the measurement circuit 108 may include or may be coupled to one or more comparator circuits, such as for use in determining whether to use actual conductively -received measurements for a particular electrode combination in a particular excitation mode, or to trigger use of an estimation or approximation technique when an electrode combination measurement may be unreliable, such as discussed further below.
- the excitation circuit 106 and measurement circuit 108 may be operated under the control of a processor circuit 102, such as including or coupled to a processor-readable medium storing instructions executable by the processor circuit 102, or for storing information related to a current,
- the processor circuit 102 may be coupled to a communication circuit 1 12.
- the communication circuit may include one or more of a wireless transmitter, receiver or transceiver, such as using an inductive, radiative (e.g., electromagnetic), or acoustic (e.g., mud pulsing) communication scheme.
- the communication circuit 112 may use other techniques to transmit or receive information, such as a fiber-optic or other optical communication scheme.
- the apparatus 200 may be located downhole, such as included as a portion of an MWD/LWD logging system or as a portion of a wireline sonde.
- a processor circuit 102 may be located on the surface, such as communicatively coupled to one or more of the excitation circuit 106 or measurement circuit 108 to obtain information indicative of formation resistivity, or to provide processing capability such as to determine one or more measurement estimates related to or in support of an apparent formation resistivity determination.
- FIG. 3 illustrates generally an example of a current excitation mode provided by an array of current electrodes 1 10B, arranged symmetrically about a central axis, "x.”
- N different excitation modes are defined, and in the illustrative example of FIG. 3, N equals 6.
- the array of current electrodes HOB may include ring-shaped electrodes arranged along a longitudinal axis of a tool body, such as discussed in examples elsewhere herein.
- the spacing and shape of respective current electrodes need not be uniform, and are merely shown as uniform in FIG. 3 and FIGS. 4A through 4E for purposes of illustrating examples of the current excitation configurations and various focusing modes.
- FIG. 3 shows respective excitation currents through I 5 circulating between respective current electrodes A 0 through A 5 and a commonly-shared return electrode, Ae and symmetrically located electrodes A 0 ' through A5' circulating respective excitation currents Io' through 3 ⁇ 4' to a commonly-shared return electrode, Ae
- a and Ae are conductively coupled together or where the excitation currents are otherwise adjusted to provide an equipotential condition between Ae and Ae a current coupled from a particular electrode, such as A 5 , will return using both electrode A6 and electrode ⁇ ' .
- currents from non-"primed" electrodes may return using A 6 ', and vice versa.
- only half of the symmetrically-located electrodes may be shown or discussed, but such discussion may generally be applicable to the full array as shown and discussed in FIGS. 1 through 3.
- the electrode array 1 10 shown in FIG. 1 may be operable using a variety of different excitation schemes. Measurements received from respective monitor electrodes in the various excitation modes may be combined or otherwise processed to provide focusing modes established to investigate respective radial depths in a formation.
- N different excitation modes may be used, such as including modes that may be represented by the following excitation relationships for each current electrode:
- I A i represents the current emitted from a respective electrode, A;.
- currents are returned respectively to excitation electrodes A N and AN' .
- N 6
- excitation modes may be defined as follows:
- FIGS. 4A through 4E illustrate generally examples of focusing modes, shown in relation to half of the symmetrical array of the example of FIG. 3, such as may be obtained using combinations of respective excitation configurations as discussed in relation to FIG. 3.
- the electrode array 1 10B shown in FIG. 3, and the half-array examples shown in FIGS. 4A through 4E are merely illustrative of the general example of FIG. 1. As in the illustrative example of FIG.3, in FIGS. 4A through 4E, N is equal to 6.
- focusing techniques may be used, such as taking advantage of the principle of superposition in order to combine measurements from excitation modes such that the current emitted from a survey electrode travels in a path radially outward from the survey electrode, rather than "short circuiting" through the mud or other borehole medium without penetrating into the formation.
- combinations of monitor electrodes may be set to zero, thus suppressing or inhibiting a flow of excitation current locally in the direction of equipotentially- driven monitor electrodes.
- Such an equipotential condition may be established such as by varying respective excitation current magnitudes so that the equipotential criterion is met (e.g., a "hardware focusing” approach), or by appropriately weighting contributions from each excitation current by processing signals received using the monitor electrodes (e.g., a "software focusing” approach).
- such currents may be distinguished such as by using a unique excitation frequency for each excitation current, allowing measurements for multiple modes to be made simultaneously or contemporaneously.
- excitation current may controlled or measurements may be processed to provide a return path for the survey current using different guard electrodes in each mode.
- a depth of a formation probed by such excitation current is generally proportional to the separation between the current emitting electrode and the return electrode, so different weighted combinations of excitation modes may be employed to make measurements at different depths of investigation as a result.
- successively higher modes correspond to deeper radial distances of penetration into the formation with respect to the survey electrode.
- a variety of techniques may be used to establish the excitation modes of FIG. 3, or the focusing modes of FIGS. 4A through 4E, such as including one or more of software- or hardware-based focusing techniques.
- FIG. 4A illustrates generally a first focusing mode, referred to herein as “Mode 1 ,” or Resistivity Laterolog Array - 1 (RLA1).
- Mode 1 currents from A 0 , Ai and Ai' return respectively to A 2 and A 2 '.
- a voltage developed a respective monitor electrode is denoted herein as VM N , where "N" represents the electrode position, as shown in FIG. 1, for example, and where VMN' refers to a monitor electrode in a symmetrically located position from VM along the array.
- a voltage difference of (VMi+VMi')-(VM2+VM 2 ') are set to zero.
- FIG. 4B illustrates generally a second focusing mode, referred to herein as "Mode 2," or Resistivity Laterolog Array - 2 (RLA2).
- Mode 2 Resistivity Laterolog Array - 2
- FIG. 4C illustrates generally a third focusing mode, referred to herein as "Mode 3," or Resistivity Laterolog Array - 3 (RLA3).
- Mode 3 currents from A 0 , A 1 ; Ai', A 2 , A 2 ', A 3 and A3 ' return respectively to A4 and A 4 ' while voltage differences of (VM 1 +VMi')-(VM 2 +VM 2 ') > (VM 3 +VM 3 ')- (VM4+VM4') and (VM 5 +VM 5 ')-(VM 6 +VM 6 ') are respectively set at zero for focusing.
- FIG. 4D illustrates generally a fourth focusing mode, referred to herein as "Mode 4," or Resistivity Laterolog Array - 4 (RLA4).
- Mode 4 currents from A 0 , Ai, Ai', A 2 , ⁇ 2 ', A 3 , ⁇ 3 ', A4 and A 4 ' return respectively to A 5 and A 5 ' while voltage differences of (VM 1 +VMi')-(VM 2 +VM 2 ') > (VM 3 +VM 3 ')- (VM 4 +VM 4 '), (VM 5 +VM 5 ')-(VM 6 +VM 6 ') and (VM 7 +VM 7 ')-(VM 8 +VM 8 ') are respectively set at zero.
- FIG. 4E illustrates generally a fifth focusing mode, referred to herein as "Mode 5," or Resistivity Laterolog Array - 5 (RLA5).
- Mode 5 currents from A 0 , A 1 ; Ai', A 2 , A 2 ', A3, A3 ' , A4, A4' , A 5 and A 5 ' respectively return to A 6 and A 6 ' while voltage differences of (VM 1 +VM 1 ')-(VM 2 +VM 2 ') ) (VM 3 +VM 3 ')-(VM4+VM 4 '), (VM 5 +VM 5 ')-(VM 6 +VM 6 '), (VM7+VM7')- (VM 8 +VM 8 ') and (VM9+VM 9 ')-(VMio+VMio') are respectively set at zero.
- a finite element or impedance network modeling code may be used to model the respective voltages induced at the monitor electrodes in response to a modeled excitation mode, such as one of the 6 excitation modes shown and discussed in relation to the example of FIG. 3.
- a focusing technique may be applied to resulting modeled or measured values, such as according to one of the focusing modes shown in FIGS. 4A through 4E.
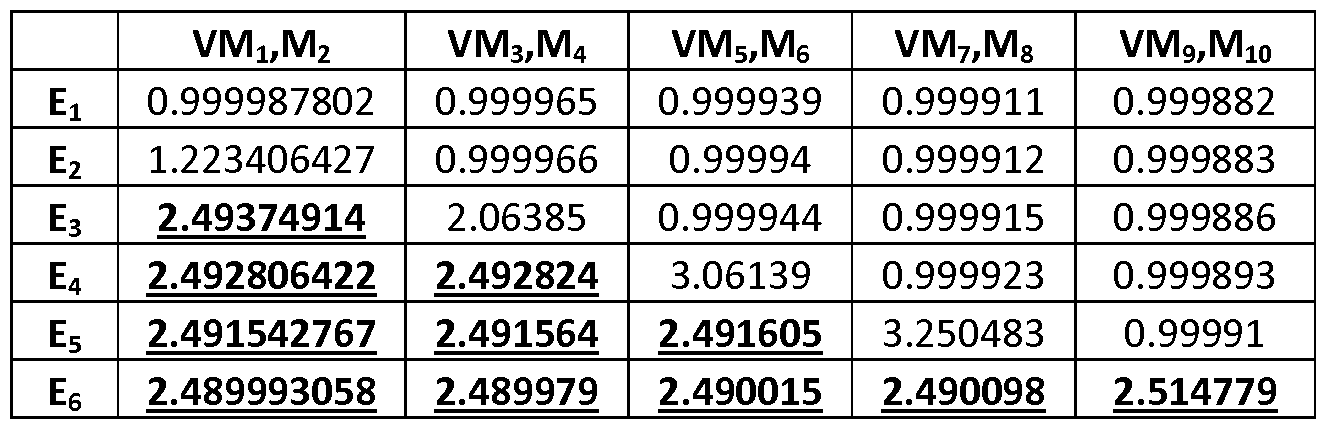
- VMi,Mj represent a voltage difference between monitor electrodes, i, and j, in an excitation mode shown in the corresponding row, Ek, where k is the excitation mode.
- ⁇ is in the range of 100's of nanovolts (nV), and therefore any error or noise signal on this order may cause a significant percentage error where a voltage measurement is made using VM 1 ; M 2 in mode (E 6 ).
- error may confound determination of an apparent resistivity because such error may be magnified when the conductively obtained measurements are subjected to hardware or software focusing techniques such as shown in FIGS. 4A through 4E. In some cases, sources of interference or noise in the field may entirely preclude obtaining reliable measurements.
- the present inventors have, among other things, developed various techniques to estimate a voltage difference for a first pair of monitor electrodes, such as using information obtained from other monitor electrodes, such as shown in the examples of FIGS. 5-7, or in other examples. Such an estimated or approximated voltage difference may be substituted for an actual measured differential voltage, to permit apparent resistivity determination.
- FIG. 5 illustrates generally an example of a technique 500, such as a method, including estimating a voltage difference corresponding to a first pair of monitor electrodes in a first excitation mode using information about a voltage difference received from a second pair of monitor electrodes.
- a technique 500 such as a method, including estimating a voltage difference corresponding to a first pair of monitor electrodes in a first excitation mode using information about a voltage difference received from a second pair of monitor electrodes.
- a first scaling factor may be determined using information about a voltage difference received from a different second pair of monitor electrodes respectively in a first excitation mode, and a different second excitation mode.
- the scaling factor may be applied to the voltage difference received from the first pair of monitor electrodes in the different second excitation mode, such as to provide an estimate of the voltage difference that would be obtained in the first mode.
- Such an estimated voltage difference may be used for a subsequent apparent resistivity determination, rather than an actual voltage difference received from the first pair of monitor electrodes in the first mode, such as when such measurement is not practical due to the limits of reliable detection of the voltage difference of the first pair of monitor electrodes in the first mode.
- FIG. 5 may be illustrated by several examples.
- Table 2 shows respective ratios of voltage differences corresponding to different excitation modes.
- Table 2 was obtained using the finite element modeling of Table
- the value VE1/E2 may be obtained by dividing the modeled voltage difference VM 1 ; M 2 received in excitation mode Ei by the voltage difference VM 1 ; M 2 received in excitation mode E 2 .
- the underlined values show that for certain tool and borehole geometries, and for certain ranges of resistivity, such as the mud resistivity of 0.02 ⁇ -m and the formation resistivity of 100,000 ⁇ -m, certain values in Table 2 are similar.
- the ratios between the E 4 and E5 excitation modes are very similar for monitor electrode pairs M 1 ; M 2 and M3,M 4 .
- ratios between the E5 and ⁇ excitation modes are very similar for monitor electrode pairs M 1 ; M 2 ; M 3 ,M 4 ; and M 5 ,M 6 .
- Table 3 shows respective ratios of voltage differences corresponding to different excitation modes.
- the values in Table 3 were obtained using the finite element modeling of Table 1 by dividing a voltage difference value in one column by the voltage difference value in the column to the right.
- the value is the ratio of VM 1 ; M 2 to VM 3 ,M 4 for the excitation mode corresponding to the row containing the value.
- VMi,Mj(Ek) represents a voltage difference between monitor electrodes, i, and j, in an excitation mode, Ek.
- VM 1 ,M 2 (E 4 ) refers to a voltage difference received from a first pair of monitor electrodes in a first excitation mode (e.g., an actual voltage difference received from the electrode array).
- a voltage difference received from a second pair of monitor electrodes in different second excitation mode is represented by VM 3 ,M 4 (E 5 )
- VM 3 ,M 4 (E 4 ) A voltage difference received from the second pair of electrodes in the first excitation mode is represented by VM 3 ,M 4 (E 4 ).
- the ratio of VM 3 ,M 4 (E 5 ) to VM 3 ,M 4 (E 4 ) may be treated as a scaling factor.
- VM 1 ,M 2 (E 4 ) may be multiplied by the scaling factor (e.g., VM 3 ,VM 4 (E 5 ) /VM 3 ,M 4 (E 4 )) to provide an approximated value (e.g., an estimate) of the measurement that would be received from VM 1 ,M 2 (Es), rather than requiring an actual measurement of VM 1 ,M 2 (Es).
- the scaling factor e.g., VM 3 ,VM 4 (E 5 ) /VM 3 ,M 4 (E 4 )
- the estimate of VM 1 ,M 2 (Ee) may include using the estimate of VMi,M 2 (E 5 ) multiplied by a second scaling factor (e.g., a ratio of VM 5 ,M 6 (E 6 ) / VM 5 ,M 6 (E 5 ), for example).
- a second scaling factor e.g., a ratio of VM 5 ,M 6 (E 6 ) / VM 5 ,M 6 (E 5 ), for example).
- the underlined elements in Table 4 were generated using the technique and relationships discussed above in relation to Tables 2 and 3, and generally show good agreement with the modeled values in Table 1.
- the underlined portions represent the values modeled using the estimation technique. The error induced by such approximations was simulated and found to be less than 1% of non-approximated model values, which is negligible compared to other errors that would occur using actual measurements, such as errors attributable to system or environmental factors.
- the techniques discussed in relation to FIG. 5 use voltage differences that may be received from, or estimated for, respective pairs of monitor electrodes.
- Absolute voltages such as conductively received with reference to a distantly-located reference conductor, also provide useful information for use in estimating a voltage difference corresponding to a selected monitor electrode pair.
- FIG. 6 illustrates generally an example of a technique 600, such as a method, including estimating a voltage difference corresponding to a first pair of monitor electrodes in a first excitation mode using information about an absolute voltage received from one electrode of the first pair of monitor electrodes in a different second excitation mode.
- a first scaling factor may be determined using information about a voltage difference received from the first pair of monitor electrodes in a different second excitation mode, and from an absolute voltage received from one electrode of the first pair of monitor electrodes in the different second excitation mode.
- the first scaling factor may be applied to an absolute voltage received from the one electrode of the first pair of monitor electrodes in the first excitation mode.
- the technique 600 of FIG. 6 may be illustrated by several examples.
- Table 5 shows respective absolute voltages simulated for one electrode of each respective monitor electrode pair using finite element modeling using a problem geometry (e.g., wellbore and array configuration, and material parameters) similar to the example of FIG. 5.
- Table 5 The values modeled in Table 5, above, may be divided with the voltage difference measurements shown in the example of Table 1 , such as to obtain a table of ratios of absolute-to-differential voltages as shown in Table 6, below.
- the absolute voltage received from a particular monitor electrode is referred to as VMN, where N refers to the monitor electrode position.
- VMN The absolute voltage received from monitor electrode Mi and pair M ls M 2 in mode E 3 are used to approximate VM 1 ,M 2 in other modes, such as E 4 , E 5 , or E 6 .
- Estimates derived using one ratio can be re-used for other estimates, such as the estimate VM threadM 2 (E 4 ) , indicated by an overbar notation. Simulated results using the technique shown in the illustrative example above are included below in Table 7, and again, show agreement with the results of Table 1.
- the approximated (e.g., estimated) measurements are shown as underlined in Table 7.
- the simulated results indicate that errors associated with the estimation technique are larger in the example of Table 7 (up to 2%, for example), as compared to the example of Table 4.
- the technique of FIG. 6 as illustratively simulated in Table 7 may still be used in environments where the voltage measurements are excessively noisy.
- the techniques shown illustratively in FIGS. 5 and 6 include forming estimates based on measurements or ratios of measurements received from two different excitation modes, for example.
- the present inventors have also recognized that such techniques can be further extended, such as including using measurements or ratios of measurements from more than two excitation modes.
- the techniques discussed in relation to the examples of FIGS. 5 through 6, and elsewhere herein, may be used to estimate a conductive measurement corresponding to a first pair of measurement electrodes, such as using values received from other electrodes or electrode pairs or values received from the first electrode pair in a different excitation mode.
- the techniques of FIGS. 5 through 6 generally assume that other parameters of measurement, such as the formation resistivity, are roughly similar for each measurement electrode pair and for each excitation mode.
- the present inventors have also recognized that relationships between measurements (or models) generated for different formation resistivities may be used to estimate a voltage difference measurement obtainable from a respective pair of monitor electrodes.
- FIG. 7 illustrates generally an example of a technique 700, such as a method, including estimating a voltage difference corresponding to a first pair of monitor electrodes in a first excitation mode using information about respective voltage differences received from a second pair of monitor electrodes respectively corresponding to a first resistivity and a different second resistivity.
- a scaling factor may be determined using information about respective voltage differences received from a second pair of monitor electrodes corresponding to a first resistivity and a different second resistivity.
- the scaling factor may be applied to a voltage difference received from the first pair of monitor electrodes corresponding to the different second resistivity, such as to obtain an estimated voltage difference between the first pair of electrodes corresponding to the first resistivity as could be received in the first excitation mode.
- the voltage difference received from the first pair of monitor electrodes corresponding to the second resistivity could be either received experimentally or modeled as a function of various parameters, such as a tool radius, borehole standoff from an electrode surface, an assumed mud resistivity, an assumed formation resistivity, or one or more ranges corresponding to such parameters.
- Table 8 differs from Table 1.
- a ratio of the results of Table 8 with respect to corresponding elements in Table 1 may be determined, such as shown in the illustrative example of Table 9, below.
- elements of Table 9 again show similar ratio values and correspond to electrode combinations and excitation modes that generally exhibit a high sensitivity to system or
- the differential voltage VM 9 , M 10 in excitation mode ⁇ would generally have the highest amplitude and thus may be used to generate the results for the other combinations having a similar ratio as shown in the underlined portions of Table 9.
- the ratio VM 9 ,Mio corresponding to excitation mode E 6 could be used to estimate or approximate electrode and excitation combinations in other portions of Table 8, such as using a relation:
- VM 2 i-i M 2 represents a voltage difference between the (2i-l)-th and the 2i-th monitor electrodes, corresponding to excitation mode Ek, where k is the excitation mode, and with formation resistivity Rf as shown.
- the underlined voltage differences are approximated using the relation illustrated generally above, such as corresponding to a formation resistivity of 40,000 ⁇ -m as may be approximated by a measurement or using a modeled value from a formation having a different resistivity of 100,000 ⁇ -m.
- the values provided herein e.g., 40,000 ⁇ -m and 100,000 ⁇ -m are illustrative in nature, and other resistivity values may be used.
- the expression VM 2 i -1 ,M 2 i may also be approximated using other measurements including using measurements or simulated values determined as a function of borehole diameter, tool diameter, or borehole standoff from a surface of the electrode located along the tool body.
- other combinations of electrode pairs may be used, including measurements received from a higher formation resistivity (e.g., about 100,000 ⁇ -m) to estimate or otherwise derive approximations of measurements corresponding to a lower formation resistivity (e.g., about 40,000 ⁇ -m in the illustrative examples herein).
- a relation show below may be used, such as using measurements from a different electrode combination than the previous example:
- Tables of modeled values may be pre- calculated and stored or determined on-the-fly, and may be retrieved such as in response to one or more of a user input or a detected resistivity range of a formation, or in response to one or more other input parameters or detected parameters such as a tool radius, borehole radius, or standoff between a borehole wall and a surface of an electrode.
- the techniques described in FIGS. 5 through 7 were further modeled or verified, such as using a Monte Carlo simulation. For example, the following relationships were established, using notation similar to the examples
- FIGS. 5 through 7 provide a significant improvement in error tolerance, particularly for formation resistivities of about 1000 ⁇ -m or greater when probed from a mud having a resistivity of about 0.02 ⁇ -m.
- Such Monte Carlo techniques may be used, such as to establish a resistivity or voltage threshold that may be used to toggle a laterolog apparatus between using conductively-received voltage measurements in all excitation modes, versus using estimates of certain voltage measurements for certain electrode combinations when a high formation resistivity is detected, suspected, or indicated by a user, or when a particularly low mud resistivity is detected, suspected, or indicated by a user.
- FIG. 8 illustrates generally an example of a technique, such as a method, including comparing information indicative of a measured signal (e.g., a conductively received signal from a monitor electrode) to a specified threshold, and in response, determining a resistivity using an estimated induced signal or inhibiting determining the resistivity using the estimated induced signal.
- a measured signal e.g., a conductively received signal from a monitor electrode
- information indicative of a measured signal from a monitor electrode may be compared to a threshold.
- the signal need not be received from a monitor electrode for which an estimate or substitution will be made, because other monitor electrodes may still provide useful information indicative of whether a formation resistivity is sufficiently high to warrant using an approximation or estimate rather than a full rank of measured electrode combinations.
- a threshold may be applied to a differential measurement received from VM 1 ,M 2 (E 1 ), and if the voltage difference is less than the threshold, estimates such as discussed in the examples of FIGS. 5 through 7 may be used.
- Such a threshold may be established at least in part using information about a resistance or resistivity criterion, indicative of a relative or absolute formation resistivity, such as compared to a mud resistivity. For example, at 804, if the information indicative of the measured signal is below the threshold (e.g., a sensed voltage is below a specified threshold), one or more estimation techniques may be used in support of determining a resistivity estimate, such as in lieu of obtaining actual measurements for those
- estimation activities may be suppressed, inhibited, or scaled back because reliable voltage measurements may be performed in some or all excitation modes.
- FIG. 9 illustrates generally an example of a drilling apparatus
- FIG. 9 may include apparatus such as shown in FIGS. 1 through 2, or may be used with techniques discussed in relation to FIGS. 3, 4A through E, or 5 through 8.
- a drilling rig or platform 902 generally includes a derrick 904 or other supporting structure, such as including or coupled to a hoist 906.
- the hoist 906 may be used for raising or lowering equipment or other apparatus such as drill string 908.
- the drill string 908 may access a borehole 916, such as through a well head 912.
- the lower end of the drill string 908 may include various apparatus, such as a drill head 914, such as to provide the borehole 916.
- a drilling fluid or "mud” may be circulated in the annular region around the drill head 914 or elsewhere, such as provided to the borehole 916 through a supply pipe 922, circulated by a pump 920, and returning to the surface to be captured in a retention pit 624 or sump.
- Various subs or tool assemblies may be located along the drill string 908, such as include a bottom hole assembly (BHA) 926 or a second sub 928.
- BHA bottom hole assembly
- the BHA 926, or the second sub 928 may include apparatus such as shown in the examples of FIGS.
- the second sub 928 may include wireless telemetry or logging capabilities, or both, such as to transmit or later provide information indicative of a formation resistivity to operators on the surface or for later access in evaluation of formation 918 properties.
- portions 930 of the apparatus 900 at the surface may include one or more of wireless telemetry, processor circuitry, or memory facilities, such as to support log-while-drilling (LWD) or measurement-while-drilling (MWD) operations.
- FIG. 10 illustrates generally an example of a wireline logging apparatus.
- the illustrative example of FIG. 10 may include apparatus such as shown in FIGS. 1 through 2, or may be used with techniques discussed in relation to FIGS. 3, 4A through 4E, or 5 through 8.
- a hoist 906 may be included as a portion of a platform 902, such as coupled to a derrick 904, and used to raise or lower equipment such as a wireline sonde 1050 into or out of a borehole.
- a cable 1042 may provide a communicative coupling between a logging facility 1044 (e.g., including a processor circuit 1045 or other storage or control circuitry) and the sonde 1050.
- a logging facility 1044 e.g., including a processor circuit 1045 or other storage or control circuitry
- information about the formation 918 may be obtained, such as using an array laterolog tool included as at least a portion of the sonde 1050 as discussed in other examples herein (e.g., a laterolog tool including apparatus 100 as in FIG. 1 or apparatus 200 as in FIG. 2).
- an array laterolog tool included as at least a portion of the sonde 1050 as discussed in other examples herein (e.g., a laterolog tool including apparatus 100 as in FIG. 1 or apparatus 200 as in FIG. 2).
- FIGS. 9 and 10 show a vertically-oriented borehole configuration.
- the apparatus and techniques described herein may also be used in other borehole configurations, such as a borehole including a horizontal penetration direction, or an oblique borehole configuration, for example.
- the examples of FIGS. 9 and 10 also generally illustrate land-based examples.
- apparatus and techniques described herein may be used in offshore environments as well, such as for subsea operations.
- offshore or subsea operations may include use of wireline or LWD/MWD apparatus and techniques including aspects of the examples herein.
- inventive subject matter may be referred to herein, individually and/or collectively, by the term "invention" merely for convenience and without intending to voluntarily limit the scope of this application to any single invention or inventive concept if more than one is in fact disclosed.
- inventive subject matter may be referred to herein, individually and/or collectively, by the term "invention" merely for convenience and without intending to voluntarily limit the scope of this application to any single invention or inventive concept if more than one is in fact disclosed.
- inventive subject matter merely for convenience and without intending to voluntarily limit the scope of this application to any single invention or inventive concept if more than one is in fact disclosed.
Landscapes
- Life Sciences & Earth Sciences (AREA)
- Engineering & Computer Science (AREA)
- Geology (AREA)
- General Life Sciences & Earth Sciences (AREA)
- Environmental & Geological Engineering (AREA)
- Physics & Mathematics (AREA)
- Remote Sensing (AREA)
- General Physics & Mathematics (AREA)
- Geophysics (AREA)
- Mining & Mineral Resources (AREA)
- Geochemistry & Mineralogy (AREA)
- Fluid Mechanics (AREA)
- Geophysics And Detection Of Objects (AREA)
- Investigating Or Analyzing Materials By The Use Of Electric Means (AREA)
Abstract
Description




Claims
Priority Applications (6)
| Application Number | Priority Date | Filing Date | Title |
|---|---|---|---|
| US14/899,948 US10502856B2 (en) | 2013-08-14 | 2013-08-14 | Array laterolog tool techniques |
| BR112015031256A BR112015031256A2 (en) | 2013-08-14 | 2013-08-14 | method for obtaining information indicating a forming resistivity, readable medium by processor and apparatus |
| AU2013397964A AU2013397964B2 (en) | 2013-08-14 | 2013-08-14 | Improved array laterolog tool techniques |
| EP13891468.4A EP2999850A1 (en) | 2013-08-14 | 2013-08-14 | Improved array laterolog tool techniques |
| PCT/US2013/054879 WO2015023271A1 (en) | 2013-08-14 | 2013-08-14 | Improved array laterolog tool techniques |
| MX2015017038A MX2015017038A (en) | 2013-08-14 | 2013-08-14 | Improved array laterolog tool techniques. |
Applications Claiming Priority (1)
| Application Number | Priority Date | Filing Date | Title |
|---|---|---|---|
| PCT/US2013/054879 WO2015023271A1 (en) | 2013-08-14 | 2013-08-14 | Improved array laterolog tool techniques |
Publications (1)
| Publication Number | Publication Date |
|---|---|
| WO2015023271A1 true WO2015023271A1 (en) | 2015-02-19 |
Family
ID=52468537
Family Applications (1)
| Application Number | Title | Priority Date | Filing Date |
|---|---|---|---|
| PCT/US2013/054879 Ceased WO2015023271A1 (en) | 2013-08-14 | 2013-08-14 | Improved array laterolog tool techniques |
Country Status (6)
| Country | Link |
|---|---|
| US (1) | US10502856B2 (en) |
| EP (1) | EP2999850A1 (en) |
| AU (1) | AU2013397964B2 (en) |
| BR (1) | BR112015031256A2 (en) |
| MX (1) | MX2015017038A (en) |
| WO (1) | WO2015023271A1 (en) |
Cited By (6)
| Publication number | Priority date | Publication date | Assignee | Title |
|---|---|---|---|---|
| CN105484740A (en) * | 2015-12-04 | 2016-04-13 | 中国石油天然气集团公司 | Multi-frequency detection device for detecting stratum complex resistivity |
| EP2989291A4 (en) * | 2014-06-10 | 2016-10-19 | Halliburton Energy Services Inc | Resistivity logging tool with excitation current control |
| US9696451B2 (en) | 2014-06-10 | 2017-07-04 | Halliburton Energy Services, Inc. | Resistivity logging tool with excitation current control based on multi-cycle comparison |
| US9983329B2 (en) | 2015-06-05 | 2018-05-29 | Halliburton Energy Services, Inc. | Sensor system for downhole galvanic measurements |
| US10502856B2 (en) | 2013-08-14 | 2019-12-10 | Halliburton Energy Services, Inc. | Array laterolog tool techniques |
| CN112696195A (en) * | 2019-10-23 | 2021-04-23 | 中国石油天然气股份有限公司 | Method and device for determining azimuthal anisotropy of formation resistivity |
Families Citing this family (3)
| Publication number | Priority date | Publication date | Assignee | Title |
|---|---|---|---|---|
| WO2015142352A1 (en) | 2014-03-21 | 2015-09-24 | Halliburton Energy Services, Inc. | Electromagnetic formation evaluation tool apparatus and method |
| CN107524438B (en) * | 2017-07-26 | 2024-09-27 | 杭州迅美科技有限公司 | Drill collar azimuth array lateral logging instrument with edge detection capability and measuring method thereof |
| CN111929740B (en) * | 2020-07-30 | 2022-06-03 | 吉辰智能设备集团有限公司 | An array lateral logging tool and its control method |
Citations (5)
| Publication number | Priority date | Publication date | Assignee | Title |
|---|---|---|---|---|
| US4335353A (en) * | 1979-06-18 | 1982-06-15 | Schlumberger Technology Corporation | Method and apparatus for detecting an anomaly in a resistivity measurement of an earth formation |
| US4882542A (en) * | 1986-11-04 | 1989-11-21 | Paramagnetic Logging, Inc. | Methods and apparatus for measurement of electronic properties of geological formations through borehole casing |
| US20080252296A1 (en) * | 2005-12-13 | 2008-10-16 | Halliburton Energy Services, Inc. | Multiple Frequency Based Leakage Correction for Imaging in Oil Based Muds |
| US20080272789A1 (en) * | 2005-11-04 | 2008-11-06 | San Martin Luis E | Permittivity Measurements With Oil-Based Mud Imaging Tool |
| WO2012067599A1 (en) * | 2010-11-15 | 2012-05-24 | Halliburton Energy Services, Inc. | Multi-array laterolog tools and methods |
Family Cites Families (6)
| Publication number | Priority date | Publication date | Assignee | Title |
|---|---|---|---|---|
| US6023168A (en) | 1995-08-21 | 2000-02-08 | Schlumberger Technology Corporation | Apparatus and method for measuring the resistivity of underground formations |
| US7046010B2 (en) | 2003-12-22 | 2006-05-16 | Halliburton Energy Services, Inc. | Multi-mode microresistivity tool in boreholes drilled with conductive mud |
| US7109719B2 (en) | 2004-05-11 | 2006-09-19 | Baker Hughes Incorporated | Method and apparatus for azimuthal resistivity measurements in a borehole |
| US9547100B2 (en) * | 2010-11-15 | 2017-01-17 | Halliburton Energy Services, Inc. | Multi-array laterolog tools and methods with differential voltage measurements |
| EP2872930A1 (en) | 2012-07-13 | 2015-05-20 | Halliburton Energy Services, Inc. | System and method of focusing an array laterolog |
| AU2013397964B2 (en) | 2013-08-14 | 2016-11-17 | Halliburton Energy Services, Inc. | Improved array laterolog tool techniques |
-
2013
- 2013-08-14 AU AU2013397964A patent/AU2013397964B2/en not_active Ceased
- 2013-08-14 EP EP13891468.4A patent/EP2999850A1/en not_active Withdrawn
- 2013-08-14 MX MX2015017038A patent/MX2015017038A/en unknown
- 2013-08-14 WO PCT/US2013/054879 patent/WO2015023271A1/en not_active Ceased
- 2013-08-14 BR BR112015031256A patent/BR112015031256A2/en not_active Application Discontinuation
- 2013-08-14 US US14/899,948 patent/US10502856B2/en active Active
Patent Citations (5)
| Publication number | Priority date | Publication date | Assignee | Title |
|---|---|---|---|---|
| US4335353A (en) * | 1979-06-18 | 1982-06-15 | Schlumberger Technology Corporation | Method and apparatus for detecting an anomaly in a resistivity measurement of an earth formation |
| US4882542A (en) * | 1986-11-04 | 1989-11-21 | Paramagnetic Logging, Inc. | Methods and apparatus for measurement of electronic properties of geological formations through borehole casing |
| US20080272789A1 (en) * | 2005-11-04 | 2008-11-06 | San Martin Luis E | Permittivity Measurements With Oil-Based Mud Imaging Tool |
| US20080252296A1 (en) * | 2005-12-13 | 2008-10-16 | Halliburton Energy Services, Inc. | Multiple Frequency Based Leakage Correction for Imaging in Oil Based Muds |
| WO2012067599A1 (en) * | 2010-11-15 | 2012-05-24 | Halliburton Energy Services, Inc. | Multi-array laterolog tools and methods |
Cited By (8)
| Publication number | Priority date | Publication date | Assignee | Title |
|---|---|---|---|---|
| US10502856B2 (en) | 2013-08-14 | 2019-12-10 | Halliburton Energy Services, Inc. | Array laterolog tool techniques |
| EP2989291A4 (en) * | 2014-06-10 | 2016-10-19 | Halliburton Energy Services Inc | Resistivity logging tool with excitation current control |
| US9696451B2 (en) | 2014-06-10 | 2017-07-04 | Halliburton Energy Services, Inc. | Resistivity logging tool with excitation current control based on multi-cycle comparison |
| US10001581B2 (en) | 2014-06-10 | 2018-06-19 | Halliburton Energy Services, Inc. | Resistivity logging tool with excitation current control |
| US9983329B2 (en) | 2015-06-05 | 2018-05-29 | Halliburton Energy Services, Inc. | Sensor system for downhole galvanic measurements |
| CN105484740A (en) * | 2015-12-04 | 2016-04-13 | 中国石油天然气集团公司 | Multi-frequency detection device for detecting stratum complex resistivity |
| CN112696195A (en) * | 2019-10-23 | 2021-04-23 | 中国石油天然气股份有限公司 | Method and device for determining azimuthal anisotropy of formation resistivity |
| CN112696195B (en) * | 2019-10-23 | 2023-11-28 | 中国石油天然气股份有限公司 | Method and device for determining azimuthal anisotropy of formation resistivity |
Also Published As
| Publication number | Publication date |
|---|---|
| AU2013397964B2 (en) | 2016-11-17 |
| EP2999850A1 (en) | 2016-03-30 |
| US10502856B2 (en) | 2019-12-10 |
| MX2015017038A (en) | 2016-08-03 |
| US20160139289A1 (en) | 2016-05-19 |
| AU2013397964A1 (en) | 2016-01-07 |
| BR112015031256A2 (en) | 2017-07-25 |
Similar Documents
| Publication | Publication Date | Title |
|---|---|---|
| AU2013397964B2 (en) | Improved array laterolog tool techniques | |
| US10928543B2 (en) | Electrical log processing near casing point | |
| EP3108272B1 (en) | Electromagnetic transient measurement tool mounted on reduced conductivity tubular | |
| CA2746377A1 (en) | Method and apparatus for directional well logging | |
| US10031254B2 (en) | Electrode-based tool measurement corrections based on leakage currents estimated using a predetermined internal impedance model or table | |
| US9921332B2 (en) | Crosstalk suppression or removal for galvanic measurements | |
| AU2014415609B2 (en) | Locating multiple wellbores | |
| ZA200503381B (en) | A method for resistivity anisotropy determination in near vertical wells | |
| US10830039B2 (en) | Downhole tri-axial induction electromagnetic tool | |
| WO2016057948A1 (en) | Electrode-based tool measurement corrections based on measured leakage currents | |
| US10302805B2 (en) | System and methods for obtaining compensated electromagnetic measurements | |
| US20150134254A1 (en) | Focused array laterolog tool | |
| US10502860B2 (en) | Method for placement of surface electrodes for electromagnetic telemetry | |
| US20100213943A1 (en) | Method for accentuating signal from ahead of the bit | |
| US11294092B2 (en) | Low frequency complex resistivity measurement in a formation | |
| US20190162872A1 (en) | System and Method of Estimating Leakage Current Distribution Along Long Conductor Extending into the Earth | |
| US20100049442A1 (en) | Processing of azimuthal resistivity data in a resistivity gradient | |
| BR112012006065B1 (en) | method and apparatus for estimating a parameter of interest for underground formation | |
| US20190226328A1 (en) | Modelling electromagnetic telemetry signals in deviated wells | |
| Brambilla et al. | Improved laterolog resistivity measurements provide real-time true formation resistivity and invasion parameters |
Legal Events
| Date | Code | Title | Description |
|---|---|---|---|
| 121 | Ep: the epo has been informed by wipo that ep was designated in this application |
Ref document number: 13891468 Country of ref document: EP Kind code of ref document: A1 |
|
| WWE | Wipo information: entry into national phase |
Ref document number: MX/A/2015/017038 Country of ref document: MX |
|
| WWE | Wipo information: entry into national phase |
Ref document number: 14899948 Country of ref document: US |
|
| REEP | Request for entry into the european phase |
Ref document number: 2013891468 Country of ref document: EP |
|
| WWE | Wipo information: entry into national phase |
Ref document number: 2013891468 Country of ref document: EP |
|
| REG | Reference to national code |
Ref country code: BR Ref legal event code: B01A Ref document number: 112015031256 Country of ref document: BR |
|
| ENP | Entry into the national phase |
Ref document number: 2013397964 Country of ref document: AU Date of ref document: 20130814 Kind code of ref document: A |
|
| NENP | Non-entry into the national phase |
Ref country code: DE |
|
| ENP | Entry into the national phase |
Ref document number: 112015031256 Country of ref document: BR Kind code of ref document: A2 Effective date: 20151214 |