JP7407940B2 - Image processing device and method, image display device, program and recording medium - Google Patents
Image processing device and method, image display device, program and recording medium Download PDFInfo
- Publication number
- JP7407940B2 JP7407940B2 JP2022536068A JP2022536068A JP7407940B2 JP 7407940 B2 JP7407940 B2 JP 7407940B2 JP 2022536068 A JP2022536068 A JP 2022536068A JP 2022536068 A JP2022536068 A JP 2022536068A JP 7407940 B2 JP7407940 B2 JP 7407940B2
- Authority
- JP
- Japan
- Prior art keywords
- image
- conversion table
- value
- input image
- output
- Prior art date
- Legal status (The legal status is an assumption and is not a legal conclusion. Google has not performed a legal analysis and makes no representation as to the accuracy of the status listed.)
- Active
Links
Images


Classifications
-
- G—PHYSICS
- G09—EDUCATION; CRYPTOGRAPHY; DISPLAY; ADVERTISING; SEALS
- G09G—ARRANGEMENTS OR CIRCUITS FOR CONTROL OF INDICATING DEVICES USING STATIC MEANS TO PRESENT VARIABLE INFORMATION
- G09G3/00—Control arrangements or circuits, of interest only in connection with visual indicators other than cathode-ray tubes
- G09G3/20—Control arrangements or circuits, of interest only in connection with visual indicators other than cathode-ray tubes for presentation of an assembly of a number of characters, e.g. a page, by composing the assembly by combination of individual elements arranged in a matrix no fixed position being assigned to or needed to be assigned to the individual characters or partial characters
- G09G3/22—Control arrangements or circuits, of interest only in connection with visual indicators other than cathode-ray tubes for presentation of an assembly of a number of characters, e.g. a page, by composing the assembly by combination of individual elements arranged in a matrix no fixed position being assigned to or needed to be assigned to the individual characters or partial characters using controlled light sources
- G09G3/30—Control arrangements or circuits, of interest only in connection with visual indicators other than cathode-ray tubes for presentation of an assembly of a number of characters, e.g. a page, by composing the assembly by combination of individual elements arranged in a matrix no fixed position being assigned to or needed to be assigned to the individual characters or partial characters using controlled light sources using electroluminescent panels
- G09G3/32—Control arrangements or circuits, of interest only in connection with visual indicators other than cathode-ray tubes for presentation of an assembly of a number of characters, e.g. a page, by composing the assembly by combination of individual elements arranged in a matrix no fixed position being assigned to or needed to be assigned to the individual characters or partial characters using controlled light sources using electroluminescent panels semiconductive, e.g. using light-emitting diodes [LED]
-
- G—PHYSICS
- G09—EDUCATION; CRYPTOGRAPHY; DISPLAY; ADVERTISING; SEALS
- G09G—ARRANGEMENTS OR CIRCUITS FOR CONTROL OF INDICATING DEVICES USING STATIC MEANS TO PRESENT VARIABLE INFORMATION
- G09G5/00—Control arrangements or circuits for visual indicators common to cathode-ray tube indicators and other visual indicators
- G09G5/10—Intensity circuits
-
- G—PHYSICS
- G06—COMPUTING OR CALCULATING; COUNTING
- G06T—IMAGE DATA PROCESSING OR GENERATION, IN GENERAL
- G06T5/00—Image enhancement or restoration
- G06T5/40—Image enhancement or restoration using histogram techniques
-
- G—PHYSICS
- G06—COMPUTING OR CALCULATING; COUNTING
- G06T—IMAGE DATA PROCESSING OR GENERATION, IN GENERAL
- G06T5/00—Image enhancement or restoration
- G06T5/60—Image enhancement or restoration using machine learning, e.g. neural networks
-
- G—PHYSICS
- G06—COMPUTING OR CALCULATING; COUNTING
- G06T—IMAGE DATA PROCESSING OR GENERATION, IN GENERAL
- G06T5/00—Image enhancement or restoration
- G06T5/90—Dynamic range modification of images or parts thereof
- G06T5/92—Dynamic range modification of images or parts thereof based on global image properties
-
- G—PHYSICS
- G09—EDUCATION; CRYPTOGRAPHY; DISPLAY; ADVERTISING; SEALS
- G09G—ARRANGEMENTS OR CIRCUITS FOR CONTROL OF INDICATING DEVICES USING STATIC MEANS TO PRESENT VARIABLE INFORMATION
- G09G5/00—Control arrangements or circuits for visual indicators common to cathode-ray tube indicators and other visual indicators
- G09G5/003—Details of a display terminal, the details relating to the control arrangement of the display terminal and to the interfaces thereto
-
- G—PHYSICS
- G09—EDUCATION; CRYPTOGRAPHY; DISPLAY; ADVERTISING; SEALS
- G09G—ARRANGEMENTS OR CIRCUITS FOR CONTROL OF INDICATING DEVICES USING STATIC MEANS TO PRESENT VARIABLE INFORMATION
- G09G5/00—Control arrangements or circuits for visual indicators common to cathode-ray tube indicators and other visual indicators
- G09G5/02—Control arrangements or circuits for visual indicators common to cathode-ray tube indicators and other visual indicators characterised by the way in which colour is displayed
-
- G—PHYSICS
- G06—COMPUTING OR CALCULATING; COUNTING
- G06T—IMAGE DATA PROCESSING OR GENERATION, IN GENERAL
- G06T2207/00—Indexing scheme for image analysis or image enhancement
- G06T2207/10—Image acquisition modality
- G06T2207/10024—Color image
-
- G—PHYSICS
- G06—COMPUTING OR CALCULATING; COUNTING
- G06T—IMAGE DATA PROCESSING OR GENERATION, IN GENERAL
- G06T2207/00—Indexing scheme for image analysis or image enhancement
- G06T2207/20—Special algorithmic details
- G06T2207/20081—Training; Learning
-
- G—PHYSICS
- G06—COMPUTING OR CALCULATING; COUNTING
- G06T—IMAGE DATA PROCESSING OR GENERATION, IN GENERAL
- G06T2207/00—Indexing scheme for image analysis or image enhancement
- G06T2207/20—Special algorithmic details
- G06T2207/20084—Artificial neural networks [ANN]
-
- G—PHYSICS
- G09—EDUCATION; CRYPTOGRAPHY; DISPLAY; ADVERTISING; SEALS
- G09G—ARRANGEMENTS OR CIRCUITS FOR CONTROL OF INDICATING DEVICES USING STATIC MEANS TO PRESENT VARIABLE INFORMATION
- G09G2320/00—Control of display operating conditions
- G09G2320/02—Improving the quality of display appearance
- G09G2320/0271—Adjustment of the gradation levels within the range of the gradation scale, e.g. by redistribution or clipping
- G09G2320/0276—Adjustment of the gradation levels within the range of the gradation scale, e.g. by redistribution or clipping for the purpose of adaptation to the characteristics of a display device, i.e. gamma correction
-
- G—PHYSICS
- G09—EDUCATION; CRYPTOGRAPHY; DISPLAY; ADVERTISING; SEALS
- G09G—ARRANGEMENTS OR CIRCUITS FOR CONTROL OF INDICATING DEVICES USING STATIC MEANS TO PRESENT VARIABLE INFORMATION
- G09G2320/00—Control of display operating conditions
- G09G2320/02—Improving the quality of display appearance
- G09G2320/0285—Improving the quality of display appearance using tables for spatial correction of display data
-
- G—PHYSICS
- G09—EDUCATION; CRYPTOGRAPHY; DISPLAY; ADVERTISING; SEALS
- G09G—ARRANGEMENTS OR CIRCUITS FOR CONTROL OF INDICATING DEVICES USING STATIC MEANS TO PRESENT VARIABLE INFORMATION
- G09G2330/00—Aspects of power supply; Aspects of display protection and defect management
- G09G2330/02—Details of power systems and of start or stop of display operation
- G09G2330/021—Power management, e.g. power saving
-
- G—PHYSICS
- G09—EDUCATION; CRYPTOGRAPHY; DISPLAY; ADVERTISING; SEALS
- G09G—ARRANGEMENTS OR CIRCUITS FOR CONTROL OF INDICATING DEVICES USING STATIC MEANS TO PRESENT VARIABLE INFORMATION
- G09G2360/00—Aspects of the architecture of display systems
- G09G2360/16—Calculation or use of calculated indices related to luminance levels in display data
-
- G—PHYSICS
- G09—EDUCATION; CRYPTOGRAPHY; DISPLAY; ADVERTISING; SEALS
- G09G—ARRANGEMENTS OR CIRCUITS FOR CONTROL OF INDICATING DEVICES USING STATIC MEANS TO PRESENT VARIABLE INFORMATION
- G09G2370/00—Aspects of data communication
- G09G2370/08—Details of image data interface between the display device controller and the data line driver circuit
Landscapes
- Engineering & Computer Science (AREA)
- Physics & Mathematics (AREA)
- General Physics & Mathematics (AREA)
- Theoretical Computer Science (AREA)
- Computer Hardware Design (AREA)
- Image Processing (AREA)
- Control Of Indicators Other Than Cathode Ray Tubes (AREA)
- Controls And Circuits For Display Device (AREA)
- Control Of El Displays (AREA)
- Transforming Electric Information Into Light Information (AREA)
Description
本開示は、画像処理装置及び方法、並びに画像表示装置に関する。特にLEDディスプレイなどの自発光型の画像表示装置の消費電力を低減するための技術に関する。本開示はまた、プログラム及び記録媒体に関する。 The present disclosure relates to an image processing device and method, and an image display device. In particular, the present invention relates to technology for reducing power consumption of self-luminous image display devices such as LED displays. The present disclosure also relates to programs and recording media.
LEDディスプレイ、有機ELディスプレイなどの自発光型のディスプレイは、画面内の平均表示輝度が高いほど消費電力が多い。表示画像を一律に暗く表示すれば消費電力は低減できるが、視認性も劣化する。このため、画質の維持と消費電力の低減の両立が技術課題である。 Self-luminous displays such as LED displays and organic EL displays consume more power as the average display brightness within the screen increases. Although power consumption can be reduced by displaying a display image uniformly dark, visibility also deteriorates. Therefore, a technical challenge is to maintain both image quality and reduce power consumption.
特許文献1では、画面内の人の視線が集中する領域を基準領域とし、基準領域から遠ざかるに従って元画像の表示輝度を緩やかに低減させることで基準領域における輝度削減を最小限に抑制しながら、消費電力を低減させる方法が提案されている。
In
特許文献1に記載の技術では、パブリックディスプレイのように、人によって注視する箇所が異なる状況では十分な効果が得られない場合がある。また、CG(コンピュータグラフィックス)ように階調変化の少ない画像ではムラが見えてしまう。
The technique described in
本開示は、表示画像の視認性を維持しつつ消費電力を低減し得る技術を提供することを目的とする。 An object of the present disclosure is to provide a technique that can reduce power consumption while maintaining the visibility of a displayed image.
本開示の一つの態様に係る画像表示装置は、
入力画像に基づいて出力画像を生成し、前記出力画像を自発光型の画像表示部に供給して画像表示を行なわせる画像処理装置において、
前記入力画像の平均輝度を算出する平均輝度算出部と、
前記入力画像の階調値の階級毎の出現度数を表すヒストグラムを生成するヒストグラム生成部と、
前記入力画像のピーク輝度を算出するピーク輝度算出部と、
前記平均輝度と前記ヒストグラムと前記ピーク輝度とから、前記入力画像の階調値と前記出力画像の階調値との関係を規定する変換テーブルを生成する変換テーブル生成部と、
前記変換テーブルを用いて前記入力画像を変換して前記出力画像を生成する画像変換部とを備え、
前記変換テーブル生成部は、前記平均輝度を予め定められた閾値と比較し、
前記平均輝度が前記閾値より低いときは、前記変換テーブル生成部は、前記変換テーブルとして、前記入力画像の階調値がそのまま出力画像の階調値となる変換テーブルを生成し、
前記平均輝度が前記閾値以上のときは、前記変換テーブル生成部は、前記変換テーブルとして、前記入力画像の階調値が前記ピーク輝度に等しいときは前記出力画像の階調値も前記ピーク輝度に等しく、前記入力画像の階調値が0よりも高く前記ピーク輝度よりも低い範囲の少なくとも一部では、前記出力画像の階調値が前記入力画像の階調値よりも小さく、前記入力画像において出現度数の多い階調値範囲で、前記入力画像の階調値の変化に対する前記出力画像の階調値の変化が比較的大きく、前記入力画像において出現度数の少ない階調値範囲で、前記入力画像の階調値の変化に対する前記出力画像の階調値の変化が比較的小さい変換テーブルを生成し、
前記平均輝度が前記閾値以上のときに前記変換テーブル生成部により生成される前記変換テーブルは、前記入力画像の階調値と第1出力階調値との関係を規定する第1変換テーブルと、前記入力画像の階調値と第2出力階調値との関係を規定する第2変換テーブルとを重畳することにより生成されるものであり、
前記変換テーブル生成部は、前記入力画像の階調値が0よりも高く前記ピーク輝度よりも低い範囲の少なくとも一部において前記入力画像の階調値よりも小さい値を前記第1出力階調値とすることで前記第1変換テーブルを生成し、
前記変換テーブル生成部は、前記ヒストグラムから累積密度関数を生成し、前記累積密度関数の値又は前記累積密度関数の傾きに対して制限を加えた曲線の値を前記第2出力階調値とすることで前記第2変換テーブルを生成する。
本開示の他の態様に係る画像表示装置は、
入力画像に基づいて出力画像を生成する画像処理装置において、
前記入力画像の平均輝度を算出する平均輝度算出部と、
前記入力画像の階調値の階級毎の出現度数を表すヒストグラムを生成するヒストグラム生成部と、
前記入力画像のピーク輝度を算出するピーク輝度算出部と、
前記平均輝度と前記ヒストグラムと前記ピーク輝度とから、前記入力画像の階調値と前記出力画像の階調値との関係を規定する変換テーブルを生成する変換テーブル生成部と、
前記変換テーブルを用いて前記入力画像を変換して前記出力画像を生成する画像変換部とを備え、
前記変換テーブル生成部は、前記平均輝度を予め定められた閾値と比較し、
前記平均輝度が前記閾値より低いときは、前記変換テーブル生成部は、前記変換テーブルとして、前記入力画像の階調値がそのまま出力画像の階調値となる変換テーブルを生成し、
前記平均輝度が前記閾値以上のときは、前記変換テーブル生成部は、前記変換テーブルとして、前記入力画像の階調値が0よりも高く前記ピーク輝度よりも低い範囲の少なくとも一部では、前記出力画像の階調値が前記入力画像の階調値よりも小さく、前記少なくとも一部よりも前記ピーク輝度に近い範囲では、前記出力画像の階調値と前記入力画像の階調値との差が前記少なくとも一部の範囲より小さいか、又は、前記出力画像の階調値が前記入力画像の階調値より大きく、前記入力画像において出現度数の多い階調値範囲で、前記入力画像の階調値の変化に対する前記出力画像の階調値の変化が比較的大きく、前記入力画像において出現度数の少ない階調値範囲で、前記入力画像の階調値の変化に対する前記出力画像の階調値の変化が比較的小さい変換テーブルを生成し、
前記平均輝度が前記閾値以上のときに前記変換テーブル生成部により生成される前記変換テーブルは、前記入力画像の階調値と第1出力階調値との関係を規定する第1変換テーブルと、前記入力画像の階調値と第2出力階調値との関係を規定する第2変換テーブルとを重畳することにより生成されるものであり、
前記変換テーブル生成部は、前記入力画像の階調値が0よりも高く前記ピーク輝度よりも低い範囲の少なくとも一部において前記入力画像の階調値よりも小さい値を前記第1出力階調値とすることで前記第1変換テーブルを生成し、
前記変換テーブル生成部は、前記ヒストグラムから累積密度関数を生成し、前記累積密度関数の値又は前記累積密度関数の傾きに対して制限を加えた曲線の値を前記第2出力階調値とすることで前記第2変換テーブルを生成する。
An image display device according to one aspect of the present disclosure includes:
An image processing device that generates an output image based on an input image, and supplies the output image to a self-luminous image display unit to display the image,
an average brightness calculation unit that calculates the average brightness of the input image;
a histogram generation unit that generates a histogram representing the frequency of appearance for each class of gradation values of the input image;
a peak brightness calculation unit that calculates peak brightness of the input image;
a conversion table generation unit that generates a conversion table that defines a relationship between tone values of the input image and tone values of the output image from the average brightness, the histogram, and the peak brightness;
an image conversion unit that converts the input image using the conversion table to generate the output image,
The conversion table generation unit compares the average brightness with a predetermined threshold,
When the average luminance is lower than the threshold, the conversion table generation unit generates, as the conversion table, a conversion table in which the gradation values of the input image become the gradation values of the output image as they are;
When the average brightness is greater than or equal to the threshold, the conversion table generation unit generates a conversion table that, when the gradation value of the input image is equal to the peak brightness, also sets the gradation value of the output image to the peak brightness. Equally, in at least a part of the range where the tone value of the input image is higher than 0 and lower than the peak brightness, the tone value of the output image is smaller than the tone value of the input image , and the tone value of the input image is lower than the tone value of the input image. In the gradation value range that appears frequently in the gradation value range, the change in the gradation value of the output image with respect to the change in the gradation value of the input image is relatively large; generating a conversion table in which a change in tone value of the output image with respect to a change in tone value of the input image is relatively small ;
The conversion table generated by the conversion table generation unit when the average luminance is equal to or greater than the threshold value includes a first conversion table that defines a relationship between a tone value of the input image and a first output tone value; It is generated by superimposing a second conversion table that defines the relationship between the gradation value of the input image and the second output gradation value,
The conversion table generation unit converts a value smaller than a gradation value of the input image into the first output gradation value in at least a part of a range where the gradation value of the input image is higher than 0 and lower than the peak luminance. Generate the first conversion table by
The conversion table generation unit generates a cumulative density function from the histogram, and sets a value of the cumulative density function or a value of a curve obtained by restricting the slope of the cumulative density function as the second output gradation value. Thus, the second conversion table is generated .
An image display device according to another aspect of the present disclosure includes:
In an image processing device that generates an output image based on an input image,
an average brightness calculation unit that calculates the average brightness of the input image;
a histogram generation unit that generates a histogram representing the frequency of appearance for each class of gradation values of the input image;
a peak brightness calculation unit that calculates peak brightness of the input image;
a conversion table generation unit that generates a conversion table that defines a relationship between tone values of the input image and tone values of the output image from the average brightness, the histogram, and the peak brightness;
an image conversion unit that converts the input image using the conversion table to generate the output image,
The conversion table generation unit compares the average brightness with a predetermined threshold,
When the average luminance is lower than the threshold, the conversion table generation unit generates, as the conversion table, a conversion table in which the gradation values of the input image become the gradation values of the output image as they are;
When the average luminance is greater than or equal to the threshold, the conversion table generation unit generates the output image as the conversion table in at least a part of the range where the gradation value of the input image is higher than 0 and lower than the peak brightness. In a range where the tone value of the image is smaller than the tone value of the input image and closer to the peak luminance than the at least part, the difference between the tone value of the output image and the tone value of the input image is The gradation value of the input image is smaller than the at least part of the range, or the gradation value of the output image is larger than the gradation value of the input image, and the gradation value range is a gradation value range that appears frequently in the input image. The gradation value of the output image with respect to the change in the gradation value of the input image is within a gradation value range in which the change in the gradation value of the output image with respect to the change in the gradation value is relatively large and occurs less frequently in the input image. Generates a conversion table with relatively small changes in
The conversion table generated by the conversion table generation unit when the average luminance is equal to or greater than the threshold value includes a first conversion table that defines a relationship between a tone value of the input image and a first output tone value; It is generated by superimposing a second conversion table that defines the relationship between the gradation value of the input image and the second output gradation value,
The conversion table generation unit converts a value smaller than a gradation value of the input image into the first output gradation value in at least a part of a range where the gradation value of the input image is higher than 0 and lower than the peak luminance. Generate the first conversion table by
The conversion table generation unit generates a cumulative density function from the histogram, and sets a value of the cumulative density function or a value of a curve obtained by restricting the slope of the cumulative density function as the second output gradation value. Thus, the second conversion table is generated .
本開示によれば、表示画像の視認性の維持と、消費電力の低減が可能である。 According to the present disclosure, it is possible to maintain the visibility of a displayed image and reduce power consumption.
実施の形態1.
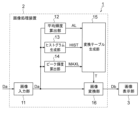
図1は、実施の形態1に係る画像表示装置の構成を示す図である。
図1に示される画像表示装置1は、画像処理装置2と、画像表示部3とを有する。
FIG. 1 is a diagram showing the configuration of an image display device according to the first embodiment.
The
画像表示部3はLED(light-emitting diode)ディスプレイ、有機EL(electroluminescence)などの自発光ディスプレイである。以下では、画像表示部3がLEDディスプレイである場合を想定して説明する。
画像表示部3は、例えば、赤、緑及び青のLEDが配列された表示パネルを有するディスプレイで構成されている。例えば、赤、緑及び青のLEDの組合せによって1つの発光素子が構成され、複数のそのような発光素子が画素としてマトリックス状に規則正しく配置されて、表示パネルが構成されている。The
The
画像処理装置2は、外部から供給される画像(入力画像)Daを補正して出力画像(補正画像)Dbを生成し、出力画像Dbを画像表示部3に表示させる。
画像処理装置2は、画像入力部11、平均輝度算出部12、ヒストグラム生成部13、ピーク輝度算出部14、変換テーブル生成部15、及び画像変換部16を有する。The
The
画像入力部11は、入力画像Daを受信して、出力する。
以下では、画像入力部11は入力画像Daを表すデジタル画像データを受信して出力するデジタルインターフェースであるものとして説明する。しかしながら、画像入力部11は、アナログ画像信号からデジタル画像データに変換するA/D変換器で構成されていても良い。
以下では、画像入力部11から出力されるデジタル画像データが、各画素についてR(赤)成分値、G(緑)成分値、及びB(青)成分値を含み、各成分値が8ビット値で表されるものである場合を想定する。The
In the following description, it is assumed that the
In the following, digital image data output from the
平均輝度算出部12は、各フレームの入力画像Daの平均輝度ALを算出する。
各画素についての輝度は、当該画素についてのR成分値、G成分値、及びB成分値を重み付け加算することで求められる。各フレームの入力画像Daの平均輝度ALは、当該フレームに属するすべての画素についての輝度の平均を求めることで得られる。The average
The brightness for each pixel is determined by weighted addition of the R component value, G component value, and B component value for the pixel. The average brightness AL of the input image Da of each frame is obtained by calculating the average brightness of all pixels belonging to the frame.
ヒストグラム生成部13は、各フレームの入力画像DaからヒストグラムHISTを生成する。
ヒストグラム生成部13は、例えば、各フレームの入力画像Daの画素毎にR成分値、G成分値、及びB成分値の中での最大値、即ち最大成分値Mを算出し、上記の最大成分値Mの階級(ビン)毎の出現度数F(C)を表すヒストグラムHISTを生成する。各階級Cは、相連続する、予め定められた数の最大成分値Mで構成される。以下では、各階級に属する最大成分値Mの数が8であるものとして説明する。
但し、各階級に属する最大成分値Mの数は8以外であっても良い。例えば16であっても良く、また1であっても良い。
各成分値が8ビット値である場合に、各階級に属する最大成分値Mの数が8であれば、階級の数は32である。The
For example, the
However, the number of maximum component values M belonging to each class may be other than eight. For example, it may be 16 or 1.
If each component value is an 8-bit value and the number of maximum component values M belonging to each class is 8, the number of classes is 32.
図2は、生成されたヒストグラムHISTの一例を示す。図2で、横軸は、最大成分値M及び階級Cを表す。
最大成分値Mが取り得る値は0から255までであり、階級Cが取り得る値は0から32までである。
図2の縦軸は、各階級Cに属する最大成分値Mの出現度数F(C)、即ち最大成分値Mが当該階級Cに属する画素の数を表す。出現度数F(C)が取り得る値の範囲は、0から、フレーム内の画素の総数までである。
各階級の出現度数は、当該階級に属する最大成分値Mの範囲に等しい幅のバーで示されている。FIG. 2 shows an example of the generated histogram HIST. In FIG. 2, the horizontal axis represents the maximum component value M and class C.
The values that the maximum component value M can take are from 0 to 255, and the values that the class C can take are from 0 to 32.
The vertical axis in FIG. 2 represents the frequency of appearance F(C) of the maximum component value M belonging to each class C, that is, the number of pixels in which the maximum component value M belongs to the class C. The range of values that the frequency of appearance F(C) can take is from 0 to the total number of pixels in the frame.
The frequency of appearance of each class is indicated by a bar with a width equal to the range of the maximum component value M belonging to the class.
ヒストグラム生成部13は、最大成分値Mの代わりに、各画素の輝度の階級毎の出現度数を表すヒストグラムを生成するものであっても良い。この場合、各階級は、相連続する、予め定められた数の輝度の値で構成される。
Instead of the maximum component value M, the
ピーク輝度算出部14は、各フレームの入力画像Daのピーク輝度MAXLを算出する。各フレームの入力画像Daのピーク輝度MAXLは、当該フレームに属するすべての画素についての輝度のうちの最も大きいものである。
The peak
変換テーブル生成部15は、平均輝度算出部12で算出された平均輝度ALと、ヒストグラム生成部13で生成されたヒストグラムHISTと、ピーク輝度算出部14で算出されたピーク輝度MAXLとから変換テーブルTを生成する。変換テーブルTは、入力画像Daの階調値(入力階調値)Xと出力画像Dbの階調値(出力階調値)Yとの関係を規定するテーブルである。ここで、階調値X及びYはともに8ビット値であり、0から255までの値を取る場合を想定している。
The conversion
図3は、変換テーブル生成部15の構成例を示す図である。
図示の変換テーブル生成部15は、比較部17、第1変換テーブル生成部18、第2変換テーブル生成部19、無変換テーブル格納部20、及び変換テーブル合成部21を備える。FIG. 3 is a diagram showing an example of the configuration of the conversion
The illustrated conversion
比較部17は、平均輝度ALを予め定められた閾値ALthと比較し、比較結果RCを出力する。
第1変換テーブル生成部18は、入力階調値Xと第1出力階調値Yaとの関係を規定する第1変換テーブルTaを生成する。
第2変換テーブル生成部19は、入力階調値Xと第2出力階調値Ybとの関係を規定する第2変換テーブルTbを生成する。
無変換テーブル格納部20は、入力階調値Xと第3出力階調値Ycとの関係を規定する第3変換テーブルTcを格納している。
第1、第2、及び第3出力階調値Ya、Yb、及びYcも8ビット値であり、0から255までの値を取るものとする。The
The first conversion
The second conversion
The non-conversion
The first, second, and third output gradation values Ya, Yb, and Yc are also 8-bit values, and take values from 0 to 255.
変換テーブル合成部21は、比較結果RC、並びに第1、第2、及び第3変換テーブルTa、Tb、及びTcに基づいて、変換テーブルTを生成する。上記の通り、変換テーブルTは、入力階調値Xと出力階調値Yとの関係を規定するテーブルである。第1、第2、及び第3変換テーブルTa、Tb、及びTcとの区別のため変換テーブルTを合成変換テーブルと言うことがある。また、第1、第2及び第3出力階調値Ya、Yb、及びYcとの区別のため、階調値Yを合成出力階調値と言うことがある。
The conversion
第1変換テーブル生成部18は、平均輝度算出部12で算出された平均輝度ALと、ピーク輝度算出部14で算出されたピーク輝度MAXLとに基づいて第1変換テーブルTaを生成する。
The first conversion
第1変換テーブル生成部18は、例えば、図4に示されるようにパラメータ決定部23と、テーブル値算出部24とを有する。
パラメータ決定部23は、平均輝度ALに基づいてパラメータαの値を決定する。パラメータαは、1以上の値であり、平均輝度ALが大きいほど、大きい値となるように定められる。The first conversion
The
テーブル値算出部24は、パラメータαと、ピーク輝度MAXLとに基づいて、第1変換テーブルTaのテーブル値を算出する。ここでテーブル値とは、各入力階調値Xに対応付けられた第1出力階調値Yaを意味する。全ての入力階調値Xに対する第1出力階調値Yaが算出されることで、第1変換テーブルTaが生成される。
The table
図4に示される第1変換テーブル生成部18は、例えば、以下の第1の方法又は第2の方法で第1変換テーブルTaを生成する。
The first conversion
第1の方法では、パラメータ決定部23は、パラメータαを、例えば以下のように定める。即ち、AL=100のとき、α=1.2、AL=150のとき、α=2とする。またAL=0のとき、α=1とする。
In the first method, the
テーブル値算出部24は、下記の式(1)を用いてテーブル値を算出する。
The table

図5は第1の方法で生成される第1変換テーブルTaの一例を示すグラフである。横軸は入力階調値X、縦軸は第1出力階調値Yaを表す。
図5に示される第1変換テーブルTaは、ピーク輝度を維持しつつ、0よりも高くピーク輝度MAXLよりも低い範囲で階調値を下げるように変換を行なうものとなっている。「ピーク輝度を維持する」とは、入力階調値Xがピーク輝度MAXLに等しいときに第1出力階調値Yaもピーク輝度MAXLに等しくすることを意味する。「階調値を下げる」とは第1出力階調値Yaを入力階調値Xよりも小さくすることを意味する。FIG. 5 is a graph showing an example of the first conversion table Ta generated by the first method. The horizontal axis represents the input gradation value X, and the vertical axis represents the first output gradation value Ya.
The first conversion table Ta shown in FIG. 5 performs conversion to lower the gradation value in a range higher than 0 and lower than the peak brightness MAXL while maintaining the peak brightness. "Maintaining the peak luminance" means that when the input gradation value X is equal to the peak luminance MAXL, the first output gradation value Ya is also made equal to the peak luminance MAXL. "Lowering the gradation value" means making the first output gradation value Ya smaller than the input gradation value X.
図6(a)及び(b)は、ピーク輝度MAXLと第1の方法で生成される第1変換テーブルTaとの関係を説明するための図である。横軸は入力階調値X、縦軸は第1出力階調値Yaである。
図6(a)はピーク輝度MAXLが192のときの第1変換テーブルを表し、図6(b)はピーク輝度MAXLが128のときの第1変換テーブルを表す。いずれの場合にも、入力階調値Xがピーク輝度MAXLに等しいときは、第1出力階調値Yaがピーク輝度MAXLに等しい。FIGS. 6A and 6B are diagrams for explaining the relationship between the peak luminance MAXL and the first conversion table Ta generated by the first method. The horizontal axis is the input gradation value X, and the vertical axis is the first output gradation value Ya.
FIG. 6A shows the first conversion table when the peak brightness MAXL is 192, and FIG. 6B shows the first conversion table when the peak brightness MAXL is 128. In either case, when the input gradation value X is equal to the peak luminance MAXL, the first output gradation value Ya is equal to the peak luminance MAXL.
図7(a)及び(b)は、平均輝度ALと第1の方法で生成される第1変換テーブルTaとの関係を説明するための図である。横軸は入力階調値X、縦軸は第1出力階調値Yaである。図7(a)及び(b)のいずれの場合にもピーク輝度MAXLは192である。
図7(a)は平均輝度ALが150のときの第1変換テーブルを表し、図7(b)は平均輝度ALが100のときの第1変換テーブルを表す。FIGS. 7A and 7B are diagrams for explaining the relationship between the average luminance AL and the first conversion table Ta generated by the first method. The horizontal axis is the input gradation value X, and the vertical axis is the first output gradation value Ya. The peak luminance MAXL is 192 in both cases of FIGS. 7(a) and 7(b).
FIG. 7A shows the first conversion table when the average brightness AL is 150, and FIG. 7B shows the first conversion table when the average brightness AL is 100.
図7(a)に示される例では、平均輝度ALが150であり、αが2とされている。図7(b)に示される例では、平均輝度ALが100であり、αが1.2とされている。
このように、平均輝度ALに応じてαが変わり、ピーク輝度MAXLよりも低い範囲での入力階調値Xに対する第1出力階調値Yaの下げ幅が変わる。具体的には、平均輝度ALが大きいほど、αがより大きい値にされ、曲線の、下に凸となる度合いがより大きくされる。従って、平均輝度ALが大きいほど、ピーク輝度MAXLよりも低い範囲での階調値の下げ幅が大きい階調変換特性になっている。In the example shown in FIG. 7A, the average luminance AL is 150 and α is 2. In the example shown in FIG. 7(b), the average luminance AL is 100 and α is 1.2.
In this way, α changes depending on the average luminance AL, and the amount of decrease of the first output gradation value Ya with respect to the input gradation value X in a range lower than the peak luminance MAXL changes. Specifically, the greater the average luminance AL, the greater the value of α, and the greater the degree to which the curve is downwardly convex. Therefore, the higher the average luminance AL, the greater the gradation conversion characteristic in which the gradation value decreases in the range lower than the peak luminance MAXL.
以上のように第1の方法では、式(1)で表される第1変換テーブルTaを生成するが、第2の方法では、式(1)の代わりに後述の式(2)を用いる。また、これに伴い、パラメータαとしても異なる値のものを用いる。 As described above, in the first method, the first conversion table Ta expressed by equation (1) is generated, but in the second method, equation (2), which will be described later, is used instead of equation (1). Additionally, in accordance with this, different values are used for the parameter α.
即ち、第2の方法では、パラメータ決定部23は、パラメータαを、例えば以下のように定める。即ち、AL=100のとき、α=1.5、AL=150のとき、α=4とする。またAL=0のとき、α=1とする。
That is, in the second method, the
テーブル値算出部24は、下記の式(2)を用いてテーブル値を算出する。
The table

図8は第2の方法で生成される第1変換テーブルTaの一例を示すグラフである。横軸は入力階調値X、縦軸は第1出力階調値Yaを表す。
図8に示される第1変換テーブルTaも、ピーク輝度を維持しつつ、0よりも高くピーク輝度MAXLよりも低い範囲で階調値を下げるように変換を行なうものとなっている。FIG. 8 is a graph showing an example of the first conversion table Ta generated by the second method. The horizontal axis represents the input gradation value X, and the vertical axis represents the first output gradation value Ya.
The first conversion table Ta shown in FIG. 8 also performs conversion so that the gradation value is lowered in a range higher than 0 and lower than the peak brightness MAXL while maintaining the peak brightness.
図9(a)及び(b)は、ピーク輝度MAXLと第2の方法で生成される第1変換テーブルTaの階調変換特性との関係を説明するための図である。横軸は入力階調値X、縦軸は第1出力階調値Yaである。
図9(a)はピーク輝度MAXLが192のときの第1変換テーブルを表し、図9(b)はピーク輝度MAXLが128のときの第1変換テーブルを表す。いずれの場合にも、入力階調値Xがピーク輝度MAXLに等しいときは、第1出力階調値Yaがピーク輝度MAXLに等しい。FIGS. 9A and 9B are diagrams for explaining the relationship between the peak luminance MAXL and the gradation conversion characteristic of the first conversion table Ta generated by the second method. The horizontal axis is the input gradation value X, and the vertical axis is the first output gradation value Ya.
FIG. 9A shows the first conversion table when the peak brightness MAXL is 192, and FIG. 9B shows the first conversion table when the peak brightness MAXL is 128. In either case, when the input gradation value X is equal to the peak luminance MAXL, the first output gradation value Ya is equal to the peak luminance MAXL.
図10(a)及び(b)は、平均輝度ALと第2の方法で生成される第1変換テーブルTaとの関係を説明するための図である。横軸は入力階調値X、縦軸は第1出力階調値Yaである。図10(a)及び(b)のいずれの場合にもピーク輝度MAXLは192である。
図10(a)は平均輝度ALが150のときの第1変換テーブルを表し、図10(b)は平均輝度ALが100のときの第1変換テーブルを表す。FIGS. 10A and 10B are diagrams for explaining the relationship between the average luminance AL and the first conversion table Ta generated by the second method. The horizontal axis is the input gradation value X, and the vertical axis is the first output gradation value Ya. The peak luminance MAXL is 192 in both cases of FIGS. 10(a) and 10(b).
FIG. 10(a) shows the first conversion table when the average brightness AL is 150, and FIG. 10(b) shows the first conversion table when the average brightness AL is 100.
図10(a)に示される例では、平均輝度ALが150であり、αが3とされている。図10(b)に示される例では、平均輝度ALが100であり、αが1.5とされている。
このように、平均輝度ALに応じてαが変わり、ピーク輝度MAXLよりも低い範囲での入力階調値Xに対する第1出力階調値Yaの下げ幅が変わる。具体的には、平均輝度ALが大きいほど、αがより大きい値にされ、曲線(折れ線)の下方へのシフトがより大きくされる。従って、平均輝度ALが大きいほど、ピーク輝度MAXLよりも低い範囲での階調値の下げ幅が大きい階調変換特性になっている。In the example shown in FIG. 10(a), the average luminance AL is 150 and α is 3. In the example shown in FIG. 10(b), the average luminance AL is 100 and α is 1.5.
In this way, α changes depending on the average luminance AL, and the amount of decrease of the first output gradation value Ya with respect to the input gradation value X in a range lower than the peak luminance MAXL changes. Specifically, the larger the average luminance AL, the larger the value of α, and the larger the downward shift of the curve (broken line). Therefore, the higher the average luminance AL, the greater the gradation conversion characteristic in which the gradation value decreases in the range lower than the peak luminance MAXL.
以上、第1変換テーブル生成部18が第1変換テーブルTaを、第1の方法又は第2の方法で生成する場合について説明した。第1変換テーブル生成部18は、上記以外の方法で変換テーブルを生成するものであっても良い。いずれの場合も、0よりも高くピーク輝度MAXLよりも低い範囲で、第1出力階調値Yaが入力階調値Xよりも小さいものであるのが望ましい。
The case where the first conversion
また上記の例の第1変換テーブルTaは、0よりも高くピーク輝度MAXLよりも低い範囲の全体で、第1出力階調値Yaが入力階調値よりも小さい。しかしながら、第1変換テーブルTaは0よりも高くピーク輝度MAXLよりも低い範囲の少なくとも一部で、第1出力階調値Yaが入力階調値Xよりも小さいものであれば良い。 Furthermore, in the first conversion table Ta of the above example, the first output gradation value Ya is smaller than the input gradation value throughout the range higher than 0 and lower than the peak luminance MAXL. However, the first conversion table Ta only needs to have a first output gradation value Ya smaller than the input gradation value X in at least a part of the range higher than 0 and lower than the peak luminance MAXL.
また、上記の例の第1変換テーブルTaは、第1の方法及び第2の方法のいずれで生成される場合にも、平均輝度ALが大きいほど、ピーク輝度MAXLよりも低い範囲での、入力階調値Xに対する第1出力階調値Yaの下げ幅が大きい。 Furthermore, when the first conversion table Ta in the above example is generated by either the first method or the second method, the larger the average luminance AL, the more the input in the range lower than the peak luminance MAXL. The amount of decrease in the first output gradation value Ya with respect to the gradation value X is large.
第2変換テーブル生成部19は、ヒストグラム生成部13で生成されたヒストグラムHISTとピーク輝度算出部14で算出されたピーク輝度MAXLとに基づいて第2変換テーブルTbを生成する。
The second conversion
第2変換テーブル生成部19は、例えば、図2に例示されるヒストグラムHISTから、図11(a)に例示される正規化累積ヒストグラムNCHを生成し、正規化累積ヒストグラムNCHから、図11(b)に例示される第2変換テーブルTbを生成する。図11(b)で横軸は入力階調値X、縦軸は出力階調値Ybを表す。
For example, the second conversion
正規化累積ヒストグラムNCHは、ヒストグラムHISTから得られる累積ヒストグラムCHを正規化したものである。ここでの累積ヒストグラムCHの正規化は、その累積値(累積度数)FC(C)が、ピーク輝度MAXLが取り得る最小階調値(0)から最大階調値(255)までの範囲内の値を取るようにする処理である。 The normalized cumulative histogram NCH is a normalized cumulative histogram CH obtained from the histogram HIST. The normalization of the cumulative histogram CH here is such that its cumulative value (cumulative frequency) FC (C) is within the range from the minimum gradation value (0) to the maximum gradation value (255) that the peak luminance MAXL can take. This is a process that takes a value.
累積ヒストグラムCHは、ヒストグラムHISTの各階級Cにつき、最小の階級から当該階級Cまでの出現度数F(C)の累積値(累積度数)CF(C)を表すものである。
累積値の正規化値(正規化累積度数)NCF(C)は、累積値CF(C)を画面内の画素数(画面を構成する画素数)で除算し、ピーク輝度MAXLの値を乗算することで得られる値である。The cumulative histogram CH represents the cumulative value (cumulative frequency) CF(C) of the frequency of appearance F(C) from the smallest class to the class C for each class C of the histogram HIST.
The normalized value of the cumulative value (normalized cumulative frequency) NCF (C) is calculated by dividing the cumulative value CF (C) by the number of pixels in the screen (the number of pixels that make up the screen) and multiplying it by the value of peak brightness MAXL. This is the value obtained by
図11(a)の正規化累積ヒストグラムNCHは、階級毎の正規化累積度数NCF(C)を表す点を繋ぐ曲線で表されている。各階級Cの正規化累積度数NCF(C)を表す点は、横軸方向においては、当該階級Cの代表値、例えば中央値(横軸方向の中心)の位置に示される。そのような曲線と、横軸上の各最大成分値Mの位置を通る縦方向の直線との交点は、当該最大成分値Mに対応する正規化累積度数NCF(M)を表すと考えることができる。
なお、上記の「曲線」は、図11(a)に例示される折れ線であっても良く、連続性のある曲線であっても良い。The normalized cumulative histogram NCH in FIG. 11(a) is represented by a curve connecting points representing the normalized cumulative frequency NCF(C) for each class. The point representing the normalized cumulative frequency NCF(C) of each class C is shown at the position of the representative value of the class C, for example, the median (center in the horizontal axis direction) in the horizontal axis direction. The intersection of such a curve and a vertical straight line passing through the position of each maximum component value M on the horizontal axis can be considered to represent the normalized cumulative frequency NCF (M) corresponding to the maximum component value M. can.
Note that the above-mentioned "curve" may be a polygonal line illustrated in FIG. 11(a), or may be a continuous curve.
図11(b)に示される第2変換テーブルTbは、入力階調値Xがピーク輝度MAXL以下の範囲では(より厳密には、ピーク輝度MAXLが含まれる階級までの範囲では)、第2出力階調値Ybが図11(a)に示される正規化累積ヒストグラムNCHの値(正規化累積度数)NCF(M)に一致し、入力階調値Xがピーク輝度MAXLよりも大きい範囲では(ピーク輝度MAXLが含まれる階級よりも大きい範囲では)、第2出力階調値Ybが入力階調値Xに等しい階調変換特性を持つ。 The second conversion table Tb shown in FIG. 11(b) is such that in the range where the input gradation value In the range where the gradation value Yb matches the value (normalized cumulative frequency) NCF(M) of the normalized cumulative histogram NCH shown in FIG. 11(a) and the input gradation value In a range larger than the class including the luminance MAXL), the second output gradation value Yb has a gradation conversion characteristic equal to the input gradation value X.
第2出力階調値Ybが「正規化累積ヒストグラムNCHの値NCF(M)に一致する」とは、正規化累積ヒストグラムNCHのある最大成分値Mに等しい入力階調値Xに対する出力階調値Ybが、上記ある最大成分値Mに対する正規化累積ヒストグラムNCHの値NCF(M)に一致することを意味する。 The second output gradation value Yb "matches the value NCF(M) of the normalized cumulative histogram NCH" means the output gradation value for the input gradation value X equal to a certain maximum component value M of the normalized cumulative histogram NCH. This means that Yb matches the value NCF(M) of the normalized cumulative histogram NCH for the above-described maximum component value M.
以上、ヒストグラムHISTが最大成分値Mのヒストグラムである場合について述べた。ヒストグラムHISTが輝度のヒストグラムである場合にも第2変換テーブルTbを上記と同様に生成することができる。即ち、ヒストグラムHISTが輝度のヒストグラムである場合には、上記の説明中の「最大成分値」を「輝度」に置き換えれば良い。 The case where the histogram HIST is a histogram with the maximum component value M has been described above. Even when the histogram HIST is a luminance histogram, the second conversion table Tb can be generated in the same manner as above. That is, when the histogram HIST is a luminance histogram, the "maximum component value" in the above description may be replaced with "luminance".
図2に示されるヒストグラムHISTは最大成分値Mの分布関数を表し、図11(a)に示される正規化累積ヒストグラムNCHの値、即ち正規化累積度数NCF(M)は最大成分値Mの累積密度関数を表すとも言える。 The histogram HIST shown in FIG. 2 represents the distribution function of the maximum component value M, and the value of the normalized cumulative histogram NCH shown in FIG. It can also be said to represent a density function.
上記のようにして生成される第2変換テーブルTbは、ピーク輝度を維持しながら、出現度数の多い階調値範囲(入力画像において出現度数の多い階調値(最大成分値M、輝度など)が占める割合が多い階調値範囲)での、入力階調値Xの変化に対する第2出力階調値Ybの変化が比較的大きく(階調変換特性を表す曲線の傾きが比較的大きく)、出現度数の少ない階調値範囲(入力画像において出現度数の少ない階調値(最大成分値M、輝度など)が占める割合が多い階調値範囲)での、入力階調値Xの変化に対する第2出力階調値Ybの変化が比較的小さい(階調変換特性を表す曲線の傾きが比較的小さい)。従って、出現度数の多い階調値範囲での、コントラストを大きくし、出現度数の少ない階調値範囲での、コントラストを小さくすることができる。 The second conversion table Tb generated as described above is configured such that the gradation value range that appears frequently (gradation values that appear frequently in the input image (maximum component value M, luminance, etc.) while maintaining the peak luminance) The change in the second output gradation value Yb with respect to the change in the input gradation value X is relatively large (the slope of the curve representing the gradation conversion characteristic is relatively large) in the gradation value range in which The effect of changes in the input tone value The change in the 2-output gradation value Yb is relatively small (the slope of the curve representing the gradation conversion characteristic is relatively small). Therefore, it is possible to increase the contrast in the gradation value range where the frequency of occurrence is high, and to decrease the contrast in the gradation value range where the frequency of occurrence is low.
なお、上記の例では、第2変換テーブルTbは、入力階調値Xがピーク輝度MAXL以下のときは、第2出力階調値Ybが累積密度関数の値NCF(M)を取るが、本実施の形態はこれに限定されない。例えば、累積密度関数の傾きに対して上限及び下限を設けても良い。そうすることで、出現度数の多い階調値範囲のコントラストが大きくなりすぎたり、出現度数の少ない階調値範囲のコントラストが小さくなりすぎたりするのを避けることができる。
要するには、第2変換テーブル生成部19が生成する第2変換テーブルTbは、ピーク輝度を維持しながら、出現度数の多い階調値範囲のコントラストを上げ、出現度数の少ない階調値範囲のコントラストを下げるものであればよい。In the above example, in the second conversion table Tb, when the input tone value X is less than or equal to the peak luminance MAXL, the second output tone value Yb takes the cumulative density function value NCF(M), The embodiment is not limited to this. For example, upper and lower limits may be set for the slope of the cumulative density function. By doing so, it is possible to avoid the contrast from becoming too large in the gradation value range that appears frequently, or from becoming too small in the gradation value range where the gradation value appears less frequently.
In short, the second conversion table Tb generated by the second conversion
無変換テーブル格納部20が格納する第3変換テーブルTcは、第3出力階調値Ycが入力階調値Xに等しいテーブル、即ち無変換テーブルである。第3変換テーブルTcは例えば予め作成され、無変換テーブル格納部20に格納されている。
The third conversion table Tc stored in the non-conversion
変換テーブル合成部21は、比較結果RCと、第1変換テーブルTaと、第2変換テーブルTbと、第3変換テーブルTcとに基づいて、変換テーブルTを生成する。
The conversion
まず、比較結果RCにより平均輝度ALが閾値ALthよりも低いことが示される場合には、変換テーブル合成部21は、第3変換テーブルTcを選択し、変換テーブルTとして出力する。その結果、合成出力階調値Yが入力階調値Xに等しい変換テーブルが出力される。合成出力階調値Yが入力階調値Xに等しい変換テーブルとは、入力階調値Xがそのまま合成出力階調値Yとなる変換テーブル、即ち「実質的には階調変換を行わない」変換テーブルである。
このようにするのは、平均輝度ALが閾値ALthよりも低いときは、消費電力が少ないので、変換を行っても省電力の効果が限られているためである。First, when the comparison result RC indicates that the average luminance AL is lower than the threshold value ALth, the conversion
The reason for doing this is that when the average luminance AL is lower than the threshold value ALth, power consumption is low, so even if conversion is performed, the power saving effect is limited.
なお、入力画像の平均輝度ALが閾値ALth未満である場合には、第1変換テーブルTa及び第2変換テーブルTbを生成する必要がない。そこで、入力画像の平均輝度ALが閾値ALth未満であることを示す比較結果RCを比較部17から第1変換テーブル生成部18及び第2変換テーブル生成部19に供給して、第1変換テーブル生成部18及び第2変換テーブル生成部19における変換テーブルTa及びTbの生成を省略するように制御しても良い。
Note that if the average luminance AL of the input image is less than the threshold value ALth, there is no need to generate the first conversion table Ta and the second conversion table Tb. Therefore, the comparison result RC indicating that the average luminance AL of the input image is less than the threshold value ALth is supplied from the
比較結果RCにより、平均輝度ALが閾値ALth以上であることが示される場合には、変換テーブル合成部21は、第1変換テーブルTaと第2変換テーブルTbとを重畳して変換テーブルTを生成する。
If the comparison result RC indicates that the average luminance AL is greater than or equal to the threshold value ALth, the conversion
以下では、第1変換テーブルTaとして図5に示す階調変換特性を有するものが生成され、第2変換テーブルTbとして、図11(b)に示す階調変換特性を有するものが生成されるものとする。
図5と同じ階調変換特性を図12(a)に示し、図11(b)と同じ階調変換特性を図12(b)に示す。In the following, a first conversion table Ta having the gradation conversion characteristics shown in FIG. 5 is generated, and a second conversion table Tb having the gradation conversion characteristics shown in FIG. 11(b) is generated. shall be.
FIG. 12(a) shows the same gradation conversion characteristics as FIG. 5, and FIG. 12(b) shows the same gradation conversion characteristics as FIG. 11(b).
第1変換テーブルTaと第2変換テーブルTbとの重畳は、同じ入力階調値Xに対する第1出力階調値Ya(X)と第2出力階調値Yb(X)とを乗算し、これらの出力階調値が取り得る値の範囲内の最大値で除算すれば良い。この処理は下記の式(3)で表される。 The first conversion table Ta and the second conversion table Tb are superimposed by multiplying the first output gradation value Ya(X) and the second output gradation value Yb(X) for the same input gradation value X. It is sufficient to divide by the maximum value within the range of values that the output gradation value can take. This process is expressed by the following equation (3).

式(3)でYmaxは、Ya、Yb及びYが取り得る値の範囲内の最大値(255)である。 In equation (3), Ymax is the maximum value (255) within the range of values that Ya, Yb, and Y can take.
以上の処理は第1出力階調値Ya及び第2出力階調値Ybを0から1までの値を取るように正規化した上で乗算し、乗算結果を0から255までの値を取るように逆正規化するのと等価である。 The above process normalizes the first output gradation value Ya and the second output gradation value Yb to take a value from 0 to 1, and then multiplies them so that the multiplication result takes a value from 0 to 255. This is equivalent to denormalizing to .
図12(c)には、第1変換テーブルTaと第2変換テーブルTbとを重畳することで得られる変換テーブルTの一例が示されている。 FIG. 12C shows an example of a conversion table T obtained by superimposing the first conversion table Ta and the second conversion table Tb.
画像変換部16は、変換テーブル生成部15で生成された変換テーブルTを用いて、入力画像Daに対して階調変換を行い、出力画像Dbを生成する。
The
変換テーブル生成部15における変換テーブルTの生成はフレーム毎に行われ、各フレームについて生成された変換テーブルTは、当該フレームの入力画像Daの階調変換に用いられる。
画像変換部16は各フレームの入力画像Daについて生成された変換テーブルTを、当該フレームの入力画像Daの全ての画素についての階調変換が終わるまで保持し、各画素の階調変換に用いる。The conversion table T is generated by the conversion
The
入力画像Daを表す画像データがR成分値、G成分値及びB成分値を有するものである場合、R成分値、G成分値及びB成分値をそれぞれ別個に階調変換しても良く、一旦輝度成分値と、色差成分値とに変換し、輝度成分値を階調変換し、その後R成分値、G成分値及びB成分値に逆変換しても良い。 If the image data representing the input image Da has an R component value, a G component value, and a B component value, the R component value, the G component value, and the B component value may be gradation-converted separately. The luminance component value may be converted into a luminance component value and a chrominance component value, the luminance component value may be gradation-converted, and then inversely converted into an R component value, a G component value, and a B component value.
画像表示部3は、画像変換部16から出力される出力画像Dbに基づいて画像表示を行なう。
The
上記のように、画像変換部16における階調変換には、平均輝度ALが閾値ALth以上である場合、例えば図12(c)に例示される変換テーブルTが用いられる。
第1変換テーブルTaと第2変換テーブルTbとを重畳することで得られる変換テーブルTは、第1変換テーブルTaの特徴を引き継ぐとともに、第2変換テーブルTbの特徴を引き継いだものとなる。As described above, when the average luminance AL is equal to or greater than the threshold value ALth, the conversion table T illustrated in FIG. 12C is used for the gradation conversion in the
The conversion table T obtained by superimposing the first conversion table Ta and the second conversion table Tb inherits the characteristics of the first conversion table Ta and also inherits the characteristics of the second conversion table Tb.
従って、図12(c)の例で示されるように、変換テーブルTは、変換テーブルTaの特徴を引き継いで、入力階調値Xがピーク輝度MAXLに等しいときは、合成出力階調値Yをピーク輝度MAXLに等しくし、0よりも高くピーク輝度MAXLよりも低い範囲では合成出力階調値Yを入力階調値Xよりも小さくする傾向を有する。その結果、ピーク輝度を維持しつつ、省電力を図ることができる。 Therefore, as shown in the example of FIG. 12(c), the conversion table T inherits the characteristics of the conversion table Ta, and when the input tone value X is equal to the peak luminance MAXL, the combined output tone value Y is The combined output gradation value Y tends to be equal to the peak luminance MAXL, and the composite output gradation value Y is smaller than the input gradation value X in the range higher than 0 and lower than the peak luminance MAXL. As a result, it is possible to save power while maintaining peak brightness.
また、変換テーブルTは、第1変換テーブルTaの特徴を引き継いで、平均輝度ALが大きいほど、ピーク輝度MAXLよりも低い範囲での入力階調値Xに対する合成出力階調値Yの下げ幅が大きくなる傾向を有する。
その結果、視認性を損なうことなく、消費電力の一層の低減を図ることができる。In addition, the conversion table T inherits the characteristics of the first conversion table Ta, and the greater the average luminance AL, the lower the amount of decrease in the composite output gradation value Y with respect to the input gradation value X in the range lower than the peak luminance MAXL. It has a tendency to become larger.
As a result, it is possible to further reduce power consumption without impairing visibility.
また、変換テーブルTは、第2変換テーブルTbの特徴を引き継いで、出現度数の多い階調値範囲で、入力階調値Xの変化に対する合成出力階調値Yの変化が比較的大きくなり、出現度数の少ない階調値範囲で、入力階調値Xの変化に対する合成出力階調値Yの変化が比較的小さくなる傾向を有する。
その結果、コントラストの良好な画像が得られる。Furthermore, in the conversion table T, inheriting the characteristics of the second conversion table Tb, the change in the synthesized output gradation value Y with respect to the change in the input gradation value X is relatively large in the gradation value range that appears frequently, In a gradation value range in which the number of occurrences is small, the change in the synthesized output gradation value Y with respect to the change in the input gradation value X tends to be relatively small.
As a result, an image with good contrast can be obtained.
なお、変換テーブルTは上記の条件を全て充たすものでなくても良い。
例えば、図12(c)に示される変換テーブルTは、入力階調値Xが0よりも高くピーク輝度MAXLよりも低い範囲の全部に亘り、合成出力階調値Yが入力階調値Xよりも小さい。しかし、変換テーブルTは、例えば、図13に示されるように、入力階調値Xが0よりも高くピーク輝度MAXLよりも低い範囲のうちの一部でのみ、合成出力階調値Yが入力階調値Xよりも小さい階調変換特性を持つものであっても良い。
要するに、入力階調値Xが0よりも高くピーク輝度MAXLよりも低い範囲のうちの少なくとも一部で、合成出力階調値Yが入力階調値Xよりも小さい階調変換特性を持つ変換テーブルであれば良い。Note that the conversion table T does not have to satisfy all of the above conditions.
For example, the conversion table T shown in FIG. 12(c) covers the entire range where the input gradation value It's also small. However, in the conversion table T, for example, as shown in FIG. It may have a gradation conversion characteristic smaller than the gradation value X.
In short, the conversion table has tone conversion characteristics in which the synthesized output tone value Y is smaller than the input tone value X in at least part of the range where the input tone value X is higher than 0 and lower than the peak luminance MAXL. That's fine.
また、上記の例では、入力画像の平均輝度ALが閾値ALth未満である場合には、無変換テーブル格納部20に格納されている第3変換テーブルTcが選択されるが、この点も必須ではない。即ち、平均輝度ALが閾値ALth未満である場合にも、第1変換テーブルTaと第2変換テーブルTbとの重畳で得られた変換テーブルTを画像変換に用いても良い。
Furthermore, in the above example, when the average luminance AL of the input image is less than the threshold value ALth, the third conversion table Tc stored in the non-conversion
画像処理装置2は、その一部又は全部を処理回路で構成し得る。
例えば、画像処理装置の各部分の機能をそれぞれ別個の処理回路で実現してもよいし、複数の部分の機能をまとめて1つの処理回路で実現しても良い。
処理回路はハードウェアで構成されていても良くソフトウェアで、即ちプログラムされたコンピュータで構成されていても良い。
画像処理装置の各部分の機能のうち、一部をハードウェアで実現し、他の一部をソフトウェアで実現するようにしても良い。The
For example, the functions of each part of the image processing device may be realized by separate processing circuits, or the functions of a plurality of parts may be realized by a single processing circuit.
The processing circuit may be constructed of hardware or software, ie, a programmed computer.
Among the functions of each part of the image processing device, some may be realized by hardware, and the other part may be realized by software.
図14は、画像処理装置2の全ての機能を実現するコンピュータ9を、画像表示部3とともに示す。
FIG. 14 shows a
図示の例ではコンピュータ9は、プロセッサ91及びメモリ92を有する。
メモリ92には、画像処理装置2の各部の機能を実現するためのプログラムが記憶されている。In the illustrated example, the
The
プロセッサ91は、例えば、CPU(Central Processing Unit)、GPU(Graphics Processing Unit)、マイクロプロセッサ、マイクロコントローラ又はDSP(Digital Signal Processor)等を用いたものである。
メモリ92は、例えばRAM(Random Access Memory)、ROM(Read Only Memory)、フラッシュメモリ、EPROM(Erasable Programmable Read Only Memory)若しくはEEPROM(Electrically Erasable Programmable Read Only Memory)等の半導体メモリ、磁気ディスク、光ディスク、又は光磁気ディスク等を用いたものである。The
The
プロセッサ91及びメモリ92は、互いに一体化されたLSI(Large Scale Integration)で実現されていても良い。
The
プロセッサ91は、メモリ92に記憶されているプログラムを実行することにより、画像処理装置の機能を実現する。
画像処理装置の機能には、上記のように画像表示部3における表示の制御が含まれる。
プログラムは、ネットワークを通じて提供されてもよく、また、記録媒体、例えば非一時的な記録媒体に記録されて提供されてもよい。即ち、プログラムは、例えば、プログラムプロダクトとして提供されてもよい。The
The functions of the image processing device include controlling the display on the
The program may be provided through a network, or may be provided recorded on a recording medium, for example, a non-transitory recording medium. That is, the program may be provided as a program product, for example.
図14のコンピュータは単一のプロセッサを含むが、2以上のプロセッサを含んでいても良い。 Although the computer in FIG. 14 includes a single processor, it may include two or more processors.
図14で示されるコンピュータで、実施の形態1の画像処理装置2が構成されている場合のプロセッサ91による処理の手順を、図15を参照して説明する。
The procedure of processing by the
図15に示される処理は、1フレームの画像が入力される毎に繰り返される。 The process shown in FIG. 15 is repeated every time one frame of image is input.
図15において、ステップST11では、入力画像Daの入力処理が行われる。この処理は、図1の画像入力部11による処理と同様である。
In FIG. 15, in step ST11, input processing of the input image Da is performed. This process is similar to the process performed by the
ステップST12では、平均輝度ALを算出する。この処理は、図1の平均輝度算出部12の処理と同等である。
ステップST13では、ヒストグラムHISTを生成する。この処理は、図1のヒストグラム生成部13の処理と同等である。
ステップST14では、ピーク輝度MAXLを算出する。この処理は、図1のピーク輝度算出部14の処理と同等である。
ステップST12~ST14の処理は並行して行い得る。In step ST12, average luminance AL is calculated. This process is equivalent to the process of the average
In step ST13, a histogram HIST is generated. This process is equivalent to the process of the
In step ST14, peak luminance MAXL is calculated. This process is equivalent to the process of the peak
The processing of steps ST12 to ST14 can be performed in parallel.
ステップST15では、変換テーブルを生成する。この処理は、図1の変換テーブル生成部15の処理と同等である。
ステップST16では、画像変換を行なう。この処理は、図1の画像変換部16の処理と同等である。In step ST15, a conversion table is generated. This process is equivalent to the process of the conversion
In step ST16, image conversion is performed. This process is equivalent to the process of the
以上のように、本実施の形態1では、入力階調値がピーク輝度に等しいときは出力階調値もピーク輝度に等しく、入力階調値が0よりも高くピーク輝度よりも低い範囲の少なくとも一部では、出力階調値が入力階調値よりも小さい変換テーブルを用いることで、視認性を維持しつつ消費電力の低減を図ることができる。 As described above, in the first embodiment, when the input gradation value is equal to the peak luminance, the output gradation value is also equal to the peak luminance, and the output gradation value is equal to the peak luminance. In some cases, by using a conversion table in which the output gradation value is smaller than the input gradation value, it is possible to reduce power consumption while maintaining visibility.
また、入力画像の平均輝度ALが高いほど、入力階調値に対する出力階調値の下げ幅が大きい変換テーブルを用いることとすれば、消費電力が大きい場合ほど、消費電力の低減幅を大きくすることができる。 Furthermore, if a conversion table is used in which the higher the average luminance AL of the input image is, the larger the reduction range of the output gradation value with respect to the input gradation value is, the larger the power consumption is, the larger the reduction range of power consumption is. be able to.
さらに、入力画像の平均輝度ALが閾値ALthよりも低い場合、出力階調値が入力階調値に等しい変換テーブルを用いることとすれば、画像変換部16による画像変換を行わなくても消費電力が少ない場合は、画像が全体として暗いものである場合にも、視認性を維持できる。 Furthermore, if the average luminance AL of the input image is lower than the threshold value ALth, if a conversion table is used in which the output gradation value is equal to the input gradation value, the power consumption When the number of images is small, visibility can be maintained even if the image is dark as a whole.
さらにまた、出現度数の多い階調値範囲で、入力階調値Xの変化に対する合成出力階調値Yの変化が比較的を大きく、出現度数の少ない階調値範囲で、入力階調値Xの変化に対する合成出力階調値Yの変化が比較的小さい変換テーブルを用いることとすれば、出現度数の多い階調値範囲ほどコントラストがあがり、画像全体として高い階調性を維持できる。 Furthermore, in the gradation value range where the number of occurrences is high, the change in the synthesized output gradation value Y with respect to the change in the input gradation value If a conversion table is used in which the change in the synthesized output gradation value Y with respect to a change in is relatively small, the contrast increases as the gradation value range appears more frequently, and high gradation can be maintained as a whole image.
実施の形態2.
図16は、実施の形態2に係る画像表示装置1bの構成を示す図である。図16にはさらに、学習システム100が示されている。
図16に示される画像表示装置1bは、図1の画像表示装置1と概して同じであるが、図1の画像処理装置2の代わりに画像処理装置2bが設けられている。画像処理装置2bは画像処理装置2と概して同じであるが、変換テーブル生成部15の代わりに、変換テーブル生成部31が設けられている。
FIG. 16 is a diagram showing the configuration of an
The
変換テーブル生成部31は、入力画像Daの平均輝度AL、ヒストグラムHIST、及びピーク輝度MAXLに基づいて変換テーブルTを生成する。変換テーブル生成部31は、例えば図17に例示される、学習済み多層ニューラルネットワーク32で構成されている。
The conversion
多層ニューラルネットワーク32は、平均輝度AL、ヒストグラムHIST、及びピーク輝度MAXLの組み合わせと、変換テーブルTとを対応付ける学習済みニューラルネットワークであり、好ましい変換テーブルTを生成するように機械学習した結果生成されたものである。
「好ましい変換テーブルT」は、予め定められた条件を充たし、該変換テーブルを用いた場合の表示画像の視認性が良好であり、かつその場合の消費電力が少なくなるように学習した結果生成された変換テーブルである。The multilayer
The "preferred conversion table T" is generated as a result of learning so that predetermined conditions are met, the visibility of the displayed image is good when the conversion table is used, and the power consumption is low in that case. This is a conversion table.
上記の「予め定められた条件」は、例えば下記の条件(a)~(d)を含む。
(a) 入力階調値Xがピーク輝度MAXLに等しいときは出力階調値Yもピーク輝度MAXLに等しく、入力階調値Xが0よりも高くピーク輝度MAXLよりも低い範囲では、出力階調値Yが入力階調値Xよりも小さい。
(b) 入力画像の平均輝度ALが高いほど、ピーク輝度MAXLよりも低い範囲での入力階調値Xに対する出力階調値Yの下げ幅が大きい。
(c) 入力画像の平均輝度ALが閾値ALthより低いときは、入力階調値Xがそのまま出力階調値Yとなる。
(d) 入力画像において出現度数の多い階調値範囲で、入力階調値Xの変化に対する出力階調値Yの変化が比較的大きく、入力画像において出現度数の少ない階調値範囲で、入力階調値Xの変化に対する出力階調値Yの変化が比較的小さい。The above-mentioned "predetermined conditions" include, for example, the following conditions (a) to (d).
(a) When the input gradation value X is equal to the peak luminance MAXL, the output gradation value Y is also equal to the peak luminance MAXL, and in the range where the input gradation value The value Y is smaller than the input gradation value X.
(b) The higher the average luminance AL of the input image, the greater the decrease in the output gradation value Y with respect to the input gradation value X in a range lower than the peak luminance MAXL.
(c) When the average luminance AL of the input image is lower than the threshold value ALth, the input gradation value X becomes the output gradation value Y as is.
(d) In the gradation value range that appears frequently in the input image, the change in the output gradation value Y with respect to the change in the input gradation value X is relatively large, and in the gradation value range that appears less frequently in the input image, The change in the output gradation value Y with respect to the change in the gradation value X is relatively small.
表示画像の視認性は、複数の被験者の主観評価による。
画像表示部3における消費電力は、計算又は測定によって得られる。The visibility of the displayed image is based on subjective evaluations by multiple subjects.
The power consumption in the
以上を要するに、変換テーブルTが好ましいか否かは、該変換テーブルTが上記の条件(a)~(d)を充たすか否か、並びに当該変換テーブルTを用いた画像変換により生成された出力画像Dbを表示することで得られる表示画像に対する主観評価の結果及び当該表示画像を表示する際の画像表示部3における消費電力に基づいて判定される。
多層ニューラルネットワーク32は、該ニューラルネットワーク32で生成される変換テーブルTと、上記の条件(a)~(d)、表示画像の視認性及び消費電力との関係を学習した結果により生成されたものである。In summary, whether or not the conversion table T is preferable depends on whether or not the conversion table T satisfies the above conditions (a) to (d), and the output generated by image conversion using the conversion table T. The determination is made based on the result of subjective evaluation of the display image obtained by displaying the image Db and the power consumption in the
The multilayer
図17に示されるニューラルネットワーク32は、入力層33と、中間層(隠れ層)34と、出力層35とを有する。図示の例では、中間層34の数が3であるが、中間層34の数は2以下であっても良く4以上であっても良い。
The
入力層33のニューロンPの各々には、入力画像の平均輝度AL、ヒストグラムHIST、及びピーク輝度MAXLのいずれかが割り当てられ、各ニューロンには、割り当てられた値が入力される。
入力層33のニューロンは入力をそのまま出力する。Each of the neurons P in the
The neurons in the
出力層35のニューロンPは変換テーブルTを定義するデータを出力する。変換テーブルTを定義するデータには各入力階調値Xに対する出力階調値Yが含まれる。
Neurons P in the
中間層34及び出力層35のニューロンPは、各々複数の入力に対して下記のモデル式で表される演算を行う。
The neurons P in the

式(4)で、
Nは、ニューロンPへの入力の数であり、ニューロン相互間で同じとは限らない。
x1~xNはニューロンPの入力データ、
w1~wNは入力x1~xNに対する重み、
bはバイアスである。
重み及びバイアスは、学習により定められている。
以下では、重み及びバイアスを纏めてパラメータ(ニューラルネットワークのパラメータ)と言う。In formula (4),
N is the number of inputs to the neuron P, and is not necessarily the same between neurons.
x 1 to x N are input data of neuron P,
w 1 to w N are weights for inputs x 1 to x N ,
b is the bias.
The weights and biases are determined by learning.
Hereinafter, the weights and biases will be collectively referred to as parameters (neural network parameters).
関数s(a)は、活性化関数である。
活性化関数は、例えば、aが0以下であれば0を出力し、それ以外であれば1を出力するステップ関数であっても良い。
活性化関数s(a)は、aが0以下であれば0を出力し、それ以外なら入力値aを出力するReLU関数であっても良く、入力値aをそのまま出力値とする恒等関数でもよく、ジグモイド関数であっても良い。Function s(a) is an activation function.
The activation function may be, for example, a step function that outputs 0 if a is less than or equal to 0, and
The activation function s(a) may be a ReLU function that outputs 0 if a is less than or equal to 0, and otherwise outputs the input value a, or an identity function that outputs the input value a as it is. However, it may also be a sigmoid function.
上記のように、入力層33のニューロンは入力をそのまま出力するものであるので、入力層33のニューロンで用いられる活性化関数は恒等関数であると言える。
As described above, since the neurons in the
例えば、中間層34では、ステップ関数又はジグモイド関数を用い、出力層ではReLU関数を用いても良い。また、同じ層内のニューロン相互間で異なる活性化関数が用いられていても良い。
ニューロンPの数、層の数(段階数)は、図17に示される例に限定されない。For example, the
The number of neurons P and the number of layers (number of stages) are not limited to the example shown in FIG. 17.
実施の形態1と同様、実施の形態2の画像処理装置2bもその一部又は全部を処理回路で構成し得る。
例えば、画像処理装置の各部分の機能をそれぞれ別個の処理回路で実現してもよいし、複数の部分の機能をまとめて1つの処理回路で実現しても良い。
処理回路はハードウェアで構成されていても良くソフトウェアで、即ちプログラムされたコンピュータで構成されていても良い。
画像処理装置の各部分の機能のうち、一部をハードウェアで実現し、他の一部をソフトウェアで実現するようにしても良い。Similar to the first embodiment, the
For example, the functions of each part of the image processing device may be realized by separate processing circuits, or the functions of a plurality of parts may be realized by a single processing circuit.
The processing circuit may be constructed of hardware or software, ie, a programmed computer.
Among the functions of each part of the image processing device, some may be realized by hardware, and the other part may be realized by software.
例えば、画像処理装置2bが、図14のコンピュータで構成されていても良い。
画像処理装置2bが図14のコンピュータで構成されている場合の、プロセッサ91による処理の手順を図18を参照して説明する。For example, the
The procedure of processing by the
図18は、図15と概して同じであるが、ステップST15の代わりにステップST21が含まれている。
ステップST21では、変換テーブルTを生成する。この処理は、図16の変換テーブル生成部31の処理と同等である。FIG. 18 is generally the same as FIG. 15, but includes step ST21 instead of step ST15.
In step ST21, a conversion table T is generated. This process is equivalent to the process of the conversion
上記のように、変換テーブル生成部31を構成する多層ニューラルネットワーク32は、機械学習により生成される。上記のように、図16には、機械学習のための学習システム100が示されている。学習システム100は、機械学習の際に画像処理装置2bに接続されて使用される。
学習システム100は、学習装置101と、入力インタフェース102と、電力計算部103とを含む。As described above, the multilayer
入力インタフェース102は、主観評価の結果を入力するために用いられる。
主観評価は複数の画像について複数の被験者5により行われる。
用いられる画像の数及び被験者5の数は、学習を適切に行うために充分な数である必要がある。
被験者5は、画像処理装置2bのユーザ又は該ユーザと同等の嗜好、感性を持つと推定される人であるのが望ましい。被験者5の数は、できるだけ多い方が良いが、コスト、データ処理量、所要時間等との兼ね合いで決められる。The
Subjective evaluation is performed by a plurality of subjects 5 on a plurality of images.
The number of images and the number of subjects 5 used need to be sufficient for proper learning.
The subject 5 is preferably a user of the
学習装置101は複数の画像Dcを順次選択して、画像入力部11に供給する。
複数の画像は、学習装置101の内部に保存されている画像であっても良く、外部から供給される画像であっても良い。The
The plurality of images may be images stored inside the
複数の画像は、画像の内容が互いに異なる。
ここでいう画像の内容には、画像を構成する要素、その配置、画面内での明るさ、色の分布等が含まれる。異なる画像相互間では上記のうち項目のうちのいずれか一つ以上が異なる。The plurality of images have different image contents.
The content of the image here includes elements constituting the image, their arrangement, brightness within the screen, color distribution, and the like. One or more of the above items differ between different images.
画像処理装置2bは、入力された画像Dcに対して通常の画像処理動作の場合と同様に処理を行ない、画像表示部3に画像を表示させる。
即ち、平均輝度算出部12は、平均輝度ALの算出を行ない、ヒストグラム生成部13は、ヒストグラムHISTの生成を行ない、ピーク輝度算出部14は、ピーク輝度MAXLの算出を行なう。
変換テーブル生成部31は、平均輝度ALと、ヒストグラムHISTと、ピーク輝度MAXLとに基づいて変換テーブルTを生成する。The
That is, the average
The conversion
画像変換部16は、画像入力部11に入力されている画像(学習用の画像)Dcに対して、変換テーブル生成部31で生成された変換テーブルTを用いて、画像変換を行い、変換により得られた出力画像Dbを画像表示部3に表示させる。
被験者5の各々は、表示画像についての評価の結果を入力インタフェース102を用いて入力する。The
Each of the subjects 5 inputs the evaluation results for the displayed images using the
各被験者の各画像についての評価は、「満足できるか否か」を表すものであっても良く、「満足度」を表す数値であっても良い。
複数の学習用画像についての、複数の被験者による主観評価値は、各画像についての、各被験者による評価結果を、総合することで求められる。
各画像についての主観評価が、満足できるか否かという評価である場合には、満足できるとの評価が占める割合を、複数の画像についての主観評価値として求めても良い。
各画像についての主観評価が満足度である場合、該満足度の複数の画像に亘る合計又は平均を、複数の画像についての主観評価値として求めても良い。The evaluation of each image by each subject may be an expression indicating whether the image is "satisfactory" or may be a numerical value indicating "satisfaction level."
The subjective evaluation values of the plurality of learning images by the plurality of subjects are obtained by integrating the evaluation results of the respective subjects for each image.
When the subjective evaluation of each image is an evaluation of whether it is satisfactory or not, the proportion of evaluations of satisfaction may be determined as the subjective evaluation value of the plurality of images.
When the subjective evaluation for each image is a degree of satisfaction, the sum or average of the degree of satisfaction over a plurality of images may be determined as the subjective evaluation value for the plurality of images.
電力計算部103は、変換テーブル生成部31で生成された変換テーブルTを用いて変換された画像Dbを表示する場合の画像表示部3での消費電力を計算する。電力計算部103は例えば、画像変換部16から出力される変換後の画像Dbに基づいて、画像表示部3による消費電力を計算する。
The
学習装置101は、平均輝度算出部12で算出された平均輝度AL、ヒストグラム生成部13で生成されたヒストグラムHIST、ピーク輝度算出部14で算出されたピーク輝度MAXL、変換テーブル生成部31で生成された変換テーブルTをも入力とし、これらに基づいて、変換テーブルTが上記の条件(a)~(d)を充たすか否かの判定を行なう。上記の条件(a)、(c)、及び(d)が充たされるか否かの判定は画像毎に行われる。上記条件(b)が充たされるか否かの判定は、全ての画像について変換テーブルTが生成された後に行われる。
学習装置101はまた、入力インタフェース102により入力される主観評価の結果及び電力計算部103で計算される消費電力に基づいて総合評価を行なう。The
The
例えば、学習装置101は、複数の被験者の、複数の画像についての主観評価の結果に基づいて主観評価値を算出する。
学習装置101はまた、電力計算部103で計算された消費電力から省電力評価値を算出する。
消費電力も複数の画像の各々について計算される。
複数の画像についての省電力評価値は、各画像についての消費電力の、上記複数の画像に亘る合計又は平均から求められる。
省電力評価値は、消費電力が小さいほど、より大きい値となる。For example, the
The
Power consumption is also calculated for each of the plurality of images.
The power saving evaluation value for the plurality of images is obtained from the sum or average of the power consumption for each image over the plurality of images.
The lower the power consumption, the larger the power saving evaluation value becomes.
学習装置101は、さらに主観評価値と省電力評価値とから総合評価値を算出する。例えば主観評価値と省電力評価値とを重み付け加算することで総合評価値を算出する。
The
学習装置101は、上記の条件(a)~(d)が充たされる否かの判定結果、及び算出した総合評価値に基づいて、必要に応じてパラメータの組(ニューラルネットワークのパラメータの組)PSを調整する。
学習装置101は、例えば、上記の条件(a)~(d)が充たされていない場合には、パラメータの組PSを変更する。変更は、上記の条件(a)~(d)が充たされる状態となるように行う。
学習装置101はまた、総合評価値EVが予め定められた閾値EVth以上か否かを判定し、閾値EVth以上でなければパラメータの組PSを変更する。変更は、総合評価値EVがより大きくなるように行う。
変更に当たっては勾配降下法を用い得る。
学習装置101は、上記のようにパラメータの組PSが変更された多層ニューラルネットワーク32を用いて、再度上記の一連の処理を行なう。The
The
The
A gradient descent method can be used for the change.
The
変換テーブルが上記の条件(a)~(d)を充たし、かつ、算出した総合評価値EVが閾値EVth以上であれば、変換テーブルの生成に用いられたパラメータの組を、最適なパラメータとして採用する。その後の入力画像Daに対する画像処理で、そのような最適なパラメータで構成されるニューラルネットワーク32が、変換テーブル生成部31を構成するものとして用いられる。
If the conversion table satisfies the above conditions (a) to (d) and the calculated overall evaluation value EV is equal to or greater than the threshold EVth, the set of parameters used to generate the conversion table is adopted as the optimal parameter. do. In subsequent image processing of the input image Da, the
以上のように、学習の結果、変換テーブルTを生成するニューラルネットワーク32のパラメータの組PSが決定され、これにより、ニューラルネットワーク32が形成される。
As described above, as a result of the learning, the parameter set PS of the
上記の条件(a)が充たされているかどうかの判定は、変換テーブル生成部31で生成された変換テーブルT及びピーク輝度算出部14で算出されたピーク輝度MAXLとに基づいて画像毎に行われる。
The determination of whether the above condition (a) is satisfied is made for each image based on the conversion table T generated by the conversion
上記の条件(b)が充たされているかどうかの判定は、変換テーブル生成部31で生成された変換テーブルT及び平均輝度算出部12で算出された平均輝度ALとの関係を全ての画像について比較することで、行われる。
To determine whether the above condition (b) is satisfied, the relationship between the conversion table T generated by the conversion
上記の条件(c)が充たされているか否かの判定は、変換テーブル生成部31で生成された変換テーブルT及び平均輝度算出部12で算出された平均輝度ALに基づいて画像毎に行われる。
The determination of whether the above condition (c) is satisfied is made for each image based on the conversion table T generated by the conversion
上記の条件(d)が充たされているかどうかの判定は、変換テーブル生成部31で生成された変換テーブルT及びヒストグラム生成部13で生成されたヒストグラムHISTに基づいて画像毎に行われる。
A determination as to whether the above condition (d) is satisfied is made for each image based on the conversion table T generated by the conversion
学習装置101は、コンピュータで構成されていても良い。画像処理装置2がコンピュータで構成される場合、同じコンピュータが学習装置101を構成していても良い。学習装置101を構成するコンピュータは、例えば図14に示されるものであっても良い。その場合、学習装置101の機能はプロセッサ91がメモリ92に記憶されているプログラムを実行することで実現されるものであっても良い。
The
学習装置101によるニューラルネットワークの生成においては、まず元となるニューラルネットワークを用意する。即ち、変換テーブル生成部31を、元となるニューラルネットワークで仮に構築する。このニューラルネットワークは、図17に示されるニューラルネットワークと同様のものである。
In generating a neural network by the
ニューラルネットワークの生成においては、複数のニューロンの各々についてパラメータ(重み及びバイアス)の値を定める必要がある。複数のニューロンについてのパラメータの集合をパラメータの組と言い、符号PSで表す。 In generating a neural network, it is necessary to determine values of parameters (weights and biases) for each of a plurality of neurons. A set of parameters for a plurality of neurons is called a parameter set, and is denoted by the symbol PS.
ニューラルネットワークの生成においては、上記の元となるニューラルネットワークを用いて生成された変換テーブルが上記の条件(a)~(d)を充たし、かつ上記の総合評価値EVが閾値EVth以上となるように、パラメータの組PSの最適化を行う。最適化は例えば誤差逆伝搬法により行い得る。 In generating the neural network, the conversion table generated using the above-mentioned source neural network satisfies the above-mentioned conditions (a) to (d), and the above-mentioned comprehensive evaluation value EV is set to be equal to or greater than the threshold value EVth. Next, the parameter set PS is optimized. Optimization can be performed, for example, by error backpropagation.
具体的には、学習装置101は、画像を複数個用意し、パラメータの組PSの初期値を設定し、上記の画像を順に選択し、選択されている画像が入力されたときの、平均輝度AL、ヒストグラムHIST、ピーク輝度MAXL、及び変換テーブルTを取得し、複数の被験者による主観評価の結果及び消費電力の算出値を取得する。
学習装置101は、取得した平均輝度AL、ヒストグラムHIST、ピーク輝度MAXL、及び変換テーブルTに基づいて上記の条件(a)~(d)が充たされているか否かを判定する。
学習装置101はまた、取得した主観評価の結果及び消費電力の算出値に基づいて、総合評価値EVを算出する。Specifically, the
The
The
上記条件(a)~(d)が充たされていない場合、及び算出された総合評価値EVが閾値EVthよりも小さければ、条件(a)~(d)が充たされるように、あるいは総合評価値EVがより大きくなるように、パラメータの組PSを変更する。
以上の処理を、条件(a)~(d)が充たされ、かつ総合評価値EVが閾値EVth以上となるまで繰り返す。
パラメータの組PSの変更は、勾配降下法で行い得る。If the above conditions (a) to (d) are not satisfied, and if the calculated overall evaluation value EV is smaller than the threshold EVth, then the conditions (a) to (d) are satisfied or the overall evaluation The parameter set PS is changed so that the value EV becomes larger.
The above process is repeated until conditions (a) to (d) are satisfied and the comprehensive evaluation value EV becomes equal to or greater than the threshold value EVth.
Changing the parameter set PS may be performed by gradient descent.
学習が終了したら、入力インタフェース102は、取り外され、画像表示装置は、入力インタフェース102が取り外された状態で使用される。
When learning is completed, the
学習装置101及び電力計算部103は、学習の終了後には取り外されても良く、装着されたままであっても良い。
特に、学習装置101及び電力計算部103の機能がプロセッサ91によるプログラムの実行によって実現される場合には、該プログラムは、メモリ92に記憶されたままであっても良い。The
In particular, when the functions of the
上記した学習装置101及び電力計算部103が図14のコンピュータで構成されている場合の、プロセッサ91による処理の手順を図19及び図20を参照して説明する。
なお、図19は、画像処理装置2b及び画像表示部3における処理をステップST61~ST62としても図示している。図19にはさらに、学習装置101と画像処理装置2bとの間の信号或いはデータの授受が点線で示されている。The procedure of processing by the
Note that FIG. 19 also illustrates the processing in the
図19のステップST31では、学習装置101は、元となるニューラルネットワークを用意する。即ち、変換テーブル生成部31を元となるニューラルネットワークで仮に構築する。
このニューラルネットワークは、図17に示されるニューラルネットワークと同様のものである。In step ST31 of FIG. 19, the
This neural network is similar to the neural network shown in FIG.
ステップST32では、学習装置101は、ステップST31で用意されたニューラルネットワークの中間層及び出力層のニューロンの各々における演算で用いられるパラメータ(重み及びバイアス)の組PSの初期値を設定する。
初期値はランダムに選択された値であっても良く、適切と予想される値であっても良い。In step ST32, the
The initial value may be a randomly selected value or a value that is expected to be appropriate.
ステップST33では、学習装置101は、予め用意された複数個の、画像から一つの画像、即ち最初の画像を選択する。
ステップST34では、学習装置101は、選択された画像を画像入力部11に入力する。In step ST33, the
In step ST34, the
入力された画像に対し、画像処理装置2bでは、ステップST61で、平均輝度算出部12が平均輝度ALを算出し、ヒストグラム生成部13がヒストグラムHISTを生成し、ピーク輝度算出部14がピーク輝度MAXLを算出し、ステップST62で、変換テーブル生成部31が変換テーブルTを生成し、ステップST63で、画像変換部16が生成された変換テーブルTを用いて画像変換を行なう。画像変換で得られた出力画像Dbは、ステップST64で、画像表示部3に表示される。
In the
ステップST35で、学習装置101は、ステップST61で算出或いは生成された平均輝度AL、ヒストグラムHIST、及びピーク輝度MAXLを取得する。
In step ST35, the
ステップST36で、学習装置101は、ステップST62で生成された変換テーブルTを取得する。
In step ST36, the
ステップST37で、学習装置101は、ステップST35で取得した平均輝度AL、ヒストグラムHIST、及びピーク輝度MAXL、並びにステップST36で取得した変換テーブルTに基づいて、条件(a)、(c)、及び(d)が充たされているかを判定する。
In step ST37, the
充たされていなければ、ステップST38に進む。
ステップST38で、学習装置101は、パラメータの組PSを変更する。この変更は、変換テーブル生成部31で生成される変換テーブルが上記の条件(a)、(c)、及び(d)を充たす状態となるように行われる。
ステップST38の処理が行われると、画像処理装置2bの変換テーブル生成部31は、パラメータの組PSが変更されたニューラルネットワークで再度変換テーブルTを生成し(ST62)、画像変換部16は、生成された変換テーブルTを用いて画像変換を行い(ST63)、画像表示部3は画像変換で生成された出力画像Dbを表示する(ST64)。If it is not filled, the process advances to step ST38.
In step ST38, the
When the process of step ST38 is performed, the conversion
学習装置101は、ステップST38の処理の後、変換テーブルTがステップST62で再度生成されるのを待ち、再度生成されたら、ステップST36以下の処理を繰り返す。
After the process in step ST38, the
ステップST37で、条件(a)、(c)、及び(d)が充たされている場合には、図20のステップST39及びステップST40の処理を行なう。 If the conditions (a), (c), and (d) are satisfied in step ST37, steps ST39 and ST40 in FIG. 20 are performed.
ステップST39では、学習装置101は、画像表示部における消費電力の計算結果を取得する。ここで取得される消費電力は、入力された画像を、生成された変換テーブルTで変換し、変換後の画像を表示したときの、消費電力であり、電力計算部103で計算されたものである。
In step ST39, the
ステップST40では、学習装置101は、表示画像についての主観評価を取得する。
この主観評価は、表示画像についての被験者の評価結果であり、入力インタフェース102を介して入力される。ここでは、一つの画像が表示されると、それに対し、複数の被験者が順次主観評価の結果を入力する構成であるものとしている。In step ST40, the
This subjective evaluation is the result of the test subject's evaluation of the displayed image, and is input via the
ステップST39の処理とステップST40の処理とは並行して行い得る。
なお、消費電力の算出値を取得する処理(ST39)には、電力計算部103に対して消費電力の算出を行なうことを指示し、指示に応じて電力計算部103が算出した消費電力の算出値が入力されるのを待つ処理が含まれる。
同様に、主観評価の結果を取得する処理(ST40)には、被験者に対して主観評価の結果を入力するよう案内する情報(音声情報又は映像情報)を出力し、それに応じて被験者が主観評価の結果を入力するのを待つ処理が含まれる。The processing in step ST39 and the processing in step ST40 can be performed in parallel.
Note that in the process of acquiring the calculated value of power consumption (ST39), the
Similarly, in the process (ST40) of acquiring the results of the subjective evaluation, information (audio information or video information) that guides the subject to input the results of the subjective evaluation is output, and the subject performs the subjective evaluation accordingly. It includes the process of waiting for the input of the result.
ステップST41では、学習装置101は、上記の複数個の画像の全てについて、ステップST34~ST40の処理が終わったか否かを判定する。
複数個の画像の全てについて上記の処理が終わっていなければ、ステップST42で次の画像を選択する。次の画像としては予め用意された複数の画像のうちのいまだ選択されていないものが選択される。ステップST42の次にステップST34に戻る。In step ST41, the
If the above processing has not been completed for all of the plurality of images, the next image is selected in step ST42. As the next image, one of the plurality of images prepared in advance that has not yet been selected is selected. After step ST42, the process returns to step ST34.
複数個の画像の全てについて上記の処理が終わっていれば、ステップST43に進む。
ステップST43で学習装置101は、条件(b)が充たされているか否かを判定する。
充たされていなければ、ステップST44で、学習装置101は、パラメータの組PSを変更する。この変更は、ニューラルネットワークによって生成される変換テーブルTが条件(b)を充たす状態となるように行われる。If the above processing has been completed for all of the plurality of images, the process advances to step ST43.
In step ST43, the
If not satisfied, the
ステップST43で条件(b)が充たされている場合には、ステップST45で、学習装置は、総合評価値を算出し、次にステップST46で、学習装置101は、総合評価値EVが閾値EVth以上であるか否かの判定を行なう。
ステップST46で総合評価値EVが閾値EVth未満であれば、ステップST47に進む。If the condition (b) is satisfied in step ST43, the learning device calculates the comprehensive evaluation value in step ST45, and then in step ST46, the
If the comprehensive evaluation value EV is less than the threshold value EVth in step ST46, the process advances to step ST47.
ステップST47では、学習装置101は、パラメータの組PSを変更する。
変更は、総合評価値がより大きくなるように行う。
変更に当たっては勾配降下法を用い得る。
ステップST44又はステップST47におけるパラメータの組PSの変更後、ステップST33に戻る。In step ST47, the
Changes are made so that the overall evaluation value becomes larger.
A gradient descent method can be used for the change.
After changing the parameter set PS in step ST44 or step ST47, the process returns to step ST33.
ステップST46で、総合評価値EVが閾値EVth以上であれば、ステップST48に進む。
ステップST48では、学習装置101は、設定又は変更されたパラメータの組PSを、最適なパラメータの組として採用する。即ち、ステップST38、ST44及びステップST47のいずれをも経ることなく、ステップST48に達している場合には、ステップST32で設定されたパラメータの組PSを最適なパラメータの組として採用する。ステップST38、ST44又はST47を経て、ステップST48に達している場合には、直前のステップST38、ST44又はST47における処理での変更後のパラメータの組PSを最適なパラメータの組として採用する。If the comprehensive evaluation value EV is equal to or greater than the threshold EVth in step ST46, the process proceeds to step ST48.
In step ST48, the
以上で、ニューラルネットワークの生成の処理が終わる。
即ち、変換テーブル生成部31は、以上の処理で生成されたニューラルネットワークによって構成されたものとなる。This completes the neural network generation process.
That is, the conversion
上記の例では、ステップST39で消費電力の算出値を取得しているが、代わりに消費電力の計測値を取得しても良い。計測値は図示しない電力計測部での計測で得られたものであっても良い。 In the above example, the calculated value of power consumption is acquired in step ST39, but a measured value of power consumption may be acquired instead. The measured value may be obtained by measurement by a power measuring section (not shown).
上記の例では、一つの画像が表示されると、それに対し、複数の被験者が順次主観評価の結果を入力する構成である。代わりに、複数の被験者の各々が画像表示部3に表示される画像を見ている状態で、ステップST33からST42の処理を行なうこととしても良い。即ち、各被験者に対して、複数の画像が順次表示され、当該被験者が表示画像毎に評価の結果を入力する構成であっても良い。
In the above example, when one image is displayed, a plurality of subjects sequentially input subjective evaluation results in response to the image. Alternatively, steps ST33 to ST42 may be performed while each of the plurality of subjects is viewing the image displayed on the
上記の例では条件(a)~(d)が全て充たされるようにテーブルを作成する。
条件(b)、(c)、及び(d)の一つ以上が充足されないテーブルであっても良い。
条件(b)が充足されなくても良いとする場合には、ステップST43及びST44の処理を省略し得る。In the above example, the table is created so that conditions (a) to (d) are all satisfied.
The table may be one in which one or more of conditions (b), (c), and (d) are not satisfied.
If condition (b) does not need to be satisfied, the processes of steps ST43 and ST44 can be omitted.
また、図20のステップST41以降の処理を、図21に示す手順で行っても良い。
即ち、ステップST41で、複数個の画像の全てについて上記の処理が終わっていれば、ステップST45に進む。Further, the processes after step ST41 in FIG. 20 may be performed in accordance with the procedure shown in FIG. 21.
That is, in step ST41, if the above processing has been completed for all of the plurality of images, the process advances to step ST45.
ステップST45で、学習装置101は、総合評価値を算出する。
次のステップST49で、学習装置101は、条件(b)が充たされ、かつ総合評価値EVが閾値EVth以上であるか否かの判定を行なう。
条件(b)が充たされておらず、或いは総合評価値EVが閾値EVth未満であれば、ステップST50に進む。In step ST45, the
In the next step ST49, the
If the condition (b) is not satisfied or if the comprehensive evaluation value EV is less than the threshold value EVth, the process proceeds to step ST50.
ステップST50では、学習装置101は、パラメータの組PSを変更する。
変更は、条件(b)が充たされる状態になるように、かつ総合評価値がより大きくなるように行う。
変更に当たっては勾配降下法を用い得る。
ステップST50におけるパラメータの組PSの変更後、ステップST33に戻る。In step ST50, the
The changes are made so that condition (b) is satisfied and the overall evaluation value becomes larger.
A gradient descent method can be used for the change.
After changing the parameter set PS in step ST50, the process returns to step ST33.
ステップST49で、条件(b)が充たされ、かつ総合評価値EVが閾値EVth以上であれば、ステップST48に進む。
ステップST48では、学習装置101は、設定又は変更されたパラメータの組PSを、最適なパラメータの組として採用する。即ち、ステップST38及びステップST50のいずれをも経ることなく、ステップST48に達している場合には、ステップST32で設定されたパラメータの組PSを最適なパラメータの組として採用する。ステップST38又はST50を経て、ステップST48に達している場合には、直前のステップST38又はST50における処理での変更後のパラメータの組PSを最適なパラメータの組として採用する。In step ST49, if condition (b) is satisfied and the comprehensive evaluation value EV is equal to or greater than the threshold value EVth, the process proceeds to step ST48.
In step ST48, the
実施の形態2でも実施の形態1と同様の効果が得られる。また、変換テーブル生成部31が自動的に構築されるので、変換テーブル生成部31の設計に要する手間を省くことができる。さらにまた、画像処理装置2bに接続されている画像表示部3に最適な変換テーブルを生成することができ、画像の視認性を維持しつつ最大限の省電力化を図ることができる。
The second embodiment also provides the same effects as the first embodiment. Furthermore, since the conversion
上記の実施の形態には種々の変形が可能である。例えば、実施の形態1について説明した変形例は、矛盾しない範囲で、実施の形態2にも適用可能である。 Various modifications can be made to the embodiments described above. For example, the modifications described for the first embodiment can also be applied to the second embodiment to the extent that they do not contradict each other.
以上画像処理装置及び画像表示装置について説明したが、画像処理装置を用いて、画像処理方法を実施することも可能であり、また画像処理装置又は画像処理方法における処理をプログラムによりコンピュータに実行させることも可能である。 Although the image processing device and the image display device have been described above, it is also possible to implement the image processing method using the image processing device, and it is also possible to cause a computer to execute the processing in the image processing device or the image processing method using a program. is also possible.
1 画像表示装置、 2,2b 画像処理装置、 3 画像表示部、 11 画像入力部、 12 平均輝度算出部、 13 ヒストグラム生成部、 14 ピーク輝度算出部、 15 変換テーブル生成部、 16 画像変換部、 17 比較部、 18 第1変換テーブル生成部、 19 第2変換テーブル生成部、 20 無変換テーブル格納部、 21 変換テーブル合成部、 23 パラメータ決定部、 24 テーブル値算出部、 31 変換テーブル生成部、 32 ニューラルネットワーク、 33 入力層、 34 中間層、 35 出力層。 1 image display device, 2, 2b image processing device, 3 image display unit, 11 image input unit, 12 average brightness calculation unit, 13 histogram generation unit, 14 peak brightness calculation unit, 15 conversion table generation unit, 16 image conversion unit, 17 comparison unit, 18 first conversion table generation unit, 19 second conversion table generation unit, 20 non-conversion table storage unit, 21 conversion table synthesis unit, 23 parameter determination unit, 24 table value calculation unit, 31 conversion table generation unit, 32 neural network, 33 input layer, 34 intermediate layer, 35 output layer.
Claims (13)
前記入力画像の平均輝度を算出する平均輝度算出部と、
前記入力画像の階調値の階級毎の出現度数を表すヒストグラムを生成するヒストグラム生成部と、
前記入力画像のピーク輝度を算出するピーク輝度算出部と、
前記平均輝度と前記ヒストグラムと前記ピーク輝度とから、前記入力画像の階調値と前記出力画像の階調値との関係を規定する変換テーブルを生成する変換テーブル生成部と、
前記変換テーブルを用いて前記入力画像を変換して前記出力画像を生成する画像変換部とを備え、
前記変換テーブル生成部は、前記平均輝度を予め定められた閾値と比較し、
前記平均輝度が前記閾値より低いときは、前記変換テーブル生成部は、前記変換テーブルとして、前記入力画像の階調値がそのまま出力画像の階調値となる変換テーブルを生成し、
前記平均輝度が前記閾値以上のときは、前記変換テーブル生成部は、前記変換テーブルとして、前記入力画像の階調値が前記ピーク輝度に等しいときは前記出力画像の階調値も前記ピーク輝度に等しく、前記入力画像の階調値が0よりも高く前記ピーク輝度よりも低い範囲の少なくとも一部では、前記出力画像の階調値が前記入力画像の階調値よりも小さく、前記入力画像において出現度数の多い階調値範囲で、前記入力画像の階調値の変化に対する前記出力画像の階調値の変化が比較的大きく、前記入力画像において出現度数の少ない階調値範囲で、前記入力画像の階調値の変化に対する前記出力画像の階調値の変化が比較的小さい変換テーブルを生成し、
前記平均輝度が前記閾値以上のときに前記変換テーブル生成部により生成される前記変換テーブルは、前記入力画像の階調値と第1出力階調値との関係を規定する第1変換テーブルと、前記入力画像の階調値と第2出力階調値との関係を規定する第2変換テーブルとを重畳することにより生成されるものであり、
前記変換テーブル生成部は、前記入力画像の階調値が0よりも高く前記ピーク輝度よりも低い範囲の少なくとも一部において前記入力画像の階調値よりも小さい値を前記第1出力階調値とすることで前記第1変換テーブルを生成し、
前記変換テーブル生成部は、前記ヒストグラムから累積密度関数を生成し、前記累積密度関数の値又は前記累積密度関数の傾きに対して制限を加えた曲線の値を前記第2出力階調値とすることで前記第2変換テーブルを生成する
画像処理装置。 An image processing device that generates an output image based on an input image, and supplies the output image to a self-luminous image display unit to display the image,
an average brightness calculation unit that calculates the average brightness of the input image;
a histogram generation unit that generates a histogram representing the frequency of appearance for each class of gradation values of the input image;
a peak brightness calculation unit that calculates peak brightness of the input image;
a conversion table generation unit that generates a conversion table that defines a relationship between tone values of the input image and tone values of the output image from the average brightness, the histogram, and the peak brightness;
an image conversion unit that converts the input image using the conversion table to generate the output image,
The conversion table generation unit compares the average brightness with a predetermined threshold,
When the average luminance is lower than the threshold, the conversion table generation unit generates, as the conversion table, a conversion table in which the gradation values of the input image become the gradation values of the output image as they are;
When the average brightness is greater than or equal to the threshold, the conversion table generation unit generates a conversion table that, when the gradation value of the input image is equal to the peak brightness, also sets the gradation value of the output image to the peak brightness. Equally, in at least a part of the range where the tone value of the input image is higher than 0 and lower than the peak brightness, the tone value of the output image is smaller than the tone value of the input image , and the tone value of the input image is lower than the tone value of the input image. In the gradation value range that appears frequently in the gradation value range, the change in the gradation value of the output image with respect to the change in the gradation value of the input image is relatively large; generating a conversion table in which a change in tone value of the output image with respect to a change in tone value of the input image is relatively small ;
The conversion table generated by the conversion table generation unit when the average luminance is equal to or greater than the threshold value includes a first conversion table that defines a relationship between a tone value of the input image and a first output tone value; It is generated by superimposing a second conversion table that defines the relationship between the gradation value of the input image and the second output gradation value,
The conversion table generation unit converts a value smaller than a gradation value of the input image into the first output gradation value in at least a part of a range where the gradation value of the input image is higher than 0 and lower than the peak luminance. Generate the first conversion table by
The conversion table generation unit generates a cumulative density function from the histogram, and sets a value of the cumulative density function or a value of a curve obtained by restricting the slope of the cumulative density function as the second output gradation value. An image processing device that generates the second conversion table .
前記入力画像の平均輝度を算出する平均輝度算出部と、
前記入力画像の階調値の階級毎の出現度数を表すヒストグラムを生成するヒストグラム生成部と、
前記入力画像のピーク輝度を算出するピーク輝度算出部と、
前記平均輝度と前記ヒストグラムと前記ピーク輝度とから、前記入力画像の階調値と前記出力画像の階調値との関係を規定する変換テーブルを生成する変換テーブル生成部と、
前記変換テーブルを用いて前記入力画像を変換して前記出力画像を生成する画像変換部とを備え、
前記変換テーブル生成部は、前記平均輝度を予め定められた閾値と比較し、
前記平均輝度が前記閾値より低いときは、前記変換テーブル生成部は、前記変換テーブルとして、前記入力画像の階調値がそのまま出力画像の階調値となる変換テーブルを生成し、
前記平均輝度が前記閾値以上のときは、前記変換テーブル生成部は、前記変換テーブルとして、前記入力画像の階調値が0よりも高く前記ピーク輝度よりも低い範囲の少なくとも一部では、前記出力画像の階調値が前記入力画像の階調値よりも小さく、前記少なくとも一部よりも前記ピーク輝度に近い範囲では、前記出力画像の階調値と前記入力画像の階調値との差が前記少なくとも一部の範囲より小さいか、又は、前記出力画像の階調値が前記入力画像の階調値より大きく、前記入力画像において出現度数の多い階調値範囲で、前記入力画像の階調値の変化に対する前記出力画像の階調値の変化が比較的大きく、前記入力画像において出現度数の少ない階調値範囲で、前記入力画像の階調値の変化に対する前記出力画像の階調値の変化が比較的小さい変換テーブルを生成し、
前記平均輝度が前記閾値以上のときに前記変換テーブル生成部により生成される前記変換テーブルは、前記入力画像の階調値と第1出力階調値との関係を規定する第1変換テーブルと、前記入力画像の階調値と第2出力階調値との関係を規定する第2変換テーブルとを重畳することにより生成されるものであり、
前記変換テーブル生成部は、前記入力画像の階調値が0よりも高く前記ピーク輝度よりも低い範囲の少なくとも一部において前記入力画像の階調値よりも小さい値を前記第1出力階調値とすることで前記第1変換テーブルを生成し、
前記変換テーブル生成部は、前記ヒストグラムから累積密度関数を生成し、前記累積密度関数の値又は前記累積密度関数の傾きに対して制限を加えた曲線の値を前記第2出力階調値とすることで前記第2変換テーブルを生成する
画像処理装置。 In an image processing device that generates an output image based on an input image,
an average brightness calculation unit that calculates the average brightness of the input image;
a histogram generation unit that generates a histogram representing the frequency of appearance for each class of gradation values of the input image;
a peak brightness calculation unit that calculates peak brightness of the input image;
a conversion table generation unit that generates a conversion table that defines a relationship between tone values of the input image and tone values of the output image from the average brightness, the histogram, and the peak brightness;
an image conversion unit that converts the input image using the conversion table to generate the output image,
The conversion table generation unit compares the average brightness with a predetermined threshold,
When the average luminance is lower than the threshold, the conversion table generation unit generates, as the conversion table, a conversion table in which the gradation values of the input image become the gradation values of the output image as they are;
When the average luminance is greater than or equal to the threshold, the conversion table generation unit generates the output image as the conversion table in at least a part of the range where the gradation value of the input image is higher than 0 and lower than the peak brightness. In a range where the tone value of the image is smaller than the tone value of the input image and closer to the peak luminance than the at least part, the difference between the tone value of the output image and the tone value of the input image is The gradation value of the input image is smaller than the at least part of the range, or the gradation value of the output image is larger than the gradation value of the input image, and the gradation value range is a gradation value range that appears frequently in the input image. The gradation value of the output image with respect to the change in the gradation value of the input image is within a gradation value range in which the change in the gradation value of the output image with respect to the change in the gradation value is relatively large and occurs less frequently in the input image. Generates a conversion table with relatively small changes in
The conversion table generated by the conversion table generation unit when the average luminance is equal to or greater than the threshold value includes a first conversion table that defines a relationship between a tone value of the input image and a first output tone value; It is generated by superimposing a second conversion table that defines the relationship between the gradation value of the input image and the second output gradation value,
The conversion table generation unit converts a value smaller than a gradation value of the input image into the first output gradation value in at least a part of a range where the gradation value of the input image is higher than 0 and lower than the peak luminance. Generate the first conversion table by
The conversion table generation unit generates a cumulative density function from the histogram, and sets a value of the cumulative density function or a value of a curve obtained by restricting the slope of the cumulative density function as the second output gradation value. An image processing device that generates the second conversion table .
請求項1又は2に記載の画像処理装置。 When the average luminance is greater than or equal to the threshold, the conversion table generation unit generates the output image for the gradation value of the input image in a range lower than the peak luminance as the average luminance increases. The image processing apparatus according to claim 1 or 2, wherein the image processing apparatus generates a conversion table having a large reduction in gradation value.
請求項1から3のいずれか1項に記載の画像処理装置。 According to any one of claims 1 to 3, the superimposition is performed by a process that includes multiplication of the first output tone value and the second output tone value with respect to tone values of the input image having the same value. image processing device.
請求項1から4のいずれか1項に記載の画像処理装置。 The conversion table generation unit is configured to increase the decrease amount of the first output gradation value with respect to the gradation value of the input image in a range lower than the peak luminance as the average luminance increases. The image processing device according to claim 1 , wherein the first conversion table is generated.
前記入力画像の平均輝度を算出する平均輝度算出部と、
前記入力画像の階調値の階級毎の出現度数を表すヒストグラムを生成するヒストグラム生成部と、
前記入力画像のピーク輝度を算出するピーク輝度算出部と、
前記平均輝度と前記ヒストグラムと前記ピーク輝度とから、前記入力画像の階調値と前記出力画像の階調値との関係を規定する変換テーブルを生成する変換テーブル生成部と、
前記変換テーブルを用いて前記入力画像を変換して前記出力画像を生成する画像変換部とを備え、
前記出力画像は、画像表示部における画像表示に用いられるものであり、
前記変換テーブル生成部は、
前記平均輝度、前記ヒストグラム、及び前記ピーク輝度の組み合わせと、前記変換テーブルとを対応付ける学習済みニューラルネットワークを用いて前記変換テーブルを生成し、
前記学習済みニューラルネットワークは、前記変換テーブルが予め定められた条件を満たし、かつ前記変換テーブルを用いた場合の表示画像の視認性が良好であり、かつ前記画像表示部における消費電力が少なくなるように学習した結果生成されたものであり、
前記予め定められた条件が、少なくとも
前記平均輝度が予め定められた閾値より低いときは、前記入力画像の階調値がそのまま出力画像の階調値となることと、
前記入力画像の階調値が0よりも高く前記ピーク輝度よりも低い範囲の少なくとも一部では、前記出力画像の階調値が前記入力画像の階調値よりも小さいことと、
前記入力画像において出現度数の多い階調値範囲で、前記入力画像の階調値の変化に対する前記出力画像の階調値の変化が比較的大きく、前記入力画像において出現度数の少ない階調値範囲で、前記入力画像の階調値の変化に対する前記出力画像の階調値の変化が比較的小さいこととを含む
画像処理装置。 An image processing device that generates an output image based on an input image, and supplies the output image to a self-luminous image display unit to display the image,
an average brightness calculation unit that calculates the average brightness of the input image;
a histogram generation unit that generates a histogram representing the frequency of appearance for each class of gradation values of the input image;
a peak brightness calculation unit that calculates peak brightness of the input image;
a conversion table generation unit that generates a conversion table that defines a relationship between tone values of the input image and tone values of the output image from the average brightness, the histogram, and the peak brightness;
an image conversion unit that converts the input image using the conversion table to generate the output image,
The output image is used for image display on an image display section,
The conversion table generation unit includes:
generating the conversion table using a trained neural network that associates the combination of the average brightness, the histogram, and the peak brightness with the conversion table;
The trained neural network is configured such that the conversion table satisfies predetermined conditions, the visibility of the displayed image is good when the conversion table is used, and the power consumption in the image display section is reduced. It was generated as a result of learning from
The predetermined condition is at least
When the average luminance is lower than a predetermined threshold, the gradation value of the input image becomes the gradation value of the output image as it is;
In at least part of a range where the input image has a tone value higher than 0 and lower than the peak luminance, the tone value of the output image is smaller than the tone value of the input image;
A gradation value range that appears frequently in the input image, where a change in the gradation value of the output image with respect to a change in the gradation value of the input image is relatively large, and a gradation value range that appears less frequently in the input image. and a change in the gradation value of the output image with respect to a change in the gradation value of the input image is relatively small.
Image processing device.
前記入力画像の前記平均輝度が高いほど、前記ピーク輝度よりも低い範囲での前記入力画像の階調値に対する前記出力画像の階調値の下げ幅が大きいことを含む The higher the average luminance of the input image, the greater the decrease in the gradation value of the output image relative to the gradation value of the input image in a range lower than the peak luminance.
請求項6に記載の画像処理装置。 The image processing device according to claim 6.
前記出力画像に基づいて画像表示を行なう前記画像表示部とを備えた
画像表示装置。 An image processing device according to claim 1 , 6 or 7 ,
An image display device, comprising: the image display section that displays an image based on the output image.
前記出力画像に基づいて画像表示を行なう画像表示部とを備えた
画像表示装置。 An image processing device according to claim 2 ;
An image display device comprising: an image display section that displays an image based on the output image.
前記入力画像の平均輝度を算出し、
前記入力画像の階調値の階級毎の出現度数を表すヒストグラムを生成し、
前記入力画像のピーク輝度を算出し、
前記平均輝度と前記ヒストグラムと前記ピーク輝度とから、前記入力画像の階調値と前記出力画像の階調値との関係を規定する変換テーブルを生成し、
前記変換テーブルを用いて前記入力画像を変換して前記出力画像を生成することを含み、
前記平均輝度が予め定められた閾値と比較され、
前記平均輝度が前記閾値よりも低いときは、前記変換テーブルとして、前記入力画像の階調値がそのまま出力画像の階調値となる変換テーブルが生成され、
前記平均輝度が前記閾値以上のときは、前記変換テーブルとして、前記入力画像の階調値が前記ピーク輝度に等しいときは前記出力画像の階調値も前記ピーク輝度に等しく、前記入力画像の階調値が0よりも高く前記ピーク輝度よりも低い範囲の少なくとも一部では、前記出力画像の階調値が前記入力画像の階調値よりも小さく、前記入力画像において出現度数の多い階調値範囲で、前記入力画像の階調値の変化に対する前記出力画像の階調値の変化が比較的大きく、前記入力画像において出現度数の少ない階調値範囲で、前記入力画像の階調値の変化に対する前記出力画像の階調値の変化が比較的小さい変換テーブルが生成され、
前記平均輝度が前記閾値以上のときに生成される前記変換テーブルは、前記入力画像の階調値と第1出力階調値との関係を規定する第1変換テーブルと、前記入力画像の階調値と第2出力階調値との関係を規定する第2変換テーブルとを重畳することにより生成され、
前記第1変換テーブルは、前記入力画像の階調値が0よりも高く前記ピーク輝度よりも低い範囲の少なくとも一部において前記入力画像の階調値よりも小さい値を前記第1出力階調値とすることで生成され、
前記第2変換テーブルは、前記ヒストグラムから累積密度関数を生成し、前記累積密度関数の値又は前記累積密度関数の傾きに対して制限を加えた曲線の値を前記第2出力階調値とすることで生成される
画像処理方法。 An image processing method that generates an output image based on an input image, and supplies the output image to a self-luminous image display section to display the image,
Calculating the average brightness of the input image,
Generate a histogram representing the frequency of appearance for each class of gradation values of the input image,
calculating the peak brightness of the input image;
generating a conversion table that defines a relationship between tone values of the input image and tone values of the output image from the average brightness, the histogram, and the peak brightness;
converting the input image using the conversion table to generate the output image;
the average brightness is compared with a predetermined threshold;
When the average luminance is lower than the threshold, a conversion table is generated as the conversion table in which the gradation values of the input image become the gradation values of the output image as they are;
When the average luminance is greater than or equal to the threshold value, the conversion table is such that when the gradation value of the input image is equal to the peak luminance, the gradation value of the output image is also equal to the peak luminance; In at least a part of the range where the tone value is higher than 0 and lower than the peak luminance, the tone value of the output image is smaller than the tone value of the input image, and the tone value appears frequently in the input image. In a value range, a change in the tone value of the output image with respect to a change in the tone value of the input image is relatively large, and in a tone value range that appears less frequently in the input image, the tone value of the input image is A conversion table is generated in which a change in tone value of the output image with respect to a change is relatively small ;
The conversion table generated when the average luminance is equal to or greater than the threshold value includes a first conversion table that defines the relationship between the gradation value of the input image and a first output gradation value, and a gradation table of the input image. generated by superimposing a second conversion table that defines the relationship between the value and the second output gradation value,
The first conversion table converts a value smaller than the tone value of the input image into the first output tone value in at least a part of a range where the tone value of the input image is higher than 0 and lower than the peak brightness. It is generated by
The second conversion table generates a cumulative density function from the histogram, and sets the value of the cumulative density function or the value of a curve obtained by restricting the slope of the cumulative density function as the second output gradation value. An image processing method generated by
前記入力画像の平均輝度を算出し、
前記入力画像の階調値の階級毎の出現度数を表すヒストグラムを生成し、
前記入力画像のピーク輝度を算出し、
前記平均輝度と前記ヒストグラムと前記ピーク輝度とから、前記入力画像の階調値と前記出力画像の階調値との関係を規定する変換テーブルを生成し、
前記変換テーブルを用いて前記入力画像を変換して前記出力画像を生成することを含み、
前記平均輝度が予め定められた閾値と比較され、
前記平均輝度が前記閾値よりも低いときは、前記変換テーブルとして、前記入力画像の階調値がそのまま出力画像の階調値となる変換テーブルが生成され、
前記平均輝度が前記閾値以上のときは、前記変換テーブルとして、前記入力画像の階調値が0よりも高く前記ピーク輝度よりも低い範囲の少なくとも一部では、前記出力画像の階調値が前記入力画像の階調値よりも小さく、前記少なくとも一部よりも前記ピーク輝度に近い範囲では、前記出力画像の階調値と前記入力画像の階調値との差が前記少なくとも一部の範囲より小さいか、又は、前記出力画像の階調値が前記入力画像の階調値より大きく、前記入力画像において出現度数の多い階調値範囲で、前記入力画像の階調値の変化に対する前記出力画像の階調値の変化が比較的大きく、前記入力画像において出現度数の少ない階調値範囲で、前記入力画像の階調値の変化に対する前記出力画像の階調値の変化が比較的小さい変換テーブルが生成され、
前記平均輝度が前記閾値以上のときに生成される前記変換テーブルは、前記入力画像の階調値と第1出力階調値との関係を規定する第1変換テーブルと、前記入力画像の階調値と第2出力階調値との関係を規定する第2変換テーブルとを重畳することにより生成され、
前記第1変換テーブルは、前記入力画像の階調値が0よりも高く前記ピーク輝度よりも低い範囲の少なくとも一部において前記入力画像の階調値よりも小さい値を前記第1出力階調値とすることで生成され、
前記第2変換テーブルは、前記ヒストグラムから累積密度関数を生成し、前記累積密度関数の値又は前記累積密度関数の傾きに対して制限を加えた曲線の値を前記第2出力階調値とすることで生成される
画像処理方法。 In an image processing method that generates an output image based on an input image,
Calculating the average brightness of the input image,
Generating a histogram representing the frequency of appearance for each class of gradation values of the input image,
calculating the peak brightness of the input image;
generating a conversion table that defines a relationship between tone values of the input image and tone values of the output image from the average brightness, the histogram, and the peak brightness;
converting the input image using the conversion table to generate the output image;
the average brightness is compared with a predetermined threshold;
When the average luminance is lower than the threshold, a conversion table is generated as the conversion table in which the gradation values of the input image become the gradation values of the output image as they are,
When the average brightness is greater than or equal to the threshold, the conversion table may be configured such that in at least part of the range where the input image has a tone value higher than 0 and lower than the peak brightness, the tone value of the output image is In a range smaller than the gradation value of the input image and closer to the peak luminance than the at least part of the range, the difference between the gradation value of the output image and the gradation value of the input image is smaller than the at least part of the range. The output in response to a change in the gradation value of the input image is within a gradation value range that is smaller or larger than the gradation value of the input image and that occurs frequently in the input image. Changes in tone values of the output image are relatively small in response to changes in tone values of the input image in a tone value range in which changes in tone values of the image are relatively large and occur less frequently in the input image. A conversion table is generated and
The conversion table that is generated when the average luminance is equal to or greater than the threshold value includes a first conversion table that defines the relationship between the gradation value of the input image and a first output gradation value, and a gradation level of the input image. generated by superimposing a second conversion table that defines the relationship between the value and the second output gradation value,
The first conversion table converts a value smaller than the tone value of the input image into the first output tone value in at least a part of a range where the tone value of the input image is higher than 0 and lower than the peak brightness. It is generated by
The second conversion table generates a cumulative density function from the histogram, and sets the value of the cumulative density function or the value of a curve obtained by restricting the slope of the cumulative density function as the second output gradation value. An image processing method generated by
Applications Claiming Priority (1)
| Application Number | Priority Date | Filing Date | Title |
|---|---|---|---|
| PCT/JP2020/027676 WO2022014009A1 (en) | 2020-07-16 | 2020-07-16 | Image processing device and method, image display device, program, and recording medium |
Publications (3)
| Publication Number | Publication Date |
|---|---|
| JPWO2022014009A1 JPWO2022014009A1 (en) | 2022-01-20 |
| JPWO2022014009A5 JPWO2022014009A5 (en) | 2022-10-24 |
| JP7407940B2 true JP7407940B2 (en) | 2024-01-04 |
Family
ID=79554551
Family Applications (1)
| Application Number | Title | Priority Date | Filing Date |
|---|---|---|---|
| JP2022536068A Active JP7407940B2 (en) | 2020-07-16 | 2020-07-16 | Image processing device and method, image display device, program and recording medium |
Country Status (4)
| Country | Link |
|---|---|
| US (1) | US12211427B2 (en) |
| JP (1) | JP7407940B2 (en) |
| CN (1) | CN115803800A (en) |
| WO (1) | WO2022014009A1 (en) |
Citations (3)
| Publication number | Priority date | Publication date | Assignee | Title |
|---|---|---|---|---|
| CN101272504A (en) | 2007-03-19 | 2008-09-24 | 帆宣系统科技股份有限公司 | Image processing apparatus |
| JP2013183453A (en) | 2012-11-21 | 2013-09-12 | Sharp Corp | Video display device and television receiver |
| US20140152704A1 (en) | 2012-11-30 | 2014-06-05 | Lg Display Co., Ltd. | Method and apparatus for controlling current of organic light emitting diode display device |
Family Cites Families (15)
| Publication number | Priority date | Publication date | Assignee | Title |
|---|---|---|---|---|
| JP2506205B2 (en) * | 1989-11-15 | 1996-06-12 | 松下電器産業株式会社 | Black level correction device |
| CA2415340C (en) * | 2001-04-25 | 2006-05-16 | Masahiro Kawashima | Video display apparatus and method which controls the source light level using apl detection |
| JP2004180142A (en) * | 2002-11-28 | 2004-06-24 | Canon Inc | Image processing apparatus, gradation conversion characteristic setting method, and program |
| JP4078649B2 (en) * | 2004-01-28 | 2008-04-23 | 日本ビクター株式会社 | Video signal processing apparatus and method |
| JP4082393B2 (en) * | 2004-07-09 | 2008-04-30 | セイコーエプソン株式会社 | Gradation characteristic control according to image characteristics |
| US7982707B2 (en) * | 2004-12-02 | 2011-07-19 | Sharp Laboratories Of America, Inc. | Methods and systems for generating and applying image tone scale adjustments |
| JP2008158399A (en) | 2006-12-26 | 2008-07-10 | Sony Corp | Power consumption reduction device, self-luminous display device, electronic device, power consumption reduction method, and computer program |
| JP2010091719A (en) | 2008-10-07 | 2010-04-22 | Sony Corp | Display apparatus, display data processing device, and display data processing method |
| JP5293367B2 (en) | 2009-04-17 | 2013-09-18 | セイコーエプソン株式会社 | Self-luminous display device and electronic device |
| KR101761413B1 (en) * | 2010-11-24 | 2017-08-07 | 엘지디스플레이 주식회사 | Image quality enhancement method and display device using the same |
| JP5527195B2 (en) * | 2010-12-17 | 2014-06-18 | 株式会社日立製作所 | Video display device |
| US9288426B2 (en) * | 2012-02-03 | 2016-03-15 | Panasonic Intellectual Property Management Co., Ltd. | Video display control device |
| JP2013228560A (en) * | 2012-04-25 | 2013-11-07 | Sharp Corp | Light-emitting diode control circuit and display device |
| KR102196912B1 (en) * | 2014-02-13 | 2020-12-31 | 삼성디스플레이 주식회사 | display device and driving method thereof |
| JP2016163099A (en) | 2015-02-27 | 2016-09-05 | シャープ株式会社 | Image processor and image display device |
-
2020
- 2020-07-16 JP JP2022536068A patent/JP7407940B2/en active Active
- 2020-07-16 CN CN202080102668.0A patent/CN115803800A/en active Pending
- 2020-07-16 WO PCT/JP2020/027676 patent/WO2022014009A1/en not_active Ceased
- 2020-07-16 US US18/008,180 patent/US12211427B2/en active Active
Patent Citations (3)
| Publication number | Priority date | Publication date | Assignee | Title |
|---|---|---|---|---|
| CN101272504A (en) | 2007-03-19 | 2008-09-24 | 帆宣系统科技股份有限公司 | Image processing apparatus |
| JP2013183453A (en) | 2012-11-21 | 2013-09-12 | Sharp Corp | Video display device and television receiver |
| US20140152704A1 (en) | 2012-11-30 | 2014-06-05 | Lg Display Co., Ltd. | Method and apparatus for controlling current of organic light emitting diode display device |
Also Published As
| Publication number | Publication date |
|---|---|
| JPWO2022014009A1 (en) | 2022-01-20 |
| US20230282155A1 (en) | 2023-09-07 |
| WO2022014009A1 (en) | 2022-01-20 |
| CN115803800A (en) | 2023-03-14 |
| US12211427B2 (en) | 2025-01-28 |
Similar Documents
| Publication | Publication Date | Title |
|---|---|---|
| Kuang et al. | Evaluating HDR rendering algorithms | |
| JP5085792B1 (en) | Video display device and television receiver | |
| US7136073B2 (en) | Automatic tone mapping for images | |
| JP5811228B2 (en) | Image processing apparatus, display apparatus, image processing method, and image processing program | |
| JP5085793B1 (en) | Video display device and television receiver | |
| JP2003333614A (en) | Image processing system, projector, image processing method, program, and information storage medium | |
| JP2012505460A (en) | Image contrast enhancement | |
| JP2015200734A (en) | Image display apparatus, image display apparatus control method, and program | |
| JP2013168898A (en) | Image display device and television receiver | |
| US10607525B2 (en) | System and method for color retargeting | |
| JP5284444B2 (en) | Video display device and television receiver | |
| JP2005277981A (en) | Selecting target images for image processing | |
| JP2013167719A (en) | Video display device and television receiver | |
| JP5104282B2 (en) | Image correction method and an image correction device | |
| JP4314822B2 (en) | Image processing apparatus, image processing method, and image processing program | |
| CN100470588C (en) | Ways to enhance the color of an image | |
| JP7407940B2 (en) | Image processing device and method, image display device, program and recording medium | |
| JP7313287B2 (en) | Method and apparatus for displaying images on dual display panel | |
| JP5174982B1 (en) | Video display device and television receiver | |
| CN100515096C (en) | Digital Image Adaptive Color Adjustment Method and Device for Display | |
| Bringier et al. | No-reference perceptual quality assessment of colour image | |
| CN119832878A (en) | Correction parameter determining method and device, electronic equipment and storage medium | |
| JP6532103B2 (en) | Video display device and television receiver | |
| JP2023114017A (en) | DISPLAY DEVICE AND CONTROL METHOD OF DISPLAY DEVICE | |
| JP6337945B2 (en) | Image processing apparatus, display apparatus, image processing method, and image processing program |
Legal Events
| Date | Code | Title | Description |
|---|---|---|---|
| A521 | Request for written amendment filed |
Free format text: JAPANESE INTERMEDIATE CODE: A523 Effective date: 20220804 |
|
| A621 | Written request for application examination |
Free format text: JAPANESE INTERMEDIATE CODE: A621 Effective date: 20220804 |
|
| A131 | Notification of reasons for refusal |
Free format text: JAPANESE INTERMEDIATE CODE: A131 Effective date: 20230725 |
|
| A521 | Request for written amendment filed |
Free format text: JAPANESE INTERMEDIATE CODE: A523 Effective date: 20230907 |
|
| TRDD | Decision of grant or rejection written | ||
| A01 | Written decision to grant a patent or to grant a registration (utility model) |
Free format text: JAPANESE INTERMEDIATE CODE: A01 Effective date: 20231121 |
|
| A61 | First payment of annual fees (during grant procedure) |
Free format text: JAPANESE INTERMEDIATE CODE: A61 Effective date: 20231219 |
|
| R150 | Certificate of patent or registration of utility model |
Ref document number: 7407940 Country of ref document: JP Free format text: JAPANESE INTERMEDIATE CODE: R150 |