JP2019012477A - Diagnostic program, diagnostic method, and diagnostic apparatus - Google Patents
Diagnostic program, diagnostic method, and diagnostic apparatus Download PDFInfo
- Publication number
- JP2019012477A JP2019012477A JP2017129803A JP2017129803A JP2019012477A JP 2019012477 A JP2019012477 A JP 2019012477A JP 2017129803 A JP2017129803 A JP 2017129803A JP 2017129803 A JP2017129803 A JP 2017129803A JP 2019012477 A JP2019012477 A JP 2019012477A
- Authority
- JP
- Japan
- Prior art keywords
- delay
- correlation
- resource
- degree
- data
- Prior art date
- Legal status (The legal status is an assumption and is not a legal conclusion. Google has not performed a legal analysis and makes no representation as to the accuracy of the status listed.)
- Pending
Links
Images













Landscapes
- Debugging And Monitoring (AREA)
Abstract
【課題】アプリの性能低下がクラウド基盤に原因があるのかアプリに原因があるのかを特定すること。【解決手段】遅延判定部41が遅延度合情報を遅延情報作成装置2から取得してアプリに遅延が発生したか否かを判定し、第1相関分析部42と第2相関分析部44が遅延が発生したアプリに関係するリソースデータと遅延度合との相関分析を行う。そして、遅延原因診断部46が、第1相関分析部42と第2相関分析部44の相関分析結果に基づいて遅延原因を特定する。【選択図】図2[PROBLEMS] To determine whether the performance degradation of an application is caused by the cloud platform or the application. A delay determination unit (41) acquires delay degree information from a delay information creation device (2), determines whether a delay has occurred in an application, and a first correlation analysis unit (42) and a second correlation analysis unit (44) Analyzes the correlation between resource data related to the app where the problem occurred and the degree of delay. Then, the delay cause diagnosis unit 46 identifies the cause of the delay based on the correlation analysis results of the first correlation analysis unit 42 and the second correlation analysis unit 44. [Selection] Figure 2
Description
本発明は、診断プログラム、診断方法及び診断装置に関する。 The present invention relates to a diagnostic program, a diagnostic method, and a diagnostic apparatus.
顧客にリソース(Resource)を提供するシステムでは、提供するリソースの状況を監視してリソースに問題がないかを確認することが重要となる。例えば、仮想マシンを提供するクラウドシステムでは、仮想マシン上で動作するアプリケーションの応答時間や負荷を監視してアプリケーションの性能に問題がないかを確認することが重要である。 In a system that provides a resource to a customer, it is important to monitor the status of the provided resource and check whether there is a problem with the resource. For example, in a cloud system that provides a virtual machine, it is important to monitor the response time and load of an application operating on the virtual machine to check whether there is a problem in the performance of the application.
ここで、仮想マシンとは、物理マシン(コンピュータ)上で動作する仮想的なコンピュータである。また、クラウドシステムとは、ネットワークを介して利用者にコンピュータのハードウェアやソフトウェアを提供するシステムである。 Here, the virtual machine is a virtual computer that operates on a physical machine (computer). A cloud system is a system that provides computer hardware and software to a user via a network.
アプリケーションの性能に関するデータの収集にはエージェントが用いられる。図38は、エージェントによる監視を説明するための図である。図38に示すように、物理マシン9では仮想マシン9aが動作し、仮想マシン9aによりアプリとエージェントが実行される。ここで、アプリは、アプリケーションである。エージェントは、アプリから性能に関するデータを収集してアプリの性能を監視する。
Agents are used to collect data about application performance. FIG. 38 is a diagram for explaining monitoring by an agent. As shown in FIG. 38, a
なお、論理的サーバ構成である複数のインスタンスに割り当てられたリソースの性能劣化を検出するとともに、性能劣化を呈するリソースを共有するインスタンスを抽出し、抽出したインスタンスの性能傾向と、性能パターンを比較する技術がある。ここで、性能パターンは、ボトルネック要因と関連付けてリソースの性能情報から抽出した特徴量を示す。この技術によれば、インスタンスの性能傾向との類似度が最大となる性能パターンからボトルネック要因を推定することができる。 In addition to detecting performance degradation of resources allocated to multiple instances that are logical server configurations, extract instances that share resources that exhibit performance degradation, and compare performance trends and performance patterns of the extracted instances There is technology. Here, the performance pattern indicates a feature amount extracted from the resource performance information in association with the bottleneck factor. According to this technology, the bottleneck factor can be estimated from the performance pattern that maximizes the similarity with the performance tendency of the instance.
また、連携してサービスを提供する複数のリソース各々に関する複数の情報を異なる管理装置から取得し、取得した複数の情報間の相関関係と所定の相関関係との差に基づいて、異常を発生させる原因となった異常原因リソースを特定する技術がある。この技術は、複数の情報間の相関関係と所定の相関関係との差が許容値よりも大きくなったリソースを異常リソース候補として抽出し、サービスにおける複数のリソース構成を示す構成情報に基づいて、異常リソース候補の中から異常原因リソースを特定する。この技術によれば、異常原因リソースを適切に特定することができる。 Also, a plurality of pieces of information related to each of a plurality of resources providing services in cooperation are acquired from different management devices, and an abnormality is generated based on a difference between a correlation between the acquired pieces of information and a predetermined correlation. There is a technology for identifying the cause of anomaly resources. In this technology, a resource in which a difference between a correlation between a plurality of pieces of information and a predetermined correlation is larger than an allowable value is extracted as an abnormal resource candidate, and based on configuration information indicating a plurality of resource configurations in the service, Identify the cause-of-failure resource from among the candidate abnormal resources. According to this technique, it is possible to appropriately specify the abnormality cause resource.
図38に示した性能監視には、各アプリケーションの性能を監視することはできるが、アプリケーションの性能低下がクラウド基盤に原因があるのかアプリケーションに原因があるのかを特定することができないという問題がある。ここで、クラウド基盤とは、サーバ、ネットワーク、ストレージ等のICT(Information and Communication Technology)インフラを仮想化技術を利用して提供する基盤である。クラウド基盤は、仮想マシン管理、ストレージ管理、ネットワーク管理等の機能を備える。 In the performance monitoring shown in FIG. 38, the performance of each application can be monitored, but there is a problem that it is impossible to specify whether the performance degradation of the application is caused by the cloud infrastructure or the application. . Here, the cloud platform is a platform that provides information and communication technology (ICT) infrastructure such as servers, networks, and storages using virtualization technology. The cloud platform has functions such as virtual machine management, storage management, and network management.
本発明は、一つの側面では、アプリケーションの性能低下がクラウド基盤に原因があるのかアプリケーションに原因があるのかを特定することを目的とする。 In one aspect, the present invention has an object of identifying whether a performance degradation of an application is caused by a cloud platform or an application.
1つの態様では、診断プログラムは、コンピュータに、アプリケーション毎に実行の遅延を示す遅延度合を取得して遅延度合が所定の閾値以上であるか否かを判定する処理を実行させる。そして、診断プログラムは、コンピュータに、遅延度合が所定の閾値以上であると判定した場合に、アプリケーションに関係するリソースに関する情報と遅延度合との相関関係に基づいて遅延の原因を特定する処理を実行させる。 In one aspect, the diagnostic program causes the computer to execute a process of acquiring a delay degree indicating an execution delay for each application and determining whether the delay degree is equal to or greater than a predetermined threshold. Then, when the diagnosis program determines that the delay level is equal to or greater than a predetermined threshold, the diagnosis program executes a process of identifying the cause of the delay based on the correlation between the information related to the resource related to the application and the delay level. Let
1つの側面では、本発明は、アプリケーションの性能低下がクラウド基盤に原因があるのかアプリケーションに原因があるのかを特定することができる。 In one aspect, the present invention can identify whether application performance degradation is caused by the cloud infrastructure or the application.
以下に、本願の開示する診断プログラム、診断方法及び診断装置の実施例を図面に基づいて詳細に説明する。なお、実施例は開示の技術を限定するものではない。 Hereinafter, embodiments of a diagnostic program, a diagnostic method, and a diagnostic device disclosed in the present application will be described in detail with reference to the drawings. The embodiments do not limit the disclosed technology.
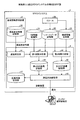
まず、実施例1に係る診断装置による遅延原因診断について説明する。図1は、実施例1に係る診断装置による遅延原因診断を説明するための図である。図1に示すように、実施例1に係る診断装置は、アプリに関係するVM(Virtual Machine:仮想マシン)のリソースデータと遅延度合との相関分析を行う(t1)。 First, delay cause diagnosis by the diagnostic apparatus according to the first embodiment will be described. FIG. 1 is a diagram for explaining delay cause diagnosis by the diagnosis apparatus according to the first embodiment. As illustrated in FIG. 1, the diagnostic apparatus according to the first embodiment performs correlation analysis between resource data of VM (Virtual Machine) related to an application and a delay degree (t1).
ここで、アプリに関係するVMは、アプリが利用するVMであり、複数ある場合がある。例えば、Webサーバ、アプリサーバ、DB(Database)サーバから成る3階層システムでは、1つのアプリに関係するVMは3つある。遅延度合は、アプリの遅延の度合である。 Here, the VM related to the application is a VM used by the application, and there may be a plurality of VMs. For example, in a three-tier system composed of a Web server, an application server, and a DB (Database) server, there are three VMs related to one application. The degree of delay is the degree of delay of the application.
リソースデータには、VMのリソース毎にリソース負荷量を表すデータとリソース性能低下の影響を受けるデータの2種類のデータがある。例えば、リソースがCPU(Central Processing Unit)の場合には、リソース負荷量を表すデータにはCPU使用率があり、リソース性能低下の影響を受けるデータにはCPUの割り当て待ち時間の割合がある。図1は、リソースがCPUの場合を示す。 The resource data includes two types of data: data representing a resource load amount for each VM resource and data affected by resource performance degradation. For example, when the resource is a CPU (Central Processing Unit), the data indicating the resource load amount has a CPU usage rate, and the data affected by the resource performance degradation has a CPU allocation waiting time ratio. FIG. 1 shows a case where the resource is a CPU.
また、リソースがディスク装置の場合には、リソース負荷量を表すデータにはRead発行数、読み込み量、Write発行数、書き込み量等があり、リソース性能低下の影響を受けるデータには平均Read時間、平均Write時間等がある。また、リソースがネットワークの場合には、リソース負荷量を表すデータにはパケット数、通信量等があり、リソース性能低下の影響を受けるデータにはラウンドトリップ時間、パケットのドロップ率等がある。 If the resource is a disk device, the data indicating the resource load amount includes the number of read issues, the amount of read, the number of write issues, the amount of write, etc. There is an average write time. When the resource is a network, the data indicating the resource load amount includes the number of packets, the communication amount, and the like, and the data affected by the resource performance degradation includes the round trip time, the packet drop rate, and the like.
実施例1に係る診断装置は、アプリに関係するVMのリソース毎に、リソース負荷量を表すデータと遅延度合との相関分析、リソース性能低下の影響を受けるデータと遅延度合との相関分析を行う。 The diagnosis apparatus according to the first embodiment performs, for each VM resource related to an application, a correlation analysis between data representing a resource load amount and a delay degree, and a correlation analysis between data affected by resource performance degradation and a delay degree. .
そして、遅延度合が、あるVMのCPUのリソースデータと相関がない場合には、実施例1に係る診断装置は、遅延とこのVMのCPUとは関係ないと診断する(t2)。また、遅延度合がCPU使用率と相関がある場合には、実施例1に係る診断装置は、アプリ要因による遅延と診断する(t3)。 When the degree of delay is not correlated with the resource data of the CPU of a certain VM, the diagnosis apparatus according to the first embodiment diagnoses that the delay is not related to the CPU of this VM (t2). When the degree of delay has a correlation with the CPU usage rate, the diagnosis apparatus according to the first embodiment diagnoses a delay due to an application factor (t3).
また、遅延度合がCPUの割り当て待ち時間の割合と相関がある場合には、実施例1に係る診断装置は、遅延度合がCPUの割り当て待ち時間の割合と相関があったVMとCPUを共有している全VMについてCPU使用率と遅延度合との相関分析を行う(t4)。ここで、遅延度合がCPUの割り当て待ち時間の割合と相関があったVMとCPUを共有している全VMには、遅延度合がCPUの割り当て待ち時間の割合と相関のあったVMも含まれる。 When the degree of delay correlates with the CPU allocation waiting time ratio, the diagnosis apparatus according to the first embodiment shares the VM and the CPU whose delay degree correlates with the CPU allocation waiting time ratio. Correlation analysis between the CPU usage rate and the delay degree is performed for all the VMs that are present (t4). Here, all VMs sharing a CPU with a VM whose delay degree is correlated with the CPU allocation waiting time ratio include VMs whose delay degree is correlated with the CPU allocation waiting time ratio. .
そして、遅延度合が他VMのCPU使用率と相関があった場合には、他VMがCPUを大量に使うことによりCPU負荷が上昇し、遅延が発生しているため、実施例1に係る診断装置は、CPU要因すなわちクラウド基盤要因による遅延と診断する(t5)。また、遅延度合がいずれのVMのCPU使用率とも相関がない場合には、実施例1に係る診断装置は、CPU負荷上昇の原因不明と診断する(t6)。また、遅延度合がCPU負荷の影響を受けているVM自体のCPU使用率と相関がある場合には、遅延しているアプリのVM自身がCPUの負荷を上昇させ遅延が発生してるため、実施例1に係る診断装置は、アプリ要因による遅延と診断する(t3)。 When the degree of delay correlates with the CPU usage rate of other VMs, the CPU load increases due to the use of a large amount of CPUs by other VMs, and a delay occurs. The apparatus diagnoses a delay due to a CPU factor, that is, a cloud infrastructure factor (t5). Further, when the delay degree has no correlation with the CPU usage rate of any VM, the diagnosis device according to the first embodiment diagnoses that the cause of the CPU load increase is unknown (t6). In addition, if the degree of delay correlates with the CPU usage rate of the VM itself that is affected by the CPU load, the VM of the delayed app itself increases the CPU load, causing a delay. The diagnostic device according to Example 1 diagnoses a delay due to an application factor (t3).
このように、実施例1に係る診断装置は、アプリに関係するVMのリソース毎に、リソース負荷量を表すデータと遅延度合との相関分析、リソース性能低下の影響を受けるデータと遅延度合との相関分析を行う。そして、遅延度合がリソース性能低下の影響を受けるデータとの相関がある場合には、実施例1に係る診断装置は、遅延度合がリソース性能低下の影響を受けるデータと相関があったVMとリソースを共有している全VMについてリソース負荷量を表すデータとの相関分析を行う。そして、実施例1に係る診断装置は、これらの相関分析の結果に基づいて、アプリの遅延原因を診断する。したがって、実施例1に係る診断装置は、アプリの性能低下がクラウド基盤に原因があるのかアプリに原因があるのかを特定することができる。 As described above, the diagnosis apparatus according to the first embodiment analyzes the correlation between the data indicating the resource load amount and the delay degree for each VM resource related to the application, and the data and the delay degree affected by the resource performance degradation. Perform correlation analysis. When there is a correlation between the delay degree and the data affected by the resource performance decrease, the diagnosis apparatus according to the first embodiment uses the VM and the resource whose delay degree is correlated with the data affected by the resource performance decrease. The correlation analysis with the data representing the resource load amount is performed for all VMs sharing the. Then, the diagnosis apparatus according to the first embodiment diagnoses the cause of the delay of the application based on the result of the correlation analysis. Therefore, the diagnosis apparatus according to the first embodiment can identify whether the performance degradation of the application is caused by the cloud platform or the application.
次に、実施例1に係るクラウドシステムの構成について説明する。図2は、実施例1に係るクラウドシステムの構成を示す図である。図2に示すように、実施例1に係るクラウドシステム1は、遅延情報作成装置2と、診断装置4と、VM情報記憶部31と、リソースデータ記憶部32と、構成情報記憶部33と、リソース34とを有する。リソース34には、CPU、ディスク装置、ネットワークスイッチが含まれる。
Next, the configuration of the cloud system according to the first embodiment will be described. FIG. 2 is a diagram illustrating the configuration of the cloud system according to the first embodiment. As illustrated in FIG. 2, the
遅延情報作成装置2は、アプリの遅延度合情報を作成し、作成した遅延度合情報を遅延度合情報記憶部30に記憶する。図3は、遅延情報作成装置2の構成を示す図である。図3に示すように、遅延情報作成装置2は、キャプチャ部21と、パケット情報記憶部22と、種別判定用データ記憶部23と、種別判定部24と、種別情報記憶部25と、応答時間算出部26と、応答時間情報記憶部27とを有する。また、遅延情報作成装置2は、正規化部28と、代表情報記憶部29と、遅延度合情報記憶部30とを有する。
The delay
キャプチャ部21は、ネットワークスイッチ3cを通過する通信パケットをポートミラーリングによりキャプチャし、キャプチャした通信パケットの情報をパケット情報記憶部22に格納する。パケット情報記憶部22は、ネットワークスイッチ3cを通過する通信パケットの情報を記憶する。 The capture unit 21 captures a communication packet passing through the network switch 3 c by port mirroring, and stores the captured communication packet information in the packet information storage unit 22. The packet information storage unit 22 stores information on communication packets that pass through the network switch 3c.
種別判定用データ記憶部23は、アプリの種別を判定するためのデータを記憶する。アプリの種別には、応答時間が性能面で重要となるアプリとその他のアプリとがある。遅延情報作成装置2は、応答時間が性能面で重要となるアプリを遅延度合情報作成の対象とする。
The type determination
種別判定部24は、種別判定用データ記憶部23が記憶するデータを用いて通信コネクション毎にアプリの種別を判定する。図4は、種別判定用データ記憶部23の一例を示す図である。図4(a)は、アプリの種別を判定するためのデータとしてポート番号のリストであるポートリストを記憶する場合を示す。図4(a)において、種別判定用データ記憶部23が記憶するポート番号は、応答時間が性能面で重要となるアプリが使用するポート番号である。例えば、種別判定用データ記憶部23は、応答時間が性能面で重要となるアプリが使用するポート番号として、「80」、「443」等を記憶する。
The
種別判定部24は、パケット情報記憶部22に記憶された通信パケットの情報を解析し、サーバ側のポート番号を抽出する。ここで、サーバとは、仮想マシンである。そして、種別判定部24は、抽出したポート番号が種別判定用データ記憶部23が記憶するポートリストに含まれる場合に、解析した通信パケットに送信又は受信するアプリを応答時間が性能面で重要となるアプリとして判定する。そして、種別判定部24は、判定結果を種別情報記憶部25に格納する。
The
また、種別判定部24は、ポート番号からアプリの種別が判定できないアプリについては、通信パターンを入力として機械学習によってアプリの種別を判定する。
Further, the
具体的には、種別判定部24は、あらかじめ、応答時間が性能面で重要となるアプリ及びその他のアプリについて、通信パケットを収集しておく。そして、種別判定部24は、収集した通信パケットを解析して一定時間間隔(例えば1分)の平均応答時間、サーバの平均通信量、サーバの平均通信回数、クライアント装置の平均通信量、及びクライアント装置の平均通信回数を計算する。
Specifically, the
そして、種別判定部24は、計算した値を学習データとして、学習器を構築する。学習器としては、SVM(Support Vector Machine)、ランダムフォレスト等が利用可能である。図4(b)は、種別判定用データ記憶部23がアプリの種別を判定するためのデータとして学習データを記憶する場合を示す。図4(b)に示すように、種別判定用データ記憶部23は、アプリの種別、平均応答時間、サーバの平均通信量、サーバの平均通信回数、クライアント装置の平均通信量、及びクライアント装置の平均通信回数を一つの学習データとして記憶する。平均応答時間の単位はマイクロ秒であり、サーバの平均通信量及びクライアント装置の平均通信量の単位はバイトである。
Then, the
図4(b)では、アプリの種別が「応答時間が性能面で重要となるアプリ」について二つの学習データが示され、アプリの種別が「その他のアプリ」について一つの学習データが示されている。アプリの種別が「応答時間が性能面で重要となるアプリ」の学習データの一つでは、平均応答時間が「600」であり、サーバの平均通信量は「100」であり、サーバの平均通信回数は「1」である。また、その学習データでは、クライアント装置の平均通信量は「100」であり、クライアント装置の平均通信回数は「1」である。 In FIG. 4B, two types of learning data are shown for the application type “application whose response time is important in terms of performance”, and one piece of learning data is shown for the application type “other apps”. Yes. In one of the learning data of the application type “application whose response time is important in terms of performance”, the average response time is “600”, the average traffic of the server is “100”, and the average communication of the server The number of times is “1”. In the learning data, the average communication amount of the client device is “100”, and the average communication count of the client device is “1”.
そして、種別判定部24は、キャプチャされた通信パケットから通信コネクション毎に学習データと同じ時間間隔の平均応答時間、サーバの平均通信量、サーバの平均通信回数、クライアント装置の平均通信量、及びクライアント装置の平均通信回数を計算する。そして、種別判定部24は、計算した値から、学習器を利用して通信コネクションに対応するアプリの種別を判定する。そして、種別判定部24は、判定結果を種別情報記憶部25に格納する。
Then, the
種別情報記憶部25は、アプリの種別の判定結果を記憶する。図5は、種別情報記憶部25の一例を示す図である。図5に示すように、種別情報記憶部25は、IPアドレス、ポート番号及び種別をアプリ毎に記憶する。IPアドレスは、アプリが稼働しているVMのIPアドレスである。ポート番号は、アプリが使用するポート番号である。種別は、アプリの種別である。例えば、IPアドレスが「10.20.30.40」であるVMで稼働するアプリは、使用するポート番号は「80」であり、「応答時間が性能面で重要となるアプリ」である。
The type
応答時間算出部26は、応答時間が性能面で重要となるアプリに関して、通信パケットを解析して応答時間を算出し、算出した応答時間を応答時間情報記憶部27に格納する。応答時間算出部26は、通信パケットが暗号化されていない場合には、プロトコルメッセージを再構築し、リクエストの時刻とレスポンスの時刻より応答時間を算出する。
The response
すなわち、応答時間算出部26は、通信パケットからプロトコルメッセージを再構成して、どの通信パケットがリクエストメッセージであり、どの通信パケットがレスポンスメッセージなのかを判定する。そして、応答時間算出部26は、リクエストメッセージが送信されてからレスポンスメッセージが返ってくるまでの時間を応答時間として算出する。
That is, the response
図6は、応答時間の算出方法を説明するための図である。図6に示すように、クライアント装置が送信したリクエストメッセージがクラウドシステム1内のVMで稼働するアプリにより処理され、レスポンスメッセージがアプリからクライアント装置に送信される。応答時間算出部26は、リクエストメッセージがキャプチャされた時刻とレスポンスメッセージがキャプチャされた時刻の間の時間を応答時間とする。
FIG. 6 is a diagram for explaining a method of calculating the response time. As illustrated in FIG. 6, the request message transmitted from the client device is processed by the application operating in the VM in the
応答時間算出部26は、通信パケットが暗号化されている場合には、通信パケットの送受のフローを解析することによって、アプリの応答時間を推定する。通信パケットが暗号化されている場合、応答時間算出部26は、通信パケットの内部が見られないためにプロトコルの解析ができないので、リクエストメッセージやレスポンスメッセージを再構成することができない。そこで、応答時間算出部26は、アプリ側から一方的にデータをリアルタイムに送信するための技術である「ロングポーリング」を考慮し、クライアント装置とクラウドシステム1上のアプリの通信パケットの時間間隔から応答時間を推定する。
When the communication packet is encrypted, the response
応答時間情報記憶部27は、応答時間算出部26によりアプリ毎に算出された応答時間を記憶する。図7は、応答時間情報記憶部27の一例を示す図である。図7に示すように、応答時間情報記憶部27は、時刻と、IPアドレスと、ポート番号と、応答時間とを対応付けて記憶する。
The response time information storage unit 27 stores the response time calculated for each application by the response
時刻は、応答時間が算出された時刻である。IPアドレスは、アプリが稼働しているVMのIPアドレスである。ポート番号は、アプリが使用するポート番号である。応答時間は、応答時間算出部26により算出された応答時間である。応答時間の単位はマイクロ秒である。例えば、IPアドレスが「10.20.30.40」であるVMで稼働し、使用するポート番号が「80」であるアプリの「2016/06/24 09:00:00」の応答時間は、「600」である。
The time is the time when the response time is calculated. The IP address is the IP address of the VM on which the application is operating. The port number is a port number used by the application. The response time is a response time calculated by the response
正規化部28は、応答時間算出部26により算出された応答時間を応答時間情報記憶部27から読み出し、アプリ毎の平均応答時間を算出する。そして、正規化部28は、代表情報記憶部29に記憶された情報を用いて平均応答時間の正規化を行い、正規化した平均応答時間を遅延度合情報として遅延度合情報記憶部30に格納する。
The
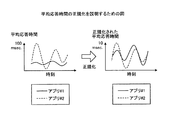
図8は、平均応答時間の正規化を説明するための図である。応答時間は、アプリによって、正常時にとりうる値や、遅延とみなす基準が異なる。このため、アプリの応答時間をそのまま用いただけでは、アプリに遅延があるのか判断することは困難である。そこで、遅延情報作成装置2は、平均応答時間を正規化して、アプリ間で比較可能な尺度に変換する。図8では、正常時にとりうる値が異なるアプリ#1とアプリ#2について、平均応答時間を正規化することによって、応答時間の比較が可能となっている。
FIG. 8 is a diagram for explaining normalization of the average response time. The response time varies depending on the application, the value that can be taken at normal times, and the standard for considering it as a delay. For this reason, it is difficult to determine whether there is a delay in the application if the response time of the application is used as it is. Therefore, the delay
正規化部28は、平均応答時間tの基本統計量trを代表応答時間として、正規化された平均応答時間tnをtn=t/trにより計算する。基本統計量には、平均、中央値、最頻値等がある。
Normalizing
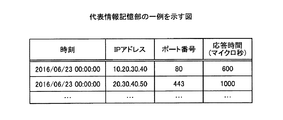
代表情報記憶部29は、代表応答時間をアプリ毎に記憶する。図9は、代表情報記憶部29の一例を示す図である。図9に示すように、代表情報記憶部29は、時刻と、IPアドレスと、ポート番号と、応答時間をアプリ毎に記憶する。
The representative
時刻は、代表応答時間が計算された時刻である。IPアドレスは、アプリが稼働しているVMのIPアドレスである。ポート番号は、アプリが使用するポート番号である。応答時間は、代表応答時間である。代表応答時間の単位はマイクロ秒である。例えば、IPアドレスが「10.20.30.40」であるVMで稼働し、使用するポート番号が「80」であるアプリの「2016/06/23 00:00:00」に計算された代表応答時間は、「600」である。 The time is the time when the representative response time is calculated. The IP address is the IP address of the VM on which the application is operating. The port number is a port number used by the application. The response time is a representative response time. The unit of typical response time is microseconds. For example, a representative that is calculated as “2016/06/23 00:00:00” of an application that operates on a VM with an IP address “10.20.30.40” and a port number to be used “80”. The response time is “600”.
正規化部28は、アプリ毎に一定時間間隔(例えば1分)毎の平均応答時間tを計算し、平均応答時間tの基本統計量trを計算する。基本統計量を計算するためのデータとしては前日の1日分のデータ等が用いられる。一定時間間隔が1分の場合は、1日分のデータから60*24=1440のサンプルデータが得られる。
Normalizing
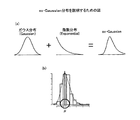
また、正規化部28は、基本統計量trの代わりに、平均応答時間の分布をex−Gaussian分布でフィッティングさせたときのμを代表応答時間としてもよい。図10は、ex−Gaussian分布を説明するための図である。ex−Gaussian分布は、確率分布の一つであり、図10(a)に示すように、ガウス分布(正規分布)と指数分布を畳込み積分したものである。ex−Gaussian分布は、正規分布の平均μ及び標準偏差σと、指数分布の平均及び標準偏差τの3つのパラメータにより決定される。ex−Gaussian分布では、μは、図10(b)に示すように、分布のピークの部分の値になる。
Further, the
正規化部28は、アプリ毎に一定時間間隔(例えば1分)毎の平均応答時間tを計算し、平均応答時間の分布をex−Gaussian分布でフィッティングする。ex−Gaussian分布へのフィッティングのためのデータとしては前日の1日分のデータ等が用いられる。一定時間間隔が1分の場合は、1日分のデータから60*24=1440のサンプルデータが得られる。
The
そして、正規化部28は、フィッティングの確からしさを一標本コルモゴロフ−スミルノフ検定で判定する。一標本コルモゴロフ−スミルノフ検定の入力は、平均応答時間の分布と、フィッティング結果の分布曲線との二つである。正規化部28は、有意水準を例えば0.05で検定し、検定した結果、平均応答時間の分布がex−Gaussian分布であった場合、ex−Gaussian分布のμを代表平均応答時間とする。
Then, the normalizing
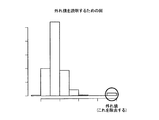
なお、正規化部28は、平均応答時間の分布をex−Gaussian分布でフィッティングする前に外れ値除去を行ってもよい。図11は、外れ値を説明するための図である。図11に示すように、外れ値は、他の値から大きく外れた値である。平均応答時間に外れ値がある場合、ex−Gaussian分布でうまくフィッティングできない場合がある。このため、正規化部28は、フィッティングの前に外れ値除去を行う。外れ値除去の方法にはTukeyの外れ値除去等がある。
Note that the
遅延度合情報記憶部30は、正規化部28により正規化された平均応答時間を遅延度合情報としてアプリ毎に記憶する。図12は、遅延度合情報記憶部30の一例を示す図である。図12に示すように、遅延度合情報記憶部30は、時刻と、IPアドレスと、ポート番号と、正規化平均応答時間と、リクエスト数とをアプリ毎に記憶する。
The delay degree
時刻は、応答時間が算出された時刻である。IPアドレスは、アプリが稼働しているVMのIPアドレスである。ポート番号は、アプリが使用するポート番号である。正規化平均応答時間は、正規化された平均応答時間である。リクエスト数は、正規化された平均応答時間の計算に用いられたリクエストの数である。 The time is the time when the response time is calculated. The IP address is the IP address of the VM on which the application is operating. The port number is a port number used by the application. The normalized average response time is the normalized average response time. The number of requests is the number of requests used to calculate the normalized average response time.
例えば、IPアドレスが「10.20.30.40」であるVMで稼働し、使用するポート番号が「80」のアプリの「2016/06/24 09:00:00」に算出された応答時間に関して正規化された平均応答時間は「1.0」である。正規化された平均応答時間の計算に用いられたリクエストの数は「2」である。 For example, the response time calculated as “2016/06/24 09:00:00” for an application that operates on a VM with an IP address of “10.20.30.40” and a port number to be used is “80” The average response time normalized with respect to is 1.0. The number of requests used to calculate the normalized average response time is “2”.
図2に戻って、診断装置4は、遅延判定部41と、第1相関分析部42と、第1分析結果記憶部43と、第2相関分析部44と、第2分析結果記憶部45と、遅延原因診断部46と、診断結果記憶部47とを有する。
Returning to FIG. 2, the
遅延判定部41は、遅延情報作成装置2から正規化応答時間を遅延度合情報として取得し、アプリに遅延が発生しているか否かを判定する。図13は、アプリの遅延判定を説明するための図である。図13に示すように、遅延判定部41は、アプリ毎に、診断対象期間のデータにおいて、遅延度合が閾値Trt以上になった回数を定期的にカウントし、回数が閾値Tdr以上の場合に、アプリが遅延していると判定する。
The
判定を実行する間隔は、例えば1日である。あるいは、遅延判定部41は、クラウド運用管理者の指示に基づいて遅延判定を行ってもよい。図13では、Trt=10、Tdr=5として、アプリ#2の遅延度合がTrt以上の回数が「5」であるので、アプリ#2に遅延が発生していると判定される。
The interval for executing the determination is, for example, one day. Alternatively, the
第1相関分析部42は、遅延判定部41により遅延が発生していると判定された各アプリについて、アプリに関係するVMのリソースデータと遅延度合との相関分析を行うことによって、遅延と関係するリソースデータを絞り込む。第1相関分析部42は、VM情報記憶部31を参照してアプリに関係するVMを特定する。
The first correlation analysis unit 42 performs a correlation analysis between the resource data of the VM related to the application and the degree of delay for each application determined to have a delay by the
図14は、VM情報記憶部31の一例を示す図である。図14に示すように、VM情報記憶部31は、変更日時、VMのIPアドレス、ポート番号、関係するVMリストを対応付けてアプリ毎に記憶する。変更日時は、対応する情報が変更された日時である。VMのIPアドレスは、アプリが動作するVMのIPアドレスである。ポート番号は、アプリが使用するポートの番号である。VMのIPアドレスとポート番号の組合せで1つのアプリが特定される。
FIG. 14 is a diagram illustrating an example of the VM
関係するVMリストは、VMのIPアドレスとポート番号で特定されるアプリに関係するVMのリストである。例えば、IPアドレス「10.20.30.40」とポート番号「80」で特定されるアプリが関係するVMは、「VM#1」と「VM#2」と「VM#3」である。
The related VM list is a list of VMs related to the application specified by the IP address and port number of the VM. For example, the VMs related to the application specified by the IP address “10.20.30.40” and the port number “80” are “
第1相関分析部42は、リソースデータ記憶部32からVMのリソースデータを取得する。図15は、リソースデータ記憶部32の一例を示す図である。図15に示すように、リソースデータ記憶部32は、時刻、VM名、リソースデータ名、値を対応付けてリソースデータ毎に記憶する。
The first correlation analysis unit 42 acquires VM resource data from the resource
時刻は、値が取得された時刻である。VM名は、リソースデータがどのVMのものであるか示す。リソースデータ名は、リソースデータを識別する名前である。値は、リソースデータの値である。例えば、「2016/06/24 09:00:00」において、「VM#1」の「CPU使用率」は「10.0」%である。
The time is the time when the value was acquired. The VM name indicates to which VM the resource data belongs. The resource data name is a name for identifying resource data. The value is a value of resource data. For example, in “2016/06/24 09:00:00”, the “CPU usage rate” of “
なお、リソースデータ記憶部32には、リソース34から取得されたデータが記憶される。また、第1相関分析部42は、アプリが関係するVMの情報が得られない場合には、アプリのユーザが利用する全VMのリソースデータとの相関分析を行う。
The resource
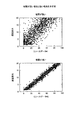
第1相関分析部42は、相関係数を利用して相関分析を行う。すなわち、第1相関分析部42は、遅延度合とリソースデータとの相関係数を計算し、遅延度合とリソースデータとの間で正の相関があるかを検定する。図16は、リソースデータと遅延度合の関係の例を示す図である。図16では、1つの時刻のリソースデータの値と遅延度合の値の組が点で表される。第1相関分析部42は、図16に示す複数の点の値を用いて相関係数を計算する。 The first correlation analysis unit 42 performs correlation analysis using the correlation coefficient. That is, the first correlation analysis unit 42 calculates a correlation coefficient between the delay degree and the resource data, and tests whether there is a positive correlation between the delay degree and the resource data. FIG. 16 is a diagram illustrating an example of a relationship between resource data and a delay degree. In FIG. 16, a set of resource data value and delay value at one time is represented by a point. The first correlation analysis unit 42 calculates a correlation coefficient using the values of a plurality of points shown in FIG.
第1相関分析部42は、相関係数として例えばピアソンの相関係数、スピアマンの順位相関係数を用いる。そして、第1相関分析部42は、無相関検定のp−valueを計算する。 The first correlation analysis unit 42 uses, for example, Pearson's correlation coefficient and Spearman's rank correlation coefficient as correlation coefficients. Then, the first correlation analysis unit 42 calculates the p-value of the decorrelation test.
第1相関分析部42は、アプリに関係するVMのリソースデータ数の回数の検定を行う。このように、複数回の検定が実行されると、本来相関がないにもかかわらず相関があると判定されるケースの数が増加する。例えば、有意水準が0.05の場合、1回の検定で、相関がないにもかかわらず、相関があると間違えて判定される確率は5%となる。この検定を3回繰り返すと、1度でも間違える可能性は1−(1−0.05)3=14%にまで増加する。 The first correlation analysis unit 42 performs a test of the number of VM resource data related to the application. As described above, when a plurality of tests are performed, the number of cases in which there is a correlation even though there is originally no correlation increases. For example, when the significance level is 0.05, the probability that the correlation is erroneously determined is 5% even though there is no correlation in one test. If this test is repeated three times, the chance of mistakes even once increases to 1- (1-0.05) 3 = 14%.
そこで、第1相関分析部42は、誤った判定を減らすために、計算したp−valueを多重検定補正によって補正する。補正方法には、例えば、Benjamini-Hochberg法がある。第1相関分析部42は、補正したp−valueが閾値以下であるリソースデータを遅延度合と相関があると判定する。閾値としては、例えば0.05が用いられる。 Therefore, the first correlation analysis unit 42 corrects the calculated p-value by multiple test correction in order to reduce erroneous determinations. As a correction method, for example, there is a Benjamini-Hochberg method. The first correlation analysis unit 42 determines that the resource data whose corrected p-value is equal to or less than the threshold has a correlation with the delay degree. For example, 0.05 is used as the threshold value.
なお、第1相関分析部42は、相関係数を用いる相関分析の代わりに、遅延しているときと遅延していないときのリソースデータの傾向に差があるか否かを判定することによって相関分析を行ってもよい。相関係数を用いる場合には、全てのデータが等価に扱われる。このため、相関しているかどうかは数が多い方のデータすなわち遅延していないデータで決まってしまう場合がある。この結果、遅延しているときにリソースデータの値が大きいものを見逃す場合がある。そこで、遅延しているときのリソースデータを分けて扱うことで、第1相関分析部42は、データ数の影響を抑えて、相関しているか否かを判断することができる。 The first correlation analysis unit 42 determines whether there is a difference in the tendency of the resource data when it is delayed and when it is not delayed, instead of the correlation analysis using the correlation coefficient. An analysis may be performed. When the correlation coefficient is used, all data are handled equivalently. For this reason, whether or not there is a correlation may be determined by the larger number of data, that is, the data that is not delayed. As a result, there may be a case where a large value of the resource data is missed when there is a delay. Thus, by separately handling resource data at the time of delay, the first correlation analysis unit 42 can determine whether or not there is a correlation while suppressing the influence of the number of data.
図17は、遅延しているときと遅延していないときのリソースデータの傾向に差があるか否かの判定による相関分析を説明するための図である。図17に示すように、第1相関分析部42は、遅延度合が閾値Trt以上のとき遅延しているとして、遅延しているときと遅延していないときで、リソースデータを分ける。そして、第1相関分析部42は、遅延しているときのリソースデータのほうが、遅延していないときよりも大きくなる傾向にあるかの検定(二群比較検定)のp−valueを計算する。検定方法には、t−検定、Wilcoxonの順位和検定、Mann-WhitneyのU検定等がある。 FIG. 17 is a diagram for explaining the correlation analysis based on whether or not there is a difference in the tendency of the resource data between when it is delayed and when it is not delayed. As illustrated in FIG. 17, the first correlation analysis unit 42 divides resource data depending on whether the delay is greater than or equal to a threshold T rt, depending on whether it is delayed or not. Then, the first correlation analysis unit 42 calculates a p-value of a test (two-group comparison test) as to whether the resource data when delayed is larger than when the resource data is not delayed. Test methods include t-test, Wilcoxon rank sum test, Mann-Whitney U test, and the like.
そして、第1相関分析部42は、計算したp−valueを多重検定補正によって補正する。補正方法には、例えば、Benjamini-Hochberg法がある。第1相関分析部42は、補正したp−valueが閾値以下であるリソースデータを遅延度合と相関があると判定する。閾値としては、例えば0.05が用いられる。 Then, the first correlation analysis unit 42 corrects the calculated p-value by multiple test correction. As a correction method, for example, there is a Benjamini-Hochberg method. The first correlation analysis unit 42 determines that the resource data whose corrected p-value is equal to or less than the threshold has a correlation with the delay degree. For example, 0.05 is used as the threshold value.
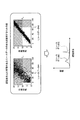
相関分析により相関があると検定された場合でも、相関の強さはデータ毎に異なる。図18Aは、相関が弱い場合と強い場合を示す図である。図18Aに示すように、リソースデータ#1は遅延度合との相関が弱いが、リソースデータ#2は遅延度合との相関が強い。そこで、第1相関分析部42は、アプリの遅延原因のリソース候補を減らすために、相関があるリソースデータのうち、遅延度合とよく相関のあるリソースデータだけを抽出する。
Even if the correlation analysis tests that there is a correlation, the strength of the correlation varies from data to data. FIG. 18A is a diagram illustrating a case where the correlation is weak and a case where the correlation is strong. As shown in FIG. 18A,
図18Bは、遅延度合とよく相関のあるリソースデータの抽出を説明するための図である。図18Bに示すように、第1相関分析部42は、遅延しているときのデータを利用し、遅延しているときのリソースデータの値を推定する。そして、第1相関分析部42は、推定値よりもリソースデータが大きいときの遅延度合の分布を2つのリソースデータについて比較し、リソースデータが大きいときによく遅延しているリソースデータを特定する。図18Bでは、リソースデータ#2が遅延度合とよく相関のあるリソースデータとして抽出される。
FIG. 18B is a diagram for describing extraction of resource data that is well correlated with the degree of delay. As illustrated in FIG. 18B, the first correlation analysis unit 42 uses the data at the time of delay and estimates the value of the resource data at the time of delay. Then, the first correlation analysis unit 42 compares the distribution of the degree of delay when the resource data is larger than the estimated value for the two resource data, and identifies resource data that is often delayed when the resource data is large. In FIG. 18B,
具体的には、第1相関分析部42は、遅延度合と相関のあったリソースデータ毎に以下の手順(1)、(2)を実行する。
(1)第1相関分析部42は、遅延度合が閾値Trt以上のリソースデータの中央値を計算し、Trとする(左斜線網掛けのデータを利用)。
(2)そして、第1相関分析部42は、リソースデータがTr以上の時の遅延度合のデータを抽出する(右斜線網掛けのデータを抽出)。
Specifically, the first correlation analysis unit 42 executes the following procedures (1) and (2) for each resource data correlated with the delay degree.
(1) The first correlation analysis unit 42 calculates the median value of the resource data having a delay degree equal to or greater than the threshold value T rt and sets it as T r (uses the data hatched with left diagonal lines).
(2) Then, the first correlation analysis unit 42 extracts data on the degree of delay when the resource data is equal to or greater than T r (extracts data hatched with right diagonal lines).
そして、第1相関分析部42は、抽出された遅延度合のデータをSteel Dwass法で検定し、2つのリソースデータの遅延度合の分布に差があると出た回数の最も多いリソースデータを特定する。検定の有意水準には、例えば0.05が用いられる。そして、第1相関分析部42は、差があるとされた回数が最も多いリソースデータと、そのリソースデータとの差がないとされるリソースデータを遅延度合とよく相関があるリソースデータとする。 Then, the first correlation analysis unit 42 tests the extracted delay degree data by the Steel Dwass method, and specifies the resource data having the highest number of times when there is a difference in the distribution of the delay degree between the two resource data. . For example, 0.05 is used as the significance level of the test. Then, the first correlation analysis unit 42 sets the resource data having the largest number of times that there is a difference and the resource data that has no difference between the resource data as resource data having a good correlation with the delay degree.
第1相関分析部42は、相関分析の結果を第1分析結果記憶部43に格納する。図19は、第1分析結果記憶部43の一例を示す図である。図19に示すように、第1分析結果記憶部43は、診断日時、開始時間、終了時間、VMのIPアドレス、ポート番号、VM名、リソース種類、リソースデータ名を対応付けて記憶する。
The first correlation analysis unit 42 stores the correlation analysis result in the first analysis
診断日時は、診断を行った日時である。開始時間は、診断対象期間の開始時間である。終了時間は、診断対象期間の終了時間である。VMのIPアドレスは、アプリが動作するVMのIPアドレスである。ポート番号は、アプリが使用するポートの番号である。VM名は、リソースデータがどのVMのものであるか示す。リソース種類は、遅延に関係のあるリソース34の種類であり、「CPU」、「ディスク装置」、「ネットワーク」等がある。リソースデータ名は、遅延度合と相関のあったリソースデータを識別する名前である。 The diagnosis date and time is the date and time when diagnosis was performed. The start time is the start time of the diagnosis target period. The end time is the end time of the diagnosis target period. The VM IP address is the IP address of the VM on which the application operates. The port number is a port number used by the application. The VM name indicates to which VM the resource data belongs. The resource type is a type of the resource 34 related to delay, and includes “CPU”, “disk device”, “network”, and the like. The resource data name is a name for identifying resource data correlated with the delay degree.
例えば、「2016/05/24 00:00:00」〜「2016/06/24 00:00:00」を診断対象期間として「2016/06/24 00:00:00」に行った診断において、アプリの遅延度合と相関のあるリソースデータがあった。アプリは、VMのIPアドレス「10.20.30.40」とポート番号「80」で特定され、「VM#3」の「CPUの割り当て待ち時間の割合」とアプリの遅延度合との間に相関があった。
For example, in a diagnosis performed from “2016/06/24 00:00:00” to “2016/06/24 00:00:00” as a diagnosis target period at “2016/06/24 00:00:00” There was resource data correlated with the degree of delay of the app. The application is specified by the IP address “10.20.30.40” of the VM and the port number “80”, and between the “ratio of CPU allocation waiting time” of “
第2相関分析部44は、リソース性能低下の影響を受けるデータと遅延度合の相関があった場合に、リソース性能低下の影響を受けるデータの相関があったVMとリソース34を共有している全VMについてリソース負荷量を表すデータと遅延度合との相関分析を行う。 When there is a correlation between the data affected by the resource performance degradation and the delay degree, the second correlation analysis unit 44 shares all the resources 34 and the VMs that are correlated with the data affected by the resource performance degradation. A correlation analysis is performed between the data indicating the resource load amount and the delay degree for the VM.
第2相関分析部44は、リソースデータ記憶部32と、クラウドシステム1の構成情報を記憶する構成情報記憶部33とを参照して相関分析を行う。図20は、構成情報記憶部33の一例を示す図である。図20に示すように、構成情報記憶部33は、変更日時、物理マシン、利用ユーザ、VM名、VMのIPアドレス、利用ディスク名を対応付けてVM毎に記憶する。
The second correlation analysis unit 44 performs correlation analysis with reference to the resource
変更日時は、対応する情報が変更された日時である。物理マシンは、VMが動作する物理マシンである。利用ユーザは、VMを利用するユーザである。VM名は、VMを識別する名前である。VMのIPアドレスは、VMに付与されたIPアドレスである。利用ディスク名は、VMが利用するディスク装置の名前である。例えば、「VM#1」は「PM#1」で動作して「ディスク#1」を利用し、「VM#1」のユーザは「ユーザ#1」であり、「VM#1」のIPアドレスは「10.20.30.40」である。「VM#1」の情報は「2016/06/24 00:00:00」に変更された。
The change date is the date when the corresponding information was changed. A physical machine is a physical machine on which a VM operates. The user is a user who uses the VM. The VM name is a name for identifying the VM. The VM IP address is an IP address assigned to the VM. The used disk name is a name of a disk device used by the VM. For example, “
図21は、第2相関分析部44による相関分析を説明するための図である。リソース性能低下の影響を受けるデータと遅延度合の相関があった場合、リソース34の性能低下の影響を受けてアプリが遅延したと考えられる。このため、第2相関分析部44は、リソース性能低下の影響を受けるデータの相関があったVMとリソース34を共有する全VM(リソース性能低下の影響を受けるデータの相関があったVM自体を含む)を構成情報記憶部33を参照して特定する。図21では、ユーザ#1のVMがリソース性能低下の影響を受けるデータの相関がアプリ#1の遅延度合とあったVMである。また、リソース性能低下の影響を受けるデータの相関があったVMとリソース34を共有する他のVMとしてユーザ#2のVMが特定される。
FIG. 21 is a diagram for explaining correlation analysis by the second correlation analysis unit 44. If there is a correlation between the data affected by the resource performance degradation and the delay degree, it is considered that the application is delayed due to the performance degradation of the resource 34. For this reason, the second correlation analysis unit 44 identifies all VMs that share resources 34 and VMs that have been correlated with data affected by resource performance degradation (the VMs that have been correlated with data affected by resource performance degradations). Are included) with reference to the configuration
そして、第2相関分析部44は、特定した各VMのリソース負荷量を表すデータと遅延度合との相関分析をリソースデータ記憶部32を参照して行うことで、特定したVMの中から負荷をかけているVMを特定する。リソース負荷量を表すデータと遅延度合との相関があるVMが負荷をかけているVMである。図21では、ユーザ#2のVMのCPU使用率とアプリ#1の遅延度合との相関が分析される。
Then, the second correlation analysis unit 44 performs a correlation analysis between the data indicating the resource load amount of each specified VM and the delay degree with reference to the resource
そして、第2相関分析部44は、相関分析により相関のあったリソースデータのうち、遅延度合とよく相関のあるリソースデータを抽出する。そして、第2相関分析部44は、抽出したリソースデータについて、相関分析の結果を第2分析結果記憶部45に格納する。 Then, the second correlation analysis unit 44 extracts resource data having a good correlation with the delay degree from the resource data correlated by the correlation analysis. Then, the second correlation analysis unit 44 stores the correlation analysis result in the second analysis result storage unit 45 for the extracted resource data.
図22は、第2分析結果記憶部45の一例を示す図である。図22に示すように、第2分析結果記憶部45は、診断日時、開始時間、終了時間、VMのIPアドレス、ポート番号、アプリVM、リソース種類、相関VM、リソース負荷量データを対応付けて記憶する。 FIG. 22 is a diagram illustrating an example of the second analysis result storage unit 45. As illustrated in FIG. 22, the second analysis result storage unit 45 associates diagnosis date and time, start time, end time, VM IP address, port number, application VM, resource type, correlation VM, and resource load data. Remember.
診断日時は、診断を行った日時である。開始時間は、診断対象期間の開始時間である。終了時間は、診断対象期間の終了時間である。VMのIPアドレスは、アプリが動作するVMのIPアドレスである。ポート番号は、アプリが使用するポートの番号である。アプリVMは、リソース性能低下の影響を受けているデータと遅延度合の相関があったアプリが動作するVMである。リソース種類は、遅延に関係のあるリソース34の種類である。相関VMは、リソース負荷量を表すデータと遅延度合との相関があったVMである。リソース負荷量データは、遅延度合と相関のあったリソース負荷量を表すデータである。 The diagnosis date and time is the date and time when diagnosis was performed. The start time is the start time of the diagnosis target period. The end time is the end time of the diagnosis target period. The VM IP address is the IP address of the VM on which the application operates. The port number is a port number used by the application. The application VM is a VM on which an application having a correlation between the degree of delay and the data affected by the resource performance degradation operates. The resource type is a type of the resource 34 related to delay. The correlation VM is a VM in which there is a correlation between the data indicating the resource load amount and the delay degree. The resource load amount data is data representing the resource load amount correlated with the delay degree.
例えば、「2016/05/24 00:00:00」〜「2016/06/24 00:00:00」を診断対象期間として「2016/06/24 00:00:00」に診断が行われた。遅延が発生したアプリは、VMのIPアドレス「10.20.30.40」とポート番号「80」で特定され、「VM#3」で動作する。影響を受けているリソース34の種類は「CPU」であり、「VM#3」と「CPU」を共有する「VM#4」の「CPU使用率」が遅延度合と相関があった。
For example, “2016/06/24 00:00:00” to “2016/06/24 00:00:00” was diagnosed at “2016/06/24 00:00:00” as a diagnosis target period. . The application in which the delay has occurred is specified by the VM IP address “10.20.30.40” and the port number “80”, and operates with “
遅延原因診断部46は、第1分析結果記憶部43と第2分析結果記憶部45を参照してVMのリソースデータの種類毎にアプリの遅延原因を判定する。具体的には、遅延原因診断部46は、アプリに関係するVMのリソース負荷量を表すデータとの相関があった場合は、常に時間のかかるリクエストを処理したことにより、平均応答時間が増加し、遅延しているので、「アプリの要因による遅延」と判定する。
The delay cause diagnosis unit 46 refers to the first analysis
また、遅延原因診断部46は、アプリに関係するVMのリソース性能低下の影響を受けるデータとの相関があった場合は、以下の3つの場合に分けて判定する。第1に、同じVMのリソース負荷量を表すデータとも相関がある場合は、遅延しているアプリのVM自身がリソース34への負荷が上昇させ、遅延が発生しているので、遅延原因診断部46は、「アプリの要因による遅延」と判定する。第2に、リソース34を共有している他VMのリソース負荷量を表すデータと相関がある場合は、他VMがリソース34を大量に使ったことによりリソース負荷が上昇し、遅延が発生しているので、遅延原因診断部46は、「クラウド基盤要因による遅延」と判定する。第3に、リソース34を共有しているVMのリソース負荷量を表すデータと相関がなかった場合は、遅延原因診断部46は、「リソース負荷上昇の原因不明」と判定する。 In addition, when there is a correlation with the data affected by the VM resource performance degradation related to the application, the delay cause diagnosis unit 46 determines in the following three cases. First, when there is a correlation with the data representing the resource load amount of the same VM, the VM itself of the delayed application increases the load on the resource 34 and a delay occurs, so the delay cause diagnosis unit No. 46 is determined as “delay due to application factors”. Second, if there is a correlation with the data representing the resource load amount of another VM sharing the resource 34, the resource load increases due to the large amount of the resource 34 used by the other VM, and a delay occurs. Therefore, the delay cause diagnosis unit 46 determines “delay due to cloud base factor”. Third, if there is no correlation with the data representing the resource load amount of the VM sharing the resource 34, the delay cause diagnosis unit 46 determines that “the cause of the resource load increase is unknown”.
相関のあったリソース34が複数ある場合は、遅延原因診断部46は、遅延原因を複数出力する。また、遅延原因診断部46は、全てのVMで相関のあったリソースデータがない場合、もしくは逆に多い場合(遅延原因の数が閾値Td以上の場合)、原因を特定できなかったと判定する。 When there are a plurality of correlated resources 34, the delay cause diagnosis unit 46 outputs a plurality of delay causes. Further, the delay cause diagnosis unit 46 determines that the cause could not be specified when there is no correlated resource data in all VMs or when there is a large amount of data (when the number of delay causes is equal to or greater than the threshold Td ). .
そして、遅延原因診断部46は、判定結果を診断結果記憶部47に格納する。図23は、診断結果記憶部47の一例を示す図である。図23に示すように、診断結果記憶部47は、診断日時、開始時間、終了時間、VMのIPアドレス、ポート番号、遅延割合、アプリVM、リソース種類、リソースデータ、負荷VM、リソース負荷量データ、診断結果を対応付けて記憶する。
Then, the delay cause diagnosis unit 46 stores the determination result in the diagnosis
診断日時は、診断を行った日時である。開始時間は、診断対象期間の開始時間である。終了時間は、診断対象期間の終了時間である。VMのIPアドレスは、アプリが動作するVMのIPアドレスである。ポート番号は、アプリが使用するポートの番号である。遅延割合は、遅延が発生している合計時間の割合である。アプリVMは、相関のあったアプリが動作するVMである。リソース種類は、遅延に関係のあるリソース34の種類である。リソースデータは、相関のあったアプリのVMのリソースデータである。負荷VMは、リソース34を共有していて負荷をかけているVMである。リソース負荷量データは、リソース34を共有していて負荷をかけているVMの相関のあったリソース負荷量データである。診断結果は、遅延原因診断部46による判定結果である。 The diagnosis date and time is the date and time when diagnosis was performed. The start time is the start time of the diagnosis target period. The end time is the end time of the diagnosis target period. The VM IP address is the IP address of the VM on which the application operates. The port number is a port number used by the application. The delay ratio is a ratio of the total time in which the delay occurs. The application VM is a VM on which a correlated application operates. The resource type is a type of the resource 34 related to delay. The resource data is the VM resource data of the correlated application. The load VM is a VM sharing the resource 34 and applying a load. The resource load amount data is resource load amount data having a correlation between VMs sharing the resource 34 and applying a load. The diagnosis result is a determination result by the delay cause diagnosis unit 46.
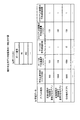
例えば、「2016/05/24 00:00:00」〜「2016/06/24 00:00:00」を診断対象期間として「2016/06/24 00:00:00」に診断が行われた。合計時間で「0.10」の割合で遅延が発生したアプリは、VMのIPアドレス「10.20.30.40」とポート番号「80」で特定され、「VM#3」で動作する。遅延に関係のあるリソース34の種類は「CPU」である。「CPUの割り当て待ち時間の割合」が遅延度合と相関があり、「VM#3」と「CPU」を共有する「VM#4」の「CPU使用率」が遅延度合と相関のあったリソース負荷量データであり、遅延原因は「クラウド基盤要因」である。
For example, “2016/06/24 00:00:00” to “2016/06/24 00:00:00” was diagnosed at “2016/06/24 00:00:00” as a diagnosis target period. . The application in which the delay has occurred at a rate of “0.10” in the total time is specified by the VM IP address “10.20.30.40” and the port number “80”, and operates with “
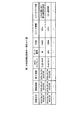
また、遅延原因診断部46は、アプリの遅延要因として「クラウド基盤要因」が含まれている場合、遅延していたアプリ、アプリの遅延要因、遅延と関係するVMのリソース34等をクラウド運用管理者に通知する。図24は、クラウド運用管理者への通知例を示す図である。図24では、Webサーバ、アプリサーバ、DBサーバから成る3階層システムのDBサーバが他アプリのVMのCPU負荷の影響を受けている場合を示す。 In addition, when the “cloud base factor” is included as the delay factor of the application, the delay cause diagnosis unit 46 manages the operation of the delayed application, the delay factor of the application, the VM resource 34 related to the delay, and the like. The person in charge. FIG. 24 is a diagram illustrating an example of notification to the cloud operation manager. FIG. 24 shows a case where the DB server of the three-tier system including the Web server, the application server, and the DB server is affected by the VM CPU load of another application.
図24に示すように、アプリケーション、診断対象期間、遅延が発生している合計時間の割合、遅延原因、リソース負荷の影響を受けているアプリケーションのVMとリソース34、リソース負荷を与えているVMとリソース34がクラウド運用管理者に通知される。 As shown in FIG. 24, the application, the diagnosis target period, the ratio of the total time during which the delay occurs, the cause of the delay, the VM and the resource 34 of the application affected by the resource load, and the VM giving the resource load The resource 34 is notified to the cloud operation manager.
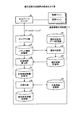
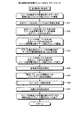
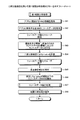
次に、診断装置4による処理のフローについて図25〜図31を用いて説明する。図25は、診断装置4による処理のフローを示すフローチャートである。図25に示すように、診断装置4は、アプリ数だけステップS1〜ステップS5の処理を繰り返す。すなわち、診断装置4は、アプリの診断対象期間の遅延度合情報を取得する(ステップS1)。
Next, the flow of processing by the
そして、診断装置4は、遅延度合が閾値Trt以上の回数がTdr以上か否かを判定し(ステップS2)、Tdr以上でない場合には、次のアプリを処理する。一方、Tdr以上である場合には、診断装置4は、第1相関分析処理を行う(ステップS3)。ここで、第1相関分析処理は、第1相関分析部42が行う処理である。
The
そして、診断装置4は、第2相関分析処理を行う(ステップS4)。ここで、第2相関分析処理は、第2相関分析部44が行う処理である。なお、ステップS4の処理は、リソース性能低下の影響を受けるデータと遅延度合との相関があった場合に行われる。そして、診断装置4は、遅延原因診断処理を行う(ステップS5)。ここで、遅延原因診断処理は、遅延原因診断部46が行う処理である。
And the
そして、アプリ数だけステップS1〜ステップS5の処理を繰り返すと、診断装置4は、クラウド基盤要因により応答遅延が発生と診断されたアプリがあるか否かを判定し(ステップS6)、ある場合には、クラウド運用管理者に通知する(ステップS7)。
Then, when the processes of step S1 to step S5 are repeated for the number of applications, the
このように、クラウド基盤要因により応答遅延が発生と診断されたアプリがある場合に診断装置4がクラウド運用管理者に通知することで、クラウド運用管理者はクラウド基盤に関して対策を検討することができる。
As described above, when there is an application diagnosed as having a response delay due to a cloud platform factor, the
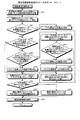
図26は、第1相関分析処理のフローを示すフローチャ−トである。図26に示すように、第1相関分析部42は、VM情報記憶部31からアプリに関係するVMの情報を取得し(ステップS11)、リソースデータ記憶部32からアプリに関係する全VMのリソースデータを取得する(ステップS12)。
FIG. 26 is a flowchart showing the flow of the first correlation analysis process. As illustrated in FIG. 26, the first correlation analysis unit 42 acquires VM information related to the application from the VM information storage unit 31 (step S11), and the resources of all VMs related to the application from the resource
そして、第1相関分析部42は、アプリの遅延度合とリソースデータとの無相関検定のp−valueを計算する(ステップS13)処理をリソースデータ数だけ繰り返す。そして、第1相関分析部42は、多重検定補正を実行し(ステップS14)、多重検定補正により補正したp−valueが閾値以下のリソースデータのみを抽出する(ステップS15)。 Then, the first correlation analysis unit 42 repeats the process of calculating the p-value of the decorrelation test between the degree of delay of the application and the resource data (step S13) by the number of resource data. Then, the first correlation analysis unit 42 executes multiple test correction (step S14), and extracts only resource data whose p-value corrected by the multiple test correction is equal to or less than a threshold value (step S15).
そして、第1相関分析部42は、抽出したリソースデータから、遅延度合とよく相関しているリソースデータを抽出するリソースデータ抽出処理を行う(ステップS16)。そして、第1相関分析部42は、第1分析結果記憶部43に相関分析結果を保存する(ステップS17)。 Then, the first correlation analysis unit 42 performs resource data extraction processing for extracting resource data that is well correlated with the degree of delay from the extracted resource data (step S16). And the 1st correlation analysis part 42 preserve | saves a correlation analysis result in the 1st analysis result memory | storage part 43 (step S17).
このように、第1相関分析部42は、アプリの遅延度合とリソースデータとの無相関検定のp−valueを計算し、多重検定補正によりp−valueを補正し、補正したp−valueが閾値以下のリソースデータのみを抽出する。そして、第1相関分析部42は、抽出したリソースデータから、さらに、遅延度合とよく相関しているリソースデータを抽出する。したがって、遅延度合と相関のあるリソースデータを正確に抽出することができる。 In this way, the first correlation analysis unit 42 calculates the p-value of the non-correlation test between the delay degree of the application and the resource data, corrects the p-value by multiple test correction, and the corrected p-value is the threshold value. Extract only the following resource data. Then, the first correlation analysis unit 42 further extracts resource data that correlates well with the degree of delay from the extracted resource data. Therefore, it is possible to accurately extract resource data having a correlation with the delay degree.
図27は、リソースデータ抽出処理のフローを示すフローチャ−トである。図27に示すように、第1相関分析部42は、相関のあるリソースデータ数だけステップS21〜ステップS22の処理を繰り返す。すなわち、第1相関分析部42は、遅延度合が閾値Trt以上のときのリソースデータの中央値を計算し閾値Trとし(ステップS21)、リソースデータが閾値Tr以上のときの遅延度合のデータを抽出する(ステップS22)。 FIG. 27 is a flowchart showing a flow of resource data extraction processing. As shown in FIG. 27, the first correlation analysis unit 42 repeats the processing from step S21 to step S22 for the number of correlated resource data. That is, the first correlation analysis unit 42 calculates the median value of the resource data when the delay degree is equal to or greater than the threshold value T rt and sets it as the threshold value Tr (step S21), and determines the delay degree when the resource data is equal to or greater than the threshold value Tr . Data is extracted (step S22).
そして、第1相関分析部42は、リソースデータ毎に抽出された遅延度合を入力として多重比較検定を行う(ステップS23)。そして、第1相関分析部42は、検定の結果、他のリソースデータの遅延度合の分布よりも大きくなる傾向にあるとなった回数が最も多いリソースデータを特定する(ステップS24)。 Then, the first correlation analysis unit 42 performs a multiple comparison test with the delay degree extracted for each resource data as an input (step S23). Then, the first correlation analysis unit 42 identifies the resource data having the largest number of times that tends to become larger than the distribution of the delay degree of the other resource data as a result of the test (step S24).
そして、第1相関分析部42は、抽出された遅延度合の分布において、特定されたリソースデータのものと差がないと判定されたリソースデータと、特定されたリソースデータを遅延度合とよく相関があるリソースデータとして出力する(ステップS25)。 Then, the first correlation analysis unit 42 correlates the resource data determined not to be different from that of the specified resource data in the extracted distribution of delay degrees and the specified resource data with a good degree of delay. Output as certain resource data (step S25).
このように、リソースデータ抽出処理により遅延度合とよく相関があるリソースデータを抽出することで、第1相関分析部42は、遅延度合と相関が強いリソースデータだけを抽出することができる。なお、リソースデータ抽出処理は、後述するように第2相関分析部44により呼び出された場合には、第2相関分析部44が行う。 As described above, by extracting resource data having a good correlation with the delay degree by the resource data extraction process, the first correlation analysis unit 42 can extract only resource data having a strong correlation with the delay degree. The resource data extraction process is performed by the second correlation analysis unit 44 when called by the second correlation analysis unit 44 as described later.
図28は、第2相関分析処理のフローを示すフローチャ−トである。図28に示すように、第2相関分析部44は、リソース性能低下の影響を受けるデータの相関のあったリソース数だけステップS31〜ステップS37の処理を繰り返す。 FIG. 28 is a flowchart showing the flow of the second correlation analysis process. As illustrated in FIG. 28, the second correlation analysis unit 44 repeats the processes in steps S <b> 31 to S <b> 37 as many times as there are resources correlated with the data affected by the resource performance degradation.
すなわち、第2相関分析部44は、注目リソースを共有しているVMの情報を取得する(ステップS31)。ここで、注目リソースとは、ステップS31〜ステップS37の1回の処理の対象となるリソース34である。そして、第2相関分析部44は、注目リソースを共有している全VMのリソース負荷量を表すデータを取得する(ステップS32)。全VMには、注目リソースのVMも含まれる。 That is, the second correlation analysis unit 44 acquires information on VMs that share the resource of interest (step S31). Here, the resource of interest is the resource 34 that is the target of one process from step S31 to step S37. Then, the second correlation analysis unit 44 acquires data representing the resource load amounts of all VMs sharing the target resource (step S32). All VMs include the VM of the resource of interest.
そして、第2相関分析部44は、アプリの遅延度合とリソース負荷量を表すデータとの無相関検定のp−valueを計算する処理(ステップS33)をリソース34を共有している全VMのリソース負荷量を表すデータ数だけ繰り返す。そして、第2相関分析部44は、多重検定補正を実行し(ステップS34)、多重検定補正により補正したp−valueが閾値以下のリソースデータのみを抽出する(ステップS35)。そして、第2相関分析部44は、リソースデータ抽出処理を行い(ステップS36)、第2分析結果記憶部45に相関分析結果を保存する(ステップS37)。 Then, the second correlation analysis unit 44 performs a process (step S33) of calculating the p-value of the decorrelation test between the delay degree of the application and the data indicating the resource load amount in all VM resources sharing the resource 34. Repeat for the number of data representing the load. Then, the second correlation analysis unit 44 performs multiple test correction (step S34), and extracts only resource data whose p-value corrected by the multiple test correction is equal to or less than a threshold value (step S35). Then, the second correlation analysis unit 44 performs resource data extraction processing (step S36), and stores the correlation analysis result in the second analysis result storage unit 45 (step S37).
このように、第2相関分析部44は、リソース性能低下の影響を受けるデータの相関のあった各リソース34について、リソース34を共有する全VMのリソース負荷量を表すデータとの無相関検定のp−valueを計算する。そして、第2相関分析部44は、多重検定補正によりp−valueを補正し、補正したp−valueが閾値以下のリソースデータのみを抽出する。そして、第2相関分析部44は、抽出したリソースデータから、さらに、遅延度合とよく相関しているリソースデータを抽出する。したがって、第2相関分析部44は、リソース性能低下の影響を受けるデータの相関のあった各リソース34について、リソース34を共有する全VMのリソース負荷量を表すデータの遅延度合との相関分析を正確に行うことができる。 As described above, the second correlation analysis unit 44 performs an uncorrelation test on each resource 34 correlated with data affected by resource performance degradation with data representing the resource load amount of all VMs sharing the resource 34. p-value is calculated. Then, the second correlation analysis unit 44 corrects the p-value by multiple test correction, and extracts only the resource data whose corrected p-value is equal to or less than the threshold value. Then, the second correlation analysis unit 44 further extracts resource data that correlates well with the degree of delay from the extracted resource data. Therefore, the second correlation analysis unit 44 performs a correlation analysis with respect to the delay degree of the data representing the resource load amount of all VMs sharing the resource 34 for each resource 34 having the correlation of the data affected by the resource performance degradation. Can be done accurately.
図29は、遅延原因診断処理のフローを示すフローチャ−トである。図29に示すように、遅延原因診断部46は、遅延度合が閾値Trt以上の回数から遅延していた合計時間の割合を計算する(ステップS41)。そして、遅延原因診断部46は、相関のあるリソースデータを持つアプリのVM数だけステップS42〜ステップS49の処理を繰り返す。 FIG. 29 is a flowchart showing a flow of delay cause diagnosis processing. As illustrated in FIG. 29, the delay cause diagnosis unit 46 calculates the ratio of the total time that has been delayed from the number of times that the degree of delay is equal to or greater than the threshold value Trt (step S41). Then, the delay cause diagnosis unit 46 repeats the processing from step S42 to step S49 for the number of VMs of the application having correlated resource data.
すなわち、遅延原因診断部46は、注目VMのリソース負荷量を表すデータとの相関があるか否かを判定する(ステップS42)。ここで、注目VMとは、ステップS42〜ステップS49の1回の処理の対象となるVMである。そして、遅延原因診断部46は、注目VMのリソース負荷量を表すデータとの相関がある場合には、アプリ要因による遅延と判定し(ステップS43)、次のVMの処理に進む。 That is, the delay cause diagnosis unit 46 determines whether or not there is a correlation with data representing the resource load amount of the target VM (step S42). Here, the attention VM is a VM that is a target of one processing of Step S42 to Step S49. If there is a correlation with the data representing the resource load amount of the target VM, the delay cause diagnosis unit 46 determines that the delay is due to the application factor (step S43), and proceeds to the next VM process.
一方、注目VMのリソース負荷量を表すデータとの相関がない場合には、遅延原因診断部46は、注目VMのリソース性能低下の影響を受けるデータとの相関があるか否かを判定し(ステップS44)、否の場合には次のVMの処理に進む。一方、注目VMのリソース性能低下の影響を受けるデータとの相関がある場合には、遅延原因診断部46は、リソース34を共有している全VMについてリソース負荷量を表すデータとの相関があるか否かを判定する(ステップS45)。そして、遅延原因診断部46は、リソース負荷量を表すデータと遅延度合との相関があるVMが1つもない場合には、リソース負荷上昇の原因不明と判定し(ステップS46)、次のVMの処理に進む。 On the other hand, if there is no correlation with the data representing the resource load amount of the target VM, the delay cause diagnosis unit 46 determines whether there is a correlation with the data affected by the resource performance degradation of the target VM ( In step S44), if not, the process proceeds to the next VM. On the other hand, when there is a correlation with the data affected by the resource performance degradation of the target VM, the delay cause diagnosis unit 46 has a correlation with the data representing the resource load amount for all the VMs sharing the resource 34. Whether or not (step S45). The delay cause diagnosis unit 46 determines that the cause of the increase in resource load is unknown when there is no VM that correlates the data indicating the resource load amount and the delay degree (step S46). Proceed to processing.
また、遅延原因診断部46は、リソース負荷量を表すデータと遅延度合との相関がある各VMについて、ステップS47〜ステップS49の処理を行う。すなわち、遅延原因診断部46は、相関のあるリソース性能低下の影響を受けるデータとリソース負荷量を表すデータが同じVMのものか否かを判定する(ステップS47)。 In addition, the delay cause diagnosis unit 46 performs the processing from step S47 to step S49 for each VM having a correlation between the data indicating the resource load amount and the delay degree. That is, the delay cause diagnosis unit 46 determines whether the data affected by the correlated resource performance degradation and the data representing the resource load amount are the same VM (step S47).
そして、相関のあるリソース性能低下の影響を受けるデータとリソース負荷量を表すデータが同じVMのものである場合には、遅延原因診断部46は、アプリ要因による遅延と判定し(ステップS48)、次のVMの処理に進む。一方、相関のあるリソース性能低下の影響を受けるデータとリソース負荷量を表すデータが同じVMのものでない場合には、遅延原因診断部46は、クラウド基盤要因による遅延と判定し(ステップS49)、次のVMの処理に進む。 If the data affected by the correlated resource performance degradation and the data representing the resource load amount are the same VM, the delay cause diagnosis unit 46 determines that the delay is caused by the application factor (step S48). The process proceeds to the next VM. On the other hand, if the data affected by the correlated resource performance degradation and the data representing the resource load amount are not the same VM, the delay cause diagnosis unit 46 determines that the delay is caused by the cloud base factor (step S49). The process proceeds to the next VM.
そして、ステップS42〜ステップS49の繰り返し処理を完了すると、遅延原因診断部46は、判定結果の数が1以上かつ閾値Td以下か否かを判定する(ステップS50)。そして、判定結果の数が1以上かつ閾値Td以下である場合には、遅延原因診断部46は、遅延と関係するリソース34を特定できたとして判定結果を出力する(ステップS51)。一方、判定結果の数が1以上かつ閾値Td以下ではない場合には、遅延原因診断部46は、遅延と関係するリソース34を特定できなかったとする(ステップS52)。 When the repetition processing of step S42 to step S49 is completed, the delay cause diagnosis unit 46 determines whether the number of determination results is 1 or more and the threshold Td or less (step S50). If the number of determination results is 1 or more and the threshold value Td or less, the delay cause diagnosis unit 46 outputs the determination result assuming that the resource 34 related to the delay has been identified (step S51). On the other hand, when the number of determination results is not less than 1 and not less than the threshold value Td, it is assumed that the delay cause diagnosis unit 46 cannot identify the resource 34 related to the delay (step S52).
そして、遅延原因診断部46は、遅延診断結果を保存する(ステップS53)。このように、遅延原因診断部46が、第1相関分析部42及び第2相関分析部44による分析結果に基づいて遅延の原因を特定することで、診断装置4は、クラウド基盤に問題がある場合に、問題のあるリソース34を特定することができる。
Then, the delay cause diagnosis unit 46 stores the delay diagnosis result (step S53). As described above, the delay cause diagnosis unit 46 identifies the cause of the delay based on the analysis results obtained by the first correlation analysis unit 42 and the second correlation analysis unit 44, so that the
次に、二群比較検定を用いて相関分析を行う場合の第1相関分析処理及び第2相関分析処理のフローについて図30及び図31を用いて説明する。図30は、二群比較検定を用いる第1相関分析処理のフローを示すフローチャートである。 Next, the flow of the first correlation analysis process and the second correlation analysis process when performing correlation analysis using the two-group comparison test will be described with reference to FIGS. 30 and 31. FIG. FIG. 30 is a flowchart showing the flow of the first correlation analysis process using the two-group comparison test.
図30に示すように、第1相関分析部42は、VM情報記憶部31からアプリに関係するVMの情報を取得し(ステップS61)、リソースデータ記憶部32からアプリに関係する全VMのリソースデータを取得する(ステップS62)。
As illustrated in FIG. 30, the first correlation analysis unit 42 acquires VM information related to the application from the VM information storage unit 31 (step S61), and the resources of all VMs related to the application from the resource
そして、第1相関分析部42は、遅延度合が閾値Trt未満のときのリソースデータと閾値Trt以上のリソースデータに分け(ステップS63)、二群比較検定によりp−valueを計算する(ステップS64)処理をリソースデータ数だけ繰り返す。そして、第1相関分析部42は、多重検定補正を実行し(ステップS65)、多重検定補正により補正したp−valueが閾値以下のリソースデータのみを抽出する(ステップS66)。 The first correlation analysis unit 42, the delay degree divided into resource data and the threshold T rt or more resources data when less than the threshold value T rt (step S63), calculates the p-value by two groups comparison test (step S64) The process is repeated for the number of resource data. Then, the first correlation analysis unit 42 performs multiple test correction (step S65), and extracts only resource data whose p-value corrected by the multiple test correction is equal to or less than a threshold value (step S66).
そして、第1相関分析部42は、リソースデータ抽出処理を行い(ステップS67)、第1分析結果記憶部43に相関分析結果を保存する(ステップS68)。 Then, the first correlation analysis unit 42 performs resource data extraction processing (step S67), and stores the correlation analysis result in the first analysis result storage unit 43 (step S68).
図31は、二群比較検定を用いる第2相関分析処理のフローを示すフローチャ−トである。図31に示すように、第2相関分析部44は、リソース性能低下の影響を受けるデータの相関のあったリソース数だけステップS71〜ステップS78の処理を繰り返す。 FIG. 31 is a flowchart showing the flow of the second correlation analysis process using the two-group comparison test. As illustrated in FIG. 31, the second correlation analysis unit 44 repeats the processes in steps S <b> 71 to S <b> 78 for the number of resources that have been correlated with the data affected by the resource performance degradation.
すなわち、第2相関分析部44は、注目リソースを共有しているVMの情報を取得し(ステップS71)、注目リソースを共有している全VMのリソース負荷量を表すデータを取得する(ステップS72)。 That is, the second correlation analysis unit 44 acquires information on VMs sharing the target resource (step S71), and acquires data representing the resource load amount of all VMs sharing the target resource (step S72). ).
そして、第2相関分析部44は、リソース34を共有している全VMのリソース負荷量を表すデータ数だけステップS73とステップS74の処理を繰り返す。すなわち、第2相関分析部44は、遅延度合が閾値Trt未満のときのリソースデータと閾値Trt以上のリソースデータに分け(ステップS73)、二群比較検定によりp−valueを計算する(ステップS74)。 Then, the second correlation analysis unit 44 repeats the processes of step S73 and step S74 for the number of data representing the resource load amount of all VMs sharing the resource 34. That is, the second correlation analysis unit 44, the delay degree divided into resource data and the threshold T rt or more resources data when less than the threshold value T rt (step S73), calculates the p-value by two groups comparison test (step S74).
そして、第2相関分析部44は、多重検定補正を実行し(ステップS75)、多重検定補正により補正したp−valueが閾値以下のリソースデータのみを抽出する(ステップS76)。そして、第2相関分析部44は、リソースデータ抽出処理を行い(ステップS77)、第2分析結果記憶部45に相関分析結果を保存する(ステップS78)。 Then, the second correlation analysis unit 44 executes multiple test correction (step S75), and extracts only resource data whose p-value corrected by the multiple test correction is equal to or less than a threshold value (step S76). Then, the second correlation analysis unit 44 performs resource data extraction processing (step S77), and stores the correlation analysis result in the second analysis result storage unit 45 (step S78).
このように、第1相関分析部42及び第2相関分析部44は、遅延度合が閾値Trt未満のときのリソースデータと閾値Trt以上のリソースデータに分け、二群比較検定によりp−valueを計算することで、遅延していないデータの影響を抑えて相関分析を行うことができる。 Thus, the first correlation analyzer 42 and the second correlation analysis unit 44 divides the resource data and the threshold T rt over resource data when the delay degree is less than the threshold value T rt, p-value by two groups comparison test By calculating, correlation analysis can be performed while suppressing the influence of undelayed data.
上述してきたように、実施例1では、遅延判定部41が遅延度合情報を遅延情報作成装置2から取得してアプリに遅延が発生したか否かを判定し、第1相関分析部42が遅延が発生したアプリに関係するVMのリソースデータと遅延度合との相関分析を行う。そして、リソース性能低下の影響を受けるデータと遅延度合との相関がある場合に、第2相関分析部44がリソース34を共有している全VMについて、リソース負荷量を表すデータと遅延度合との相関関係を分析する。そして、遅延原因診断部46が、第1相関分析部42と第2相関分析部44の相関分析結果に基づいて遅延原因を特定する。
As described above, in the first embodiment, the
したがって、診断装置4は、アプリの性能低下がクラウド基盤に原因があるのかアプリに原因があるのかを特定することができる。また、診断装置4は、クラウド基盤に原因がある場合に、どのリソース34に原因があるかを特定することができる。
Therefore, the
また、実施例では、第1相関分析部42は、遅延しているときと遅延していないときのリソースデータの傾向に差があるか否かを判定することで相関分析を行う場合には、遅延していないデータの影響を抑えて相関分析を行うことができる。 Further, in the embodiment, when the first correlation analysis unit 42 performs the correlation analysis by determining whether there is a difference in the tendency of the resource data when it is delayed and when it is not delayed, Correlation analysis can be performed while suppressing the influence of non-delayed data.
また、実施例では、第1相関分析部42は、遅延度合との相関係数を計算し、無相関検定を行ってp−valueを計算し、計算したp−valueを多重検定補正によって補正し、補正したp−valueに基づいて遅延度合と相関があるか否かを判定する。したがって、第1相関分析部42は、遅延度合とリソースデータの相関分析を正確に行うことができる。 In the embodiment, the first correlation analysis unit 42 calculates a correlation coefficient with the degree of delay, performs a non-correlation test, calculates a p-value, and corrects the calculated p-value by multiple test correction. Whether or not there is a correlation with the delay degree is determined based on the corrected p-value. Therefore, the first correlation analysis unit 42 can accurately perform the correlation analysis between the delay degree and the resource data.
ところで、リクエスト数が少ない場合には、平均応答時間が不安定になり、遅延度合が不安定になる。遅延度合が不安定な部分があると、遅延と関係するリソース34を見つけられない場合がある。そこで、実施例2では、遅延度合が不安定な部分のデータを取り除いた場合と全データを使った場合の両方で遅延原因診断を行う診断装置について説明する。 By the way, when the number of requests is small, the average response time becomes unstable, and the delay degree becomes unstable. If there is an unstable part of the delay degree, the resource 34 related to the delay may not be found. Therefore, in the second embodiment, a diagnostic apparatus that performs a delay cause diagnosis both when the data of the portion where the delay degree is unstable is removed and when all the data is used will be described.
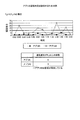
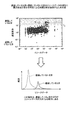
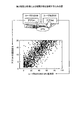
図32は、遅延度合が不安定なデータの除去を説明するための図である。図32の横軸はリクエスト数を示し、縦軸は遅延度合を示す。図32に示すように、リクエスト数が少ない場合には、遅延度合が不安定になる。このため、実施例2に係る診断装置は、実線の四角で囲まれた全データを使った場合と、破線の四角で囲まれたデータだけを使った場合の両方で遅延原因診断を行う。 FIG. 32 is a diagram for explaining the removal of data with an unstable delay degree. The horizontal axis in FIG. 32 indicates the number of requests, and the vertical axis indicates the degree of delay. As shown in FIG. 32, when the number of requests is small, the delay degree becomes unstable. For this reason, the diagnostic apparatus according to the second embodiment performs the delay cause diagnosis both in the case of using all the data enclosed by the solid square and in the case of using only the data enclosed by the dashed square.
図33は、実施例2に係るクラウドシステムの構成を示す図である。なお、ここでは説明の便宜上、図2に示した各部と同様の役割を果たす機能部については同一符号を付すこととしてその詳細な説明を省略する。 FIG. 33 is a diagram illustrating a configuration of a cloud system according to the second embodiment. Here, for convenience of explanation, functional units that play the same functions as the respective units shown in FIG.
図33に示すように、実施例2に係るクラウドシステム1aは、図2に示したクラウドシステム1と比較して、診断装置4の代わりに診断装置4aを有する。診断装置4aは、診断装置4にはないデータ除去部40を有し、遅延判定部41の代わりに遅延判定部41aを有する。
As illustrated in FIG. 33, the cloud system 1a according to the second embodiment includes a diagnostic device 4a instead of the
データ除去部40は、遅延度合が不安定なデータを取り除く。遅延判定部41aは、データ除去部40により遅延度合が不安定な部分のデータが取り除かれたデータと、遅延情報作成装置2が作成した全データと両方でアプリに遅延が発生しているか否かを判定する。
The
遅延度合を計算するために用いられる平均応答時間は、リクエスト数が増加すると安定するため、リクエスト数が大きくなると遅延度合の分散が小さくなる。そこで、データ除去部40は、リクエスト数を基準にデータを分割し、遅延度合の分散が減少から増加に変わるリクエスト数を閾値とし、閾値以下のデータを遅延度合が不安定なデータとして取り除く。
Since the average response time used for calculating the delay degree is stable as the number of requests increases, the dispersion of the delay degree decreases as the number of requests increases. Therefore, the
図34は、遅延度合が不安定なデータの除去方法を説明するための図である。図34(a)は、データの分割を示す。横軸はリクエスト数であり、縦軸は遅延度合である。図34(a)に示すように、データはリクエスト数に応じて分割される。分割されたデータには、リクエスト数が少ない方から順に0、1、2、3のIDが付加される。 FIG. 34 is a diagram for explaining a method of removing data with an unstable delay degree. FIG. 34A shows data division. The horizontal axis is the number of requests, and the vertical axis is the degree of delay. As shown in FIG. 34A, the data is divided according to the number of requests. IDs of 0, 1, 2, and 3 are added to the divided data in order from the smallest number of requests.
図34(b)は、分割されたデータの遅延度合の分散を示す。横軸はデータのIDであり、縦軸は遅延度合の分散である。図34(b)に示すように、IDが0であるデータについての遅延度合の分散は約3.3であり、IDが1であるデータについての遅延度合の分散は約2.0であり、IDが2であるデータについての遅延度の分散は約4.9である。すなわち、遅延度合の分散は、ID=1までは減少し、ID=2で増加する。 FIG. 34B shows the dispersion of the delay degree of the divided data. The horizontal axis represents the data ID, and the vertical axis represents the dispersion of the delay degree. As shown in FIG. 34 (b), the dispersion of the delay degree for the data whose ID is 0 is about 3.3, and the dispersion of the delay degree for the data whose ID is 1 is about 2.0. The dispersion of the delay degree for the data whose ID is 2 is about 4.9. That is, the dispersion of the delay degree decreases until ID = 1, and increases when ID = 2.
したがって、データ除去部40は、ID=1とID=2の境界のリクエスト数を閾値として、リクエスト数が閾値以下のデータを遅延度合が不安定なデータとして取り除く。図34(b)では、閾値は約1600であり、ID=0とID=1のデータが取り除かれる。
Therefore, the
具体的には、データ除去部40は、以下の手順でデータを取り除く。
(1)データ除去部40は、遅延度合が閾値Trt以上のデータのうち、最小と最大のリクエスト数をそれぞれCmin、Cmaxとする。
(2)そして、データ除去部40は、リクエスト数がCmin以上、Cmax以下のデータ数をnとし、分割数kをSturgesの公式を利用してk=1+log2nにより計算する。
(3)そして、データ除去部40は、リクエスト数がCmin以上、Cmax以下のデータを、リクエスト数順にk個に分割し、分割されたそれぞれのデータで遅延度合の分散を計算する。
(4)そして、データ除去部40は、リクエスト数が低いデータから順に分散を見ていき、分散が減少から増加に変わる分割の最小のリクエスト数をTcとする。
(5)そして、データ除去部40は、リクエスト数が閾値Tc以下のデータを取り除く。
Specifically, the
(1) The
(2) Then, the
(3) Then, the
(4) Then, the
(5) Then, the
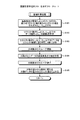
図35は、診断装置4aによる処理のフローを示すフローチャートである。図35に示すように、診断装置4aは、アプリ数だけステップS81〜ステップS91の処理を繰り返す。すなわち、診断装置4aは、アプリの診断対象期間の遅延度合情報を取得する(ステップS81)。そして、診断装置4aは、リクエスト数の閾値Tcを計算する閾値計算処理を行う(ステップS82)。 FIG. 35 is a flowchart showing the flow of processing by the diagnostic device 4a. As illustrated in FIG. 35, the diagnosis device 4a repeats the processing from step S81 to step S91 for the number of applications. That is, the diagnostic device 4a acquires the delay degree information of the diagnosis target period of the app (step S81). Then, the diagnostic device 4a performs a threshold value calculation process for calculating the request number threshold value Tc (step S82).
そして、診断装置4aは、リクエスト数が閾値Tcより大きくかつ遅延度合が閾値Trt以上の回数がTdr以上か否かを判定し(ステップS83)、ステップS83の判定結果がNoの場合には、ステップS88へ進む。一方、ステップS83の判定結果がYesである場合には、診断装置4aは、リクエスト数が閾値Tcより大きいデータを抽出し(ステップS84)、第1相関分析処理を行う(ステップS85)。 The diagnostic device 4a is the number of times larger and the delay degree number of requests than the threshold value T c is greater than or equal to the threshold T rt it is determined whether or T dr (step S83), if the decision result in the step S83 is No Advances to step S88. On the other hand, when the determination result of step S83 is Yes, the diagnostic device 4a extracts data whose number of requests is larger than the threshold value Tc (step S84), and performs the first correlation analysis process (step S85).
そして、診断装置4aは、第2相関分析処理を行う(ステップS86)、なお、ステップS86の処理は、リソース性能低下の影響を受けるデータの相関があった場合に行われる。そして、診断装置4aは、遅延原因診断処理を行う(ステップS87)。 Then, the diagnostic device 4a performs the second correlation analysis process (step S86). Note that the process of step S86 is performed when there is a correlation of data affected by resource performance degradation. Then, the diagnostic device 4a performs a delay cause diagnosis process (step S87).
そして、診断装置4aは、遅延度合が閾値Trt以上の回数がTdr以上か否かを判定し(ステップS88)、遅延度合が閾値Trt以上の回数がTdr以上でない場合には、次のアプリの処理を行う。一方、遅延度合が閾値Trt以上の回数がTdr以上である場合には、診断装置4aは、第1相関分析処理を行う(ステップS89)。 The diagnostic device 4a, when the number of delay degree is greater than or equal to the threshold T rt it is determined whether or T dr (step S88), the number of times the delay degree is equal to or more than the threshold T rt not more T dr is the following Process the app. On the other hand, when the number of times that the delay degree is equal to or greater than the threshold Trt is equal to or greater than Tdr , the diagnostic device 4a performs the first correlation analysis process (step S89).
そして、診断装置4aは、第2相関分析処理を行う(ステップS90)、なお、ステップS90の処理は、リソース性能低下の影響を受けるデータの相関があった場合に行われる。そして、診断装置4aは、遅延原因診断処理を行う(ステップS91)。 Then, the diagnostic device 4a performs the second correlation analysis process (step S90), and the process of step S90 is performed when there is a correlation of data that is affected by resource performance degradation. Then, the diagnostic device 4a performs a delay cause diagnosis process (step S91).
そして、アプリ数だけステップS81〜ステップS91の処理を繰り返すと、診断装置4aは、クラウド基盤要因により応答遅延が発生と診断されたアプリがあるかを判定し(ステップS92)、ある場合には、クラウド運用管理者に通知する(ステップS93)。 Then, when the processing of step S81 to step S91 is repeated for the number of applications, the diagnosis device 4a determines whether there is an application diagnosed as having a response delay due to cloud-based factors (step S92). The cloud operation manager is notified (step S93).
図36は、閾値計算処理のフローを示すフローチャートである。図36に示すように、データ除去部40は、遅延度合が閾値Trt以上のデータのうち、最小のリクエスト数と最大のリクエスト数をそれぞれCmin、Cmaxとする(ステップS101)。そして、データ除去部40は、リクエスト数がCmin以上、Cmax以下のデータ数をnとし、分割数kを計算する(ステップS102)。
FIG. 36 is a flowchart showing a flow of threshold value calculation processing. As shown in FIG. 36, the
そして、データ除去部40は、リクエスト数がCmin以上、Cmax以下のデータを、リクエスト数順に並び替え、k個に分割する(ステップS103)。そして、データ除去部40は、分割されたデータの遅延度合の分散を計算する(ステップS104)処理を分割数分だけ繰り返す。そして、データ除去部40は、分散が減少から増加に変わる分割データの最小のリクエスト数をTcとする(ステップS105)。
Then, the
上述してきたように、実施例2では、診断装置4aは、リクエスト数がTc以下のデータが取り除かれたデータと、全データとの両方でアプリに遅延が発生しているか否かを判定してアプリ遅延原因の診断を行う。したがって、診断装置4aは、遅延度合が不安定なデータに影響されることなくアプリ遅延原因の診断を行うことができる。 As described above, in the second embodiment, the diagnosis device 4a determines whether or not there is a delay in the application in both the data from which the data with the number of requests equal to or less than Tc is removed and all the data. To diagnose the cause of the application delay. Therefore, the diagnostic device 4a can diagnose the cause of the application delay without being affected by data whose delay degree is unstable.
なお、実施例1及び2では、診断装置4及び4aについて説明したが、診断装置4及び4aが有する構成をソフトウェアによって実現することで、同様の機能を有する診断プログラムを得ることができる。そこで、診断プログラムを実行するコンピュータについて説明する。
In the first and second embodiments, the
図37は、実施例1及び2に係る診断プログラムを実行するコンピュータのハードウェア構成を示す図である。図37に示すように、コンピュータ50は、メインメモリ51と、CPU52と、LAN(Local Area Network)インタフェース53と、HDD(Hard Disk Drive)54とを有する。また、コンピュータ50は、スーパーIO(Input Output)55と、DVI(Digital Visual Interface)56と、ODD(Optical Disk Drive)57とを有する。
FIG. 37 is a diagram illustrating a hardware configuration of a computer that executes the diagnostic program according to the first and second embodiments. As shown in FIG. 37, the
メインメモリ51は、プログラムやプログラムの実行途中結果などを記憶するメモリである。CPU52は、メインメモリ51からプログラムを読み出して実行する中央処理装置である。CPU52は、メモリコントローラを有するチップセットを含む。
The
LANインタフェース53は、コンピュータ50をLAN経由で他のコンピュータに接続するためのインタフェースである。HDD54は、プログラムやデータを格納するディスク装置であり、スーパーIO55は、マウスやキーボードなどの入力装置を接続するためのインタフェースである。DVI56は、液晶表示装置を接続するインタフェースであり、ODD57は、DVDの読み書きを行う装置である。
The
LANインタフェース53は、PCIエクスプレス(PCIe)によりCPU52に接続され、HDD54及びODD57は、SATA(Serial Advanced Technology Attachment)によりCPU52に接続される。スーパーIO55は、LPC(Low Pin Count)によりCPU52に接続される。
The
そして、コンピュータ50において実行される診断プログラムは、コンピュータ50により読み出し可能な記録媒体の一例であるDVDに記憶され、ODD57によってDVDから読み出されてコンピュータ50にインストールされる。あるいは、診断プログラムは、LANインタフェース53を介して接続された他のコンピュータシステムのデータベースなどに記憶され、これらのデータベースから読み出されてコンピュータ50にインストールされる。そして、インストールされた診断プログラムは、HDD54に記憶され、メインメモリ51に読み出されてCPU52によって実行される。
The diagnostic program executed in the
また、実施例1及び2では、正規化平均応答時間を遅延度合として用いる場合について説明したが、本発明はこれに限定されるものではなく、他の値を遅延度合として用いる場合にも同様に適用することができる。 In the first and second embodiments, the case where the normalized average response time is used as the delay degree has been described. However, the present invention is not limited to this, and the same applies when other values are used as the delay degree. Can be applied.
また、実施例1及び2では、遅延情報作成装置2が、診断装置4及び4aと異なる装置である場合について説明したが、本発明はこれに限定されるものではなく、遅延情報作成装置2の機能が、診断装置4及び4aに含まれる場合にも同様に適用することができる。
In the first and second embodiments, the case where the delay
1,1a クラウドシステム
2 遅延情報作成装置
3c ネットワークスイッチ
4,4a 診断装置
9 物理マシン
9a 仮想マシン
21 キャプチャ部
22 パケット情報記憶部
23 種別判定用データ記憶部
24 種別判定部
25 種別情報記憶部
26 応答時間算出部
27 応答時間情報記憶部
28 正規化部
29 代表情報記憶部
30 遅延度合情報記憶部
31 VM情報記憶部
32 リソースデータ記憶部
33 構成情報記憶部
40 データ除去部
41,41a 遅延判定部
42 第1相関分析部
43 第1分析結果記憶部
44 第2相関分析部
45 第2分析結果記憶部
46 遅延原因診断部
47 診断結果記憶部
50 コンピュータ
51 メインメモリ
52 CPU
53 LANインタフェース
54 HDD
55 スーパーIO
56 DVI
57 ODD
DESCRIPTION OF
53
55 Super IO
56 DVI
57 ODD
Claims (10)
アプリケーション毎に実行の遅延を示す遅延度合を取得して前記遅延度合が所定の閾値以上であるか否かを判定し、
前記遅延度合が所定の閾値以上であると判定した場合に、前記アプリケーションに関係するリソースに関する情報と前記遅延度合との相関関係に基づいて前記遅延の原因を特定する
診断プログラム。 On the computer,
Obtaining a delay degree indicating an execution delay for each application and determining whether the delay degree is equal to or greater than a predetermined threshold;
A diagnostic program for identifying a cause of the delay based on a correlation between information on a resource related to the application and the delay degree when it is determined that the delay degree is equal to or greater than a predetermined threshold.
複数の正規化平均応答時間のうち、平均値の算出に用いられたリクエストの数が少ない場合の正規化平均応答時間を不安定な正規化平均応答時間として除く処理をさらに前記コンピュータに実行させ、
前記特定する処理は、前記不安定な正規化平均応答時間が除かれた正規化応答時間のうち第1閾値以上の個数が一定期間に第2閾値以上であるとき、又は、前記不安定な正規化平均応答時間を含む正規化応答時間のうち第1閾値以上の個数が一定期間に第2閾値以上であるときに、前記遅延の原因を特定することを特徴とする請求項1〜6のいずれか1つに記載の診断プログラム。 The degree of delay is a normalized average response time obtained by normalizing an average value of response times for a request every fixed time,
Among the plurality of normalized average response times, the computer further executes a process of removing the normalized average response time when the number of requests used for calculating the average value is small as an unstable normalized average response time,
The specifying process is performed when the number of the normalized response times excluding the unstable normalized average response time is equal to or greater than a second threshold value during a certain period, or 7. The cause of the delay is specified when the number of normalized response times including the normalized average response time is equal to or greater than a second threshold value during a certain period of time. The diagnostic program as described in any one.
アプリケーション毎に実行の遅延を示す遅延度合を取得して前記遅延度合が所定の閾値以上であるか否かを判定し、
前記遅延度合が所定の閾値以上であると判定した場合に、前記アプリケーションに関係するリソースに関する情報と前記遅延度合との相関関係に基づいて前記遅延の原因を特定する
処理を実行することを特徴とする診断方法。 Computer
Obtaining a delay degree indicating an execution delay for each application and determining whether the delay degree is equal to or greater than a predetermined threshold;
When it is determined that the delay degree is equal to or greater than a predetermined threshold value, a process of identifying the cause of the delay based on a correlation between information related to resources related to the application and the delay degree is performed. Diagnostic method to do.
前記遅延判定部により遅延度合が所定の閾値以上であると判定された場合に、前記アプリケーションに関係するリソースに関する情報と前記遅延度合との相関関係に基づいて前記遅延の原因を特定する特定部と
を有することを特徴とする診断装置。 A delay determination unit that acquires a delay degree indicating an execution delay for each application and determines whether the delay degree is equal to or greater than a predetermined threshold;
A specifying unit that identifies the cause of the delay based on a correlation between the information related to the resource related to the application and the delay degree when the delay determination part determines that the delay degree is equal to or greater than a predetermined threshold; A diagnostic apparatus comprising:
Priority Applications (1)
| Application Number | Priority Date | Filing Date | Title |
|---|---|---|---|
| JP2017129803A JP2019012477A (en) | 2017-06-30 | 2017-06-30 | Diagnostic program, diagnostic method, and diagnostic apparatus |
Applications Claiming Priority (1)
| Application Number | Priority Date | Filing Date | Title |
|---|---|---|---|
| JP2017129803A JP2019012477A (en) | 2017-06-30 | 2017-06-30 | Diagnostic program, diagnostic method, and diagnostic apparatus |
Publications (1)
| Publication Number | Publication Date |
|---|---|
| JP2019012477A true JP2019012477A (en) | 2019-01-24 |
Family
ID=65226891
Family Applications (1)
| Application Number | Title | Priority Date | Filing Date |
|---|---|---|---|
| JP2017129803A Pending JP2019012477A (en) | 2017-06-30 | 2017-06-30 | Diagnostic program, diagnostic method, and diagnostic apparatus |
Country Status (1)
| Country | Link |
|---|---|
| JP (1) | JP2019012477A (en) |
Cited By (4)
| Publication number | Priority date | Publication date | Assignee | Title |
|---|---|---|---|---|
| JPWO2024142180A1 (en) * | 2022-12-26 | 2024-07-04 | ||
| JPWO2024142181A1 (en) * | 2022-12-26 | 2024-07-04 | ||
| WO2024142179A1 (en) * | 2022-12-26 | 2024-07-04 | 楽天モバイル株式会社 | Estimating cause of application instability |
| WO2024158199A1 (en) * | 2023-01-26 | 2024-08-02 | 삼성전자 주식회사 | Electronic device and method for detecting performance change in electronic device |
-
2017
- 2017-06-30 JP JP2017129803A patent/JP2019012477A/en active Pending
Cited By (11)
| Publication number | Priority date | Publication date | Assignee | Title |
|---|---|---|---|---|
| JPWO2024142180A1 (en) * | 2022-12-26 | 2024-07-04 | ||
| JPWO2024142181A1 (en) * | 2022-12-26 | 2024-07-04 | ||
| WO2024142181A1 (en) * | 2022-12-26 | 2024-07-04 | 楽天モバイル株式会社 | Determination of whether processes involved in communication system are unstable |
| WO2024142179A1 (en) * | 2022-12-26 | 2024-07-04 | 楽天モバイル株式会社 | Estimating cause of application instability |
| WO2024142180A1 (en) * | 2022-12-26 | 2024-07-04 | 楽天モバイル株式会社 | Replacement of unstable application |
| JPWO2024142179A1 (en) * | 2022-12-26 | 2024-07-04 | ||
| JP7812467B2 (en) | 2022-12-26 | 2026-02-09 | 楽天モバイル株式会社 | Replacing unstable applications |
| JP7814556B2 (en) | 2022-12-26 | 2026-02-16 | 楽天モバイル株式会社 | Possible causes of application instability |
| JP7838123B2 (en) | 2022-12-26 | 2026-03-31 | 楽天モバイル株式会社 | Determining whether a process included in a communication system is unstable. |
| WO2024158199A1 (en) * | 2023-01-26 | 2024-08-02 | 삼성전자 주식회사 | Electronic device and method for detecting performance change in electronic device |
| EP4443303A4 (en) * | 2023-01-26 | 2025-12-03 | Samsung Electronics Co Ltd | ELECTRONIC DEVICE AND METHOD FOR DETECTING PERFORMANCE CHANGES IN AN ELECTRONIC DEVICE |
Similar Documents
| Publication | Publication Date | Title |
|---|---|---|
| US11500757B2 (en) | Method and system for automatic real-time causality analysis of end user impacting system anomalies using causality rules and topological understanding of the system to effectively filter relevant monitoring data | |
| EP4182796B1 (en) | Machine learning-based techniques for providing focus to problematic compute resources represented via a dependency graph | |
| EP3745272B1 (en) | An application performance analyzer and corresponding method | |
| CN108039964B (en) | Fault processing method, device and system based on network function virtualization | |
| CN108989136B (en) | Service end-to-end performance monitoring method and device | |
| US10275301B2 (en) | Detecting and analyzing performance anomalies of client-server based applications | |
| US11106562B2 (en) | System and method for detecting anomalies based on feature signature of task workflows | |
| US9015006B2 (en) | Automated enablement of performance data collection | |
| US9015362B2 (en) | Monitoring network performance and detecting network faults using round trip transmission times | |
| US8631280B2 (en) | Method of measuring and diagnosing misbehaviors of software components and resources | |
| US9600523B2 (en) | Efficient data collection mechanism in middleware runtime environment | |
| US9027025B2 (en) | Real-time database exception monitoring tool using instance eviction data | |
| CN110865867A (en) | Method, device and system for discovering application topological relation | |
| CN110716842A (en) | Cluster fault detection method and device | |
| JP2019507454A (en) | How to identify the root cause of problems observed while running an application | |
| CN111181800A (en) | Test data processing method and device, electronic equipment and storage medium | |
| JP2018028783A (en) | System state visualization program, system state visualization method, and system state visualization device | |
| JP2019012477A (en) | Diagnostic program, diagnostic method, and diagnostic apparatus | |
| CN120358147A (en) | Monitoring index dependency analysis and topology establishment method and device and computer equipment | |
| CN114741218A (en) | Method, device, equipment, system and medium for extracting abnormal index of operating system | |
| JP2011113122A (en) | Failure influence analysis device, application system, and failure influence analysis method | |
| US20070086350A1 (en) | Method, system, and computer program product for providing failure detection with minimal bandwidth usage | |
| JP2023039385A (en) | Virtual function and performance analyzing system and analyzing method thereof | |
| CN120104452A (en) | Method, device and electronic device for automated microservice health monitoring | |
| US20180285238A1 (en) | Intelligent deinstrumentation of instrumented applications |