JP2015165636A - Detecting device, detecting method, and detecting program - Google Patents
Detecting device, detecting method, and detecting program Download PDFInfo
- Publication number
- JP2015165636A JP2015165636A JP2014040384A JP2014040384A JP2015165636A JP 2015165636 A JP2015165636 A JP 2015165636A JP 2014040384 A JP2014040384 A JP 2014040384A JP 2014040384 A JP2014040384 A JP 2014040384A JP 2015165636 A JP2015165636 A JP 2015165636A
- Authority
- JP
- Japan
- Prior art keywords
- time
- log
- storage unit
- communication quality
- monitoring target
- Prior art date
- Legal status (The legal status is an assumption and is not a legal conclusion. Google has not performed a legal analysis and makes no representation as to the accuracy of the status listed.)
- Pending
Links
Images


Classifications
-
- H—ELECTRICITY
- H04—ELECTRIC COMMUNICATION TECHNIQUE
- H04L—TRANSMISSION OF DIGITAL INFORMATION, e.g. TELEGRAPHIC COMMUNICATION
- H04L67/00—Network arrangements or protocols for supporting network services or applications
- H04L67/01—Protocols
- H04L67/02—Protocols based on web technology, e.g. hypertext transfer protocol [HTTP]
-
- H—ELECTRICITY
- H04—ELECTRIC COMMUNICATION TECHNIQUE
- H04L—TRANSMISSION OF DIGITAL INFORMATION, e.g. TELEGRAPHIC COMMUNICATION
- H04L41/00—Arrangements for maintenance, administration or management of data switching networks, e.g. of packet switching networks
- H04L41/50—Network service management, e.g. ensuring proper service fulfilment according to agreements
- H04L41/5061—Network service management, e.g. ensuring proper service fulfilment according to agreements characterised by the interaction between service providers and their network customers, e.g. customer relationship management
- H04L41/5067—Customer-centric QoS measurements
-
- H—ELECTRICITY
- H04—ELECTRIC COMMUNICATION TECHNIQUE
- H04L—TRANSMISSION OF DIGITAL INFORMATION, e.g. TELEGRAPHIC COMMUNICATION
- H04L43/00—Arrangements for monitoring or testing data switching networks
- H04L43/04—Processing captured monitoring data, e.g. for logfile generation
-
- H—ELECTRICITY
- H04—ELECTRIC COMMUNICATION TECHNIQUE
- H04L—TRANSMISSION OF DIGITAL INFORMATION, e.g. TELEGRAPHIC COMMUNICATION
- H04L43/00—Arrangements for monitoring or testing data switching networks
- H04L43/06—Generation of reports
- H04L43/065—Generation of reports related to network devices
-
- H—ELECTRICITY
- H04—ELECTRIC COMMUNICATION TECHNIQUE
- H04L—TRANSMISSION OF DIGITAL INFORMATION, e.g. TELEGRAPHIC COMMUNICATION
- H04L69/00—Network arrangements, protocols or services independent of the application payload and not provided for in the other groups of this subclass
- H04L69/16—Implementation or adaptation of Internet protocol [IP], of transmission control protocol [TCP] or of user datagram protocol [UDP]
-
- H—ELECTRICITY
- H04—ELECTRIC COMMUNICATION TECHNIQUE
- H04L—TRANSMISSION OF DIGITAL INFORMATION, e.g. TELEGRAPHIC COMMUNICATION
- H04L69/00—Network arrangements, protocols or services independent of the application payload and not provided for in the other groups of this subclass
- H04L69/22—Parsing or analysis of headers
-
- H—ELECTRICITY
- H04—ELECTRIC COMMUNICATION TECHNIQUE
- H04L—TRANSMISSION OF DIGITAL INFORMATION, e.g. TELEGRAPHIC COMMUNICATION
- H04L69/00—Network arrangements, protocols or services independent of the application payload and not provided for in the other groups of this subclass
- H04L69/40—Network arrangements, protocols or services independent of the application payload and not provided for in the other groups of this subclass for recovering from a failure of a protocol instance or entity, e.g. service redundancy protocols, protocol state redundancy or protocol service redirection
-
- H—ELECTRICITY
- H04—ELECTRIC COMMUNICATION TECHNIQUE
- H04L—TRANSMISSION OF DIGITAL INFORMATION, e.g. TELEGRAPHIC COMMUNICATION
- H04L43/00—Arrangements for monitoring or testing data switching networks
- H04L43/16—Threshold monitoring
Landscapes
- Engineering & Computer Science (AREA)
- Computer Networks & Wireless Communication (AREA)
- Signal Processing (AREA)
- Computer Security & Cryptography (AREA)
- Data Mining & Analysis (AREA)
- Business, Economics & Management (AREA)
- General Business, Economics & Management (AREA)
- Environmental & Geological Engineering (AREA)
- Data Exchanges In Wide-Area Networks (AREA)
- Mobile Radio Communication Systems (AREA)
- Telephonic Communication Services (AREA)
Abstract
【課題】劣化要因の分析に必要な記憶容量の低減化を図ること。
【解決手段】検出装置は、通信装置間のトラフィックに関するログを記憶し、記憶容量が所定量以上になると記憶済みのログのうち最古のログから削除する第1の記憶部に記憶されたログのうち、通信品質の監視対象が関与する特定のトラフィックについての特定のログを参照することにより、前記監視対象についての通信品質に関する時系列な統計値群を算出し、算出された時系列な統計値群と、前記監視対象についての通信品質の劣化に関するしきい値と、を比較することにより、前記監視対象についての通信品質の劣化を検出し、前記監視対象についての通信品質の劣化が検出された場合、前記特定のログを前記第1の記憶部から取得して、第2の記憶部に格納する。
【選択図】図4It is an object of the present invention to reduce the storage capacity necessary for analyzing deterioration factors.
A detection device stores a log relating to traffic between communication devices, and a log stored in a first storage unit that is deleted from the oldest log among stored logs when a storage capacity exceeds a predetermined amount. Time series statistical values related to the communication quality of the monitoring target are calculated by referring to a specific log for the specific traffic involving the monitoring target of the communication quality, and the calculated time series statistics By comparing the value group and the threshold value related to the degradation of the communication quality for the monitoring target, the degradation of the communication quality for the monitoring target is detected, and the degradation of the communication quality for the monitoring target is detected. The specific log is acquired from the first storage unit and stored in the second storage unit.
[Selection] Figure 4
Description
本発明は、通信品質の劣化を検出する検出装置、検出方法、および検出プログラムに関する。 The present invention relates to a detection apparatus, a detection method, and a detection program for detecting deterioration in communication quality.
従来技術として、圏外地域、チャネル容量不足地域各々を推定する統計情報処理システムがある(たとえば、下記特許文献1を参照。)。特許文献1では、携帯端末各々が電源投入状態にある間、端末各々には、待ち受け状態となった(無線)基地局の識別情報や圏外状態にあった時間、位置登録/発着信時でのチャネル捕捉成功/失敗が携帯端末統計情報として記録される。この状態で、該端末からの位置登録の度に、該端末から基地局を介し転送される携帯端末統計情報にもとづき、統計情報処理システムでは、圏外地域、チャネル容量不足地域がそれぞれ通信不良地域として推定される。
As a conventional technique, there is a statistical information processing system that estimates each of an out-of-service area and a channel capacity deficient area (see, for example,
また、品質劣化を被る端末数の規模の評価、及び品質劣化の原因の推定を、必要な記憶容量を抑える通信品質管理システムがある(たとえば、下記特許文献2を参照。)。特許文献2では、検出手段は、通信エリア内の通信の試行及び通信の失敗を検出する。通信情報登録手段は、検出手段が通信の試行及び通信の失敗を検知したときに、通信の試行回数及び通信の失敗回数をもとに期間通信情報を集計して、通信情報記憶手段に登録する。管理対象端末特定手段は、検出手段が、通信の失敗を検出したときに、通信に失敗した移動端末を、通信品質の算出対象とする管理対象端末として特定する。端末集計情報登録手段は、管理対象端末特定手段が特定した管理対象端末ごとに端末失敗情報を集計して、通信情報記憶手段に登録する。
In addition, there is a communication quality management system that suppresses necessary storage capacity for evaluating the scale of the number of terminals that suffer quality degradation and estimating the cause of quality degradation (see, for example,
また、他の無線局との間の無線リンクの障害原因を特定して対策を実行する無線装置がある(たとえば、下記特許文献3を参照。)。特許文献3では、無線装置は、無線リンクの状態を表す統計情報の特性値を取得する統計情報取得部と、特性値に基づいて、統計情報に予め関連づけられた複数の障害原因を所定の順序で検出する障害原因検出部と、障害原因検出部で検出された障害原因に予め関連づけられた対策を実行する対策実行部と、を備える。複数の障害原因は、シャドウイングの存在と電波雑音の存在とを含んでおり、所定の順序で検出とは、シャドウイングの存在を検出した後に、電波雑音の存在を検出する。
In addition, there is a radio apparatus that identifies a cause of a radio link failure with another radio station and executes a countermeasure (see, for example,
また、他の無線局と無線リンクを介して接続され、前記無線リンクの障害原因を特定する無線局がある(たとえば、下記特許文献4を参照。)。特許文献4では、無線局は、無線リンク制御方式に従って前記無線リンクの無線リンク制御を実行する無線リンク制御部と、前記無線リンク制御の実行の間、前記無線リンクの状態を表す統計情報を取得する統計情報取得部と、前記統計情報取得部により取得した統計情報に基づき、あらかじめ統計情報と関連づけられた複数の障害原因の中から、前記無線リンクの障害原因を特定する障害原因特定部と、を備える。
In addition, there is a wireless station that is connected to another wireless station via a wireless link and identifies the cause of the failure of the wireless link (see, for example,
品質劣化の兆候を精度よく捉えるためには、ログなどのトラフィックに関する詳細な情報が必要となる。一方、トラフィック量の増大に伴い、劣化要因を分析するために蓄積しておくデータ量も増大するが、上述した特許文献では、データ量を削減することができず、長期間データ保存をおこなう場合、大容量の記憶領域が必要となる。 Detailed information on traffic such as logs is required to accurately capture signs of quality degradation. On the other hand, as the amount of traffic increases, the amount of data stored to analyze degradation factors also increases. However, in the above-mentioned patent document, the amount of data cannot be reduced and data is stored for a long time. A large-capacity storage area is required.
本発明は、劣化要因の分析に必要な記憶容量の低減化を図ることを目的とする。 It is an object of the present invention to reduce the storage capacity necessary for analyzing deterioration factors.
本願において開示される発明の一側面となる検出装置、検出方法、および検出プログラムは、通信装置間のトラフィックに関するログを記憶し、記憶容量が所定量以上になると記憶済みのログのうち最古のログから削除する第1の記憶部に記憶されたログのうち、通信品質の監視対象が関与する特定のトラフィックについての特定のログを参照することにより、前記監視対象についての通信品質に関する時系列な統計値群を算出し、算出された時系列な統計値群と、前記監視対象についての通信品質の劣化に関するしきい値と、を比較することにより、前記監視対象についての通信品質の劣化を検出し、前記監視対象についての通信品質の劣化が検出された場合、前記特定のログを前記第1の記憶部から取得して、第2の記憶部に格納することを特徴とする。 A detection device, a detection method, and a detection program, which are one aspect of the invention disclosed in the present application, store a log relating to traffic between communication devices, and when the storage capacity exceeds a predetermined amount, the oldest of the stored logs Of the logs stored in the first storage unit to be deleted from the log, by referring to the specific log for the specific traffic related to the communication quality monitoring target, the time series regarding the communication quality for the monitoring target Detects degradation of communication quality for the monitoring target by calculating the statistical value group and comparing the calculated time-series statistical value group with a threshold for communication quality degradation for the monitoring target. When the deterioration of the communication quality for the monitoring target is detected, the specific log is acquired from the first storage unit and stored in the second storage unit. The features.
本発明の代表的な実施の形態によれば、劣化要因の分析に必要な記憶容量の低減化を図ることができる。前述した以外の課題、構成及び効果は、以下の実施例の説明により明らかにされる。 According to the representative embodiment of the present invention, it is possible to reduce the storage capacity necessary for analyzing the cause of deterioration. Problems, configurations, and effects other than those described above will become apparent from the description of the following embodiments.
<品質劣化要因の特定例>
本実施例にかかる検出装置は、たとえば、前段に、一定量のデータを蓄積して一定量を超えると最古のデータから消去するRRD(Round Robin Database)、後段に、分析対象となるデータを保存する蓄積DB(Database)を有する。RRDでは、一定期間(たとえば、1か月)で最古のデータが消去されるが、蓄積DBでは、RRDの保存期間以上の期間(たとえば、1年)、データを保持する。すなわち、RDD内のデータのうち、劣化要因に関するデータを蓄積DBに退避させることで、本来ならば、時間の経過によりRDDから削除されるデータであっても蓄積DBに保存することができ、RRDよりも長期間のデータ保存を実現することができる。
<Specific examples of quality degradation factors>
The detection apparatus according to the present embodiment, for example, stores RRD (Round Robin Database) that accumulates a certain amount of data in the former stage and erases it from the oldest data when a certain amount is exceeded, and the data to be analyzed in the latter stage. It has a storage DB (Database) to save. In RRD, the oldest data is erased in a certain period (for example, one month), but in the storage DB, data is retained for a period (for example, one year) longer than the storage period of RRD. That is, by storing data relating to deterioration factors among the data in the RDD in the storage DB, even data that is originally deleted from the RDD over time can be stored in the storage DB. It is possible to realize long-term data storage.
検出装置は、DPI(Deep Packet Inspection)装置で取得されたトラフィックに関するログおよびトラフィックを受信してRRDに保存するが、RRDに保存したログおよびトラフィックのうち、品質劣化に該当するログおよびトラフィックを蓄積DBに保存する。蓄積DBに保存されたログおよびトラフィックは、障害原因の分析に利用することができる。本実施例では、蓄積DBに記憶されるログおよびトラフィックのデータ量を低減することで、蓄積DBの記憶容量の低減化を図ることができる。 The detection device receives the log and traffic related to the traffic acquired by the DPI (Deep Packet Inspection) device and stores it in the RRD. The log and traffic stored in the RRD are accumulated in the log and traffic corresponding to the quality degradation. Save to DB. Logs and traffic stored in the accumulation DB can be used for failure cause analysis. In this embodiment, it is possible to reduce the storage capacity of the storage DB by reducing the amount of log and traffic data stored in the storage DB.
図1は、本実施例にかかる品質劣化要因の特定例を示す説明図である。検出装置は、基準値DB100を有する。基準値DB100は、ユーザのダウンロード先であるホストとユーザがダウンロードするデータの転送バイト数との組み合わせごとに、分布情報を有する。分布情報は、横軸がダウンロード時間、縦軸がダウンロード回数となるヒストグラムである。各分布情報には、ダウンロード時間の基準値が設定される。基準値は、たとえば、その分布情報における中央値が採用される。
FIG. 1 is an explanatory diagram of a specific example of a quality deterioration factor according to the present embodiment. The detection device has a
検出装置は、各HTTP(Hypertext Transfer Protocol)ログについて、ホストおよび転送バイト数の組み合わせ(<host1,nbdt1>,<host1,nbdt2>,…,<host2,nbdt3>)が同一となる分布情報を特定し、特定した分布情報の基準値と、そのHTTPログにおけるダウンロード時間とを比較する。検出装置は、比較結果として基準値比を算出する。このあと、検出装置は、基準値比の算出元のHTTPログのダウンロード時間と重複してユーザがダウンロードしているHTTPログの数を計数する。計数結果を並列数と称す。検出装置は、基準値比に並列数を乗算することによりQoE(Quality of Experience)値を算出する。QoE値は、ユーザが体感した通信品質を示す指標値である。 For each HTTP (Hypertext Transfer Protocol) log, the detection device identifies distribution information in which the combination of the host and the number of transfer bytes (<host1, nbdt1>, <host1, nbdt2>,..., <Host2, nbdt3>) is the same. Then, the reference value of the specified distribution information is compared with the download time in the HTTP log. The detection device calculates a reference value ratio as a comparison result. Thereafter, the detection device counts the number of HTTP logs downloaded by the user in duplicate with the download time of the HTTP log from which the reference value ratio is calculated. The counting result is referred to as a parallel number. The detection apparatus calculates a QoE (Quality of Experience) value by multiplying the reference value ratio by the parallel number. The QoE value is an index value indicating the communication quality experienced by the user.
検出装置は、QoE値としきい値Tとを比較して品質劣化を検出し、検出した品質劣化に該当するログおよびトラフィックを特定する。特定されたログおよびトラフィックは、RDDから蓄積DBに保存される。蓄積DBに保存されたログおよびトラフィックは、障害原因の分析に利用することができる。また、蓄積DBに記憶されるログおよびトラフィックのデータ量を通信品質の劣化分析に必要なデータに絞り込むことで、蓄積DBの記憶容量の低減化を図ることができる。 The detection device compares the QoE value with the threshold value T to detect quality degradation, and identifies a log and traffic corresponding to the detected quality degradation. The identified logs and traffic are stored in the accumulation DB from the RDD. Logs and traffic stored in the accumulation DB can be used for failure cause analysis. In addition, the storage capacity of the storage DB can be reduced by narrowing down the amount of log and traffic data stored in the storage DB to the data required for communication quality degradation analysis.
<ネットワーク構成例>
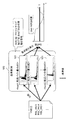
図2は、本実施例にかかる検出装置を含むネットワーク構成例を示す説明図である。図2では、一例としてLTE(Long Term Evolution)網210を用いて説明するが、3G網やそれ以降の次世代網でもよい。図2において、端末201は、ユーザが利用する通信機器であり、LTE網210およびインターネット網211を介してホストであるサーバ212からデータをダウンロードする。LTE網210は、基地局(eNB)202と、MME(Mobility Management Entity)203と、S−GW(Serving Gateway)204と、P−GW(Packet data network Gateway)205と、DPI(Deep Packet Inspection)装置206と、検出装置207と、を含む。
<Example of network configuration>
FIG. 2 is an explanatory diagram of a network configuration example including the detection device according to the present embodiment. In FIG. 2, an explanation will be given using an LTE (Long Term Evolution)
基地局202は、端末201と無線通信する。基地局202は、ユーザトラフィックであるU−PlaneパケットをS−GW204に送信するとともに、制御トラフィックであるC−PlaneパケットをMME203に送信する。MME203は、ネットワーク制御を扱うC−Planeパケットのアクセスゲートウェイである。S−GW204は、U−Planeパケットを扱うゲートウェイである。P−GW205は、インターネット接続するためのゲートウェイである。
DPI装置206は、ネットワーク上のパケット検査技術の一つで、端末201とサーバ212との間の通信を検査する。具体的には、U−PlaneパケットやC−Planeパケットの内容を図1に示したリファレンスポイントで参照してそのログを生成する。DPI装置206は、生成したログを検出装置207に送信する。また、DPI装置206は、リファレンスポイントでミラーリングしたU−Planeパケットデータ群およびC−Planeパケットデータ群(以下、まとめて、「パケットデータ群」と称する場合がある)を検出装置207に送信する。検出装置207は、図1で説明したように、DPI装置206からログおよびパケットデータ群を取得して、端末201とサーバ212との間の通信品質劣化を検出し、該当するログおよびパケットデータ群を保存する。
The
図3は、検出装置207のハードウェア構成例を示すブロック図である。検出装置207は、プロセッサ301と、記憶デバイス302と、入力デバイス303と、出力デバイス304と、通信インターフェース(通信IF305)と、を有する。プロセッサ301、記憶デバイス302、入力デバイス303、出力デバイス304、および通信IF305は、バスにより接続される。プロセッサ301は、検出装置207を制御する。記憶デバイス302は、プロセッサ301の作業エリアとなる。また、記憶デバイス302は、各種プログラムやデータを記憶する記録媒体である。記憶デバイス302としては、たとえば、ROM(Read Only Memory)、RAM(Random Access Memory)、HDD(Hard Disk Drive)、フラッシュメモリがある。入力デバイス303は、データを入力する。入力デバイス303としては、たとえば、キーボード、マウス、タッチパネル、テンキー、スキャナがある。出力デバイス304は、データを出力する。出力デバイス304としては、たとえば、ディスプレイ、プリンタがある。通信IF305は、ネットワークと接続し、データを送受信する。
FIG. 3 is a block diagram illustrating a hardware configuration example of the
図4は、検出装置207の機能的構成例を示すブロック図である。検出装置207は、RRD404と、蓄積DB405と、基準値DB100と、登録部410と、作成部411と、算出部412と、検出部413と、格納部414と、を有する。RRD404、蓄積DB405、および基準値DB100は、具体的には、たとえば、図3に示した記憶デバイスによりその機能を実現する。また、登録部410、作成部411、算出部412、検出部413、および格納部414は、具体的には、たとえば、図3に示した記憶デバイス302に記憶されたプログラムをプロセッサ301に実行させることによりその機能を実現する。
FIG. 4 is a block diagram illustrating a functional configuration example of the
上述したように、RRD404は、一定量のデータを蓄積して一定量を超えると最古のデータから消去するデータベースである。たとえば、RRD404に登録されたデータは、総データ量があるしきい値(たとえば、RRD404の全記憶領域の80%)以上となった場合に、RRD404は、最古の受信データから削除する。蓄積DB405は、RRD404の後段に配置されるデータベースである。基準値DB100は、図1に示したように、ホストと転送バイト数(下り)との組み合わせごとの分布情報を記憶するデータベースである。分布情報は、あらかじめ記憶していてもよく、検出装置207により作成することとしてもよい。検出装置207により作成する場合は、作成部411により作成される。
As described above, the
登録部410は、DPI装置206からパケットデータ群403(401,402)のログ400とパケットデータ群403とを受信する。ログ400には、U−PlaneパケットについてのTCP(Transmission Control Protocol)/UDP(User Datagram Protocol)ログやHTTPログ、C−Planeパケットについての制御メッセージログがある。ログ400およびパケットデータ群403は、たとえば、一定時間ごとにDPI装置206から受信される。
The
登録部410は、受信したログ400がHTTPログである場合、当該HTTPログをRRD404のHTTPログテーブル421に格納する。登録部410は、受信したログ400がTCPログまたはUDPログである場合、当該TCPログまたはUDPログをRRD404のTCP/UDPログテーブル422に格納する。登録部410は、受信データが制御ログである場合、制御ログを制御メッセージログテーブル423に格納する。また、登録部410は、パケットデータ群403を受信すると、RRD404にパケットデータ群403を格納する。
When the received
以下、各テーブル421〜423について説明する。以後の説明では「テーブル」形式によって本発明の各情報について説明するが、これら情報は必ずしもテーブルによるデータ構造で表現されていなくても良く、リスト、DB、キュー等のデータ構造やそれ以外で表現されていても良い。そのため、データ構造に依存しないことを示すために「テーブル」、「リスト」、「DB」、「キュー」等について単に「情報」と呼ぶことがある。また、各情報の内容を説明する際に、「識別情報」、「識別子」、「名」、「名前」、「ID」という表現を用いることが可能であり、これらについてはお互いに置換が可能である。テーブル421〜423以外の他のテーブルについても同様である。 Hereinafter, each of the tables 421 to 423 will be described. In the following description, each information of the present invention will be described in a “table” format. However, such information does not necessarily have to be represented by a table data structure, and may be represented by a data structure such as a list, a DB, a queue, or the like. May be. Therefore, “table”, “list”, “DB”, “queue”, etc. may be simply referred to as “information” to indicate that they do not depend on the data structure. In addition, when explaining the contents of each information, the expressions “identification information”, “identifier”, “name”, “name”, “ID” can be used, and these can be replaced with each other. It is. The same applies to tables other than the tables 421 to 423.
図5は、TCP/UDPログテーブル422の記憶内容例を示す説明図である。TCP/UDPログテーブル422は、U−PlaneパケットであるTCPまたはUDPのフローごとに、TCP/UDPログを格納するテーブルである。TCP/UDPログには、フローごとに、エントリ番号、フロー項目、ユーザ情報、タイムスタンプ、応答遅延、統計情報がある。 FIG. 5 is an explanatory diagram showing an example of the contents stored in the TCP / UDP log table 422. The TCP / UDP log table 422 is a table that stores a TCP / UDP log for each TCP or UDP flow that is a U-Plane packet. The TCP / UDP log has an entry number, flow item, user information, time stamp, response delay, and statistical information for each flow.
エントリ番号は、TCPまたはUDPのフローを一意に特定する識別情報である。フロー項目には、端末側IPと、サーバ側IPと、端末側ポート番号と、サーバ側ポート番号と、プロトコルと、がある。端末側IPは、そのフローにおけるユーザの端末201のIPアドレスである。サーバ側IPは、そのフローにおけるサーバ212のIPアドレスである。端末側ポート番号は、そのフローにおけるユーザの端末201のポート番号である。サーバ側ポート番号は、そのフローにおけるサーバ212のポート番号である。プロトコルは、そのフローのプロトコルの種類(TCPまたはUDP)を示す。
The entry number is identification information that uniquely identifies a TCP or UDP flow. The flow items include a terminal side IP, a server side IP, a terminal side port number, a server side port number, and a protocol. The terminal-side IP is the IP address of the user's terminal 201 in the flow. The server side IP is the IP address of the
ユーザ情報は、接続基地局と、IMSI(International Mobile Subscriber Identity)と、IMEISV(International Mobile Equipment Identity Software Version)とを有する。接続基地局は、そのフローにおいて、ユーザの端末201とサーバ212との間のセッションで、ユーザの端末201と無線通信する接続基地局を特定する情報である。IMSIは、携帯電話加入者であるユーザに発行される国際的な加入者識別番号である。IMEISVは、ユーザの端末201に付与される識別情報である。
The user information includes a connection base station, an IMSI (International Mobile Subscriber Identity), and an IMEISV (International Mobile Equipment Software Version). The connection base station is information for specifying a connection base station that performs wireless communication with the
タイムスタンプは、開始時刻と終了時刻を有する。開始時刻は、そのTCP/UDPフローにおけるDPI装置206でのセッション開始時刻(たとえば、セッション開始のリクエストの時刻)を示し、終了時刻は、そのTCP/UDPフローにおけるDPI装置206でのセッション終了時刻(たとえば、最後のレスポンスの時刻)を示す。
The time stamp has a start time and an end time. The start time indicates the session start time (for example, the request time for session start) in the TCP / UDP flow, and the end time indicates the session end time in the
応答遅延は、そのフローにおける応答遅延を特定する情報である。応答遅延には、無線区間の応答遅延と、有線区間の応答遅延と、がある。無線区間の応答遅延は、図1に示した無線区間の応答遅延の計測区間における応答遅延時間である。有線区間の応答遅延は、図1に示した有線区間の応答遅延の計測区間における応答遅延時間である。 The response delay is information that identifies the response delay in the flow. The response delay includes a response delay in the wireless section and a response delay in the wired section. The response delay of the wireless section is the response delay time in the measurement section of the response delay of the wireless section shown in FIG. The response delay of the wired section is the response delay time in the measurement section of the response delay of the wired section shown in FIG.
統計情報は、パケット数(上りおよび下り)とバイト数(上りおよび下り)を有する。パケット数(上り)は、そのフローにおいて、ユーザの端末201からサーバ212に送信されるパケットの数であり、パケット数(下り)は、そのフローにおいて、サーバ212からユーザの端末201に送信されるパケットの数である。バイト数(上り)は、そのフローにおいて、ユーザの端末201からサーバ212に送信されるパケットのバイト数であり、バイト数(下り)は、そのフローにおいて、サーバ212からユーザの端末201に送信されるパケットのバイト数である。
The statistical information includes the number of packets (up and down) and the number of bytes (up and down). The number of packets (upstream) is the number of packets transmitted from the
図6は、HTTPログテーブル421の記憶内容例を示す説明図である。HTTPログテーブル421は、U−PlaneパケットであるHTTPのフローごとに、HTTPログを格納するテーブルである。HTTPログには、エントリ番号、リクエストコード、レスポンスコード、ホスト、URL、レファラ(Referer)、端末201ブラウザ、コンテンツタイプ、コンテンツ長、タイムスタンプ、ユーザ情報、統計情報がある。 FIG. 6 is an explanatory diagram showing an example of the contents stored in the HTTP log table 421. The HTTP log table 421 is a table that stores an HTTP log for each HTTP flow that is a U-Plane packet. The HTTP log includes an entry number, a request code, a response code, a host, a URL, a referer, a terminal 201 browser, a content type, a content length, a time stamp, user information, and statistical information.
エントリ番号は、HTTPのフローを一意に特定する識別情報である。リクエストコードは、そのHTTPのフローにおけるHTTPのリクエスト内容を特定するコードである。レスポンスコードは、そのHTTPのフローにおけるHTTPのレスポンス内容を特定するコードである。 The entry number is identification information for uniquely specifying an HTTP flow. The request code is a code for specifying the HTTP request content in the HTTP flow. The response code is a code for specifying the HTTP response content in the HTTP flow.
ホストは、そのHTTPのフローにおけるユーザの端末201のアクセス先となるサーバ212を特定する情報である。URLは、ホストにより特定されるサーバ212のアクセス先を示すURLである。レファラは、ホストにより特定されるサーバ212のアクセス先のリンク元を示すURLである。端末201ブラウザは、ユーザの端末201で利用されるブラウザを特定する情報(たとえば、ブラウザ名)である。
The host is information that identifies the
タイムスタンプは、開始時刻と終了時刻を有する。開始時刻は、そのHTTPのフローにおけるDPI装置206でのセッション開始時刻(たとえば、セッション開始のリクエストの時刻)を示し、終了時刻は、そのHTTPのフローにおけるDPI装置206でのセッション終了時刻(たとえば、最後のレスポンスの時刻)を示す。ユーザ情報については、TCP/UDPログテーブル422のユーザ情報と同一であるため、説明を省略する。
The time stamp has a start time and an end time. The start time indicates the session start time (for example, the request time for session start) in the HTTP flow, and the end time indicates the session end time (for example, the
統計情報は、転送バイト数(上りおよび下り)と、ダウンロード時間と、基準値比と、を有する。転送バイト数(上り)は、そのHTTPフローにおいて、ユーザの端末201からホストであるサーバ212に転送されるデータのバイト数である。転送バイト数(下り)は、そのHTTPフローにおいて、ホストであるサーバ212からユーザの端末201に転送されるデータのバイト数である。
The statistical information includes the number of transfer bytes (up and down), download time, and reference value ratio. The number of transfer bytes (upstream) is the number of bytes of data transferred from the
ダウンロード時間は、転送バイト数(下り)に要する時間であり、タイムスタンプの終了時刻から開始時刻を引いた時間である。基準値比は、図1で説明したように、分布情報の基準値と、そのHTTPログにおけるダウンロード時間との比である。登録部410による登録処理では、エントリを構成する情報のうち基準値比以外の情報がHTTPログテーブル421に格納される。
The download time is the time required for the number of transfer bytes (down), and is the time obtained by subtracting the start time from the end time of the time stamp. As described with reference to FIG. 1, the reference value ratio is a ratio between the reference value of the distribution information and the download time in the HTTP log. In the registration process by the
図7は、制御メッセージログテーブル423の記憶内容例を示す説明図である。制御メッセージログテーブル423は、C−Planeパケットである制御メッセージごとに、制御メッセージの内容を記録するテーブルである。制御メッセージログには、制御メッセージごとに、エントリ番号と、タイムスタンプと、リファレンスポイントと、メッセージタイプと、IMSIと、原因(cause)と、送信IPと、宛先IPと、がある。 FIG. 7 is an explanatory diagram showing an example of the stored contents of the control message log table 423. The control message log table 423 is a table that records the content of the control message for each control message that is a C-Plane packet. The control message log includes an entry number, a time stamp, a reference point, a message type, an IMSI, a cause, a transmission IP, and a destination IP for each control message.
エントリ番号は、制御メッセージを一意に特定する情報である。タイムスタンプは、DPI装置206が制御メッセージを受信した時刻である。リファレンスポイントは、図2に示したように、制御メッセージをミラーリングした論理的な位置を示す情報である。具体的には、受信したIPパケットに含まれる送信IPアドレスと宛先IPアドレスと上位のプロトコルとの組み合わせで特定される。メッセージタイプは、制御メッセージの種類(接続要求など)を示す情報である。IMSIは、上述したように、携帯電話加入者であるユーザに発行される国際的な加入者識別番号である。原因(cause)は、通信の失敗や劣化原因を特定する情報である。メッセージタイプと原因との組み合わせにより、端末201/基地局202の通信品質劣化イベントやMME203の失敗(Failure)発生イベントが一意に特定される。
The entry number is information that uniquely identifies the control message. The time stamp is the time when the
たとえば、メッセージタイプが“UE CONTEXT RELEASE REQUEST message”で、かつ、原因(cause)が“radio−connection−with−ue−lost”である場合、端末201の通信品質劣化が特定される。また、たとえば、メッセージタイプが“SERVICE REJECT”で、かつ、原因(cause)が“Congestion”である場合、MME203のFailure発生が特定される。また、送信IPは、制御メッセージの送信側となる装置のIPアドレスであり、受信IPは、制御メッセージの受信側となる装置のIPアドレスである。ここでの装置は、基地局202または、MME203、またはS−GW204である。
For example, when the message type is “UE CONTEXT RELEASE REQUEST message” and the cause is “radio-connection-with-ue-lost”, the communication quality degradation of the terminal 201 is specified. For example, when the message type is “SERVICE REJECT” and the cause is “Congestion”, the occurrence of failure in the MME 203 is specified. The transmission IP is the IP address of the device that is the control message transmission side, and the reception IP is the IP address of the device that is the control message reception side. The apparatus here is the
図8は、パケットデータ群403の一例を示す説明図である。パケットデータ群403は、たとえば、Pcap(Packet capture)ファイルというファイル形式で、DPI装置206から送信される。ここでは、Pcapファイルに挙げてパケットデータ群403のデータ構造を説明するが、パケットデータ群403の形式は、Pcapファイルに限られない。パケットデータ群403は、RRD404に格納され、その後、品質劣化に該当する特定のパケットデータ群441,442が蓄積DB405に格納される。
FIG. 8 is an explanatory diagram showing an example of the
パケットデータ群403は、1つのPcapファイルヘッダ(Pcap file header)と、1つ以上のPcapパケットヘッダ(Pcap packet header)およびパケットデータ(Packet)の組み合わせと、を有する。Pcapファイルヘッダは、Pcapファイル全体のヘッダである。U−PlaneパケットおよびC−Planeパケットのいずれの場合においても、Pcapファイルヘッダは、Pcapファイルに含まれるパケットを特定する情報を有する。Pcapファイルヘッダは、たとえば、先頭のパケットのDPI装置206での受信時刻と、当該受信時刻から所定時間と、により、当該受信時刻から所定時間内のパケットが含まれていることを示す。
The
Pcapパケットヘッダには、パケットのDPI装置206での受信時刻、パケットのパケット長、パケットのキャプチャレングスが格納される。キャプチャレングスは、当該パケットをPcapファイルに含める場合にキャプチャしたパケット長である。たとえば、キャプチャレングスを先頭から64バイトと規定した場合、Pcapファイルにはパケットの先頭から64バイトまでのデータがパケットデータとしてPcapファイルに保持される。すなわち、パケット長がパケットそのもののデータ長であり、キャプチャレングスは、パケットからキャプチャされたパケットデータのデータ長である。パケットデータは、キャプチャレングスにしたがってパケットからキャプチャされたデータである。
In the Pcap packet header, the reception time of the packet at the
なお、C−Planeパケットの場合、Pcapパケットヘッダには、さらに、IMSIリストが格納される。IMSIリストには、C−Planeパケットである制御メッセージに関与するIMSIがDPI装置206により格納される。制御メッセージに関与するIMSIとは、たとえば、制御メッセージの送信元または宛先となる端末201のIMSIである。たとえば、1つのC−Planeパケットに1つの制御メッセージが含まれる場合には、その制御メッセージに関与するIMSIがIMSIリストに格納される。また、1つのC−Planeパケットに複数の制御メッセージが含まれる場合には、各制御メッセージに関与するIMSIがIMSIリストに格納される。
In the case of a C-Plane packet, an IMSI list is further stored in the Pcap packet header. In the IMSI list, the IMSI involved in the control message that is a C-Plane packet is stored by the
図4に戻り、作成部411は、HTTPログテーブル421を参照して、分布情報および基準値を作成し、基準値DB100に格納する。図1に示したように、分布情報は、ユーザのダウンロード先であるホストとユーザがダウンロードするデータの転送バイト数との組み合わせごとに作成される。
Returning to FIG. 4, the
図9は、分布情報の一例を示す説明図である。分布情報900は、ダウンロードしたデータの転送バイト数とホストとの組み合わせごとに作成される。分布情報900は、横軸がダウンロード時間、縦軸がダウンロード回数となるヒストグラムである。たとえば、HTTPログテーブル421のダウンロードしたデータの転送バイト数とホストとの組み合わせを示すエントリの数が縦軸のダウンロード回数として計数され、その各々のエントリのダウンロード時間が横軸にプロットされる。また、基準値は、ダウンロードしたデータの転送バイト数とホストとの組み合わせにおいて、ユーザの端末201とホストであるサーバ212との間の通信品質の判断となる指標値であり、たとえば、分布情報900の中央値である。また、基準値は、平均値または最頻値でもよい。
FIG. 9 is an explanatory diagram illustrating an example of distribution information. The
図4に戻り、算出部412は、基準値DB100、HTTPログテーブル421、およびTCP/UDPログテーブル422を用いて統計値を算出して、品質情報テーブル424を作成する。算出部412は、監視対象であるユーザの端末201、基地局202、およびMME203について、経時的に統計値を品質情報テーブル424に格納する。ここで、品質情報テーブル424について説明する。
Returning to FIG. 4, the
図10は、品質情報テーブル424の記憶内容例を示す説明図である。品質情報テーブル424は、監視対象ごとに経時的な統計値を格納するテーブルである。監視対象とは、通信品質を監視される通信装置(端末201、基地局202、MME203)である。端末201は、HTTPログテーブル421またはTCP/UDPログテーブル422のユーザ情報のIMSIおよびIMEISVにより特定される。また。基地局202は、HTTPログテーブル421またはTCP/UDPログテーブル422のユーザ情報の基地局202により特定される。また、MME203は、制御メッセージログの送信IPアドレスまたは宛先IPアドレスにより特定される。
FIG. 10 is an explanatory diagram showing an example of the contents stored in the quality information table 424. The quality information table 424 is a table for storing statistical values over time for each monitoring target. The monitoring target is a communication device (
統計値は、1単位時間おきに経時的に格納される。1単位時間は、1分、60分、3時間、12時間、1日など、管理者により設定可能な単位時間である。単位時間は、ユーザにより任意に設定可能である。ここで、端末201の統計値について説明する。 Statistical values are stored over time every other unit time. One unit time is a unit time that can be set by the administrator, such as 1 minute, 60 minutes, 3 hours, 12 hours, or 1 day. The unit time can be arbitrarily set by the user. Here, the statistical value of the terminal 201 will be described.
端末201の統計値は、QoE値と、無線区間応答品質と、有線区間応答品質と、劣化イベント数と、C−Plane失敗数と、を有する。QoE値は、ユーザが体感した通信品質を示す指標値である。算出部412は、QoE値を算出する。具体的には、たとえば、算出部412は、HTTPログテーブル421の中から、HTTPログテーブル421のユーザ情報に監視対象である端末201に関するIMSIおよびIMEISVが存在するエントリを特定する。つぎに、算出部412は、特定したエントリごとに、ホストおよび転送バイト数(下り)の組み合わせを特定する。
The statistical value of the terminal 201 includes a QoE value, a wireless section response quality, a wired section response quality, the number of degradation events, and the number of C-Plane failures. The QoE value is an index value indicating the communication quality experienced by the user. The
そして、算出部412は、当該組み合わせごとに、基準値DB100から分布情報900を取得して、当該組み合わせを特定したエントリのダウンロード時間と、取得した分布情報900の基準値と、を比較し、基準値比を算出する。基準値比は、たとえば、(取得した分布情報900の基準値)/(当該組み合わせを特定したエントリのダウンロード時間)で算出される。したがって、基準値比が大きいほど、通信品質がよいことを示す。
Then, the
このあと、算出部412は、基準値比の算出元のHTTPログのダウンロード時間と重複して同一ユーザの端末201がダウンロードしているHTTPログの数を計数する。計数結果を並列数と称す。算出部412は、基準値比に並列数を乗算することによりQoE値を算出する。QoE値は、HTTPログテーブル421のエントリごとに算出されるため、算出部412は、同一ユーザについてのエントリから得られた1つ以上のQoE値から、代表値となるQoE値を求める。代表値は、たとえば、当該1つ以上のQoE値の平均値、最大値、最小値、中央値、最頻値から採用される。いずれを採用するかは、あらかじめ設定しておけばよい。代表値となるQoE値が、その端末201のQoE値となる。
Thereafter, the
また、無線区間応答品質は、図2に示した無線区間の応答品質を示す評価値である。端末201スループットが大きくなると、データ量も大きくなるため、無線区間の応答品質が悪くなり、端末201自身が送信するデータの下り方向のデータによっても応答品質が悪くなる。しかし、検出装置207は、端末スループットがあらかじめ設定したしきい値以上なら、無線区間の応答品質は良いと判断し、しきい値未満なら無線区間の応答品質が悪いと判断する。たとえば、無線区間応答品質は、下記式(1)により算出される。
The wireless section response quality is an evaluation value indicating the response quality of the wireless section shown in FIG. When the terminal 201 throughput increases, the amount of data also increases, so that the response quality in the wireless section deteriorates, and the response quality also deteriorates due to the downlink data of the data transmitted by the terminal 201 itself. However, the
無線区間応答品質=端末スループット≧しきい値 0
端末スループット<しきい値 無線区間応答遅延・・・(1)
Radio section response quality = terminal throughput ≧
Terminal throughput <threshold value Radio section response delay (1)
端末スループットは、監視対象である端末201に関するIMSIおよびIMEISVが存在するTCP/UDPログテーブル422のエントリについて、統計情報のバイト数をフロー期間で除算することにより得られる。バイト数は、上りのバイト数または下りのバイト数のいずれを採用してもよい。また、上りのバイト数と下りのバイト数の和や平均を採用してもよい。また、フロー期間とは、そのエントリのタイムスタンプの終了時刻から開始時刻を引いた期間である。また、監視対象である端末201に関するIMSIおよびIMEISVが存在するTCP/UDPログテーブル422のエントリが複数存在する場合、各端末201のスループットの総和や平均を、端末201スループットとしてもよい。また、無線区間応答遅延は、TCP/UDPログテーブル422の無線区間応答遅延から取得される。無線区間応答品質は、その値が大きいほど品質が悪いことを示す。
The terminal throughput is obtained by dividing the number of bytes of statistical information by the flow period for the entry in the TCP / UDP log table 422 in which the IMSI and IMEISV relating to the terminal 201 to be monitored exist. As the number of bytes, either the number of upstream bytes or the number of downstream bytes may be adopted. Also, the sum or average of the number of upstream bytes and the number of downstream bytes may be employed. The flow period is a period obtained by subtracting the start time from the end time of the time stamp of the entry. Further, when there are a plurality of entries in the TCP / UDP log table 422 in which the IMSI and IMEISV relating to the terminal 201 to be monitored exist, the sum or average of the throughputs of the
有線区間応答品質は、図2に示した有線区間の応答品質を示す評価値である。有線区間応答遅延は、TCP/UDPログテーブル422の有線区間応答遅延から取得される。 The wired section response quality is an evaluation value indicating the response quality of the wired section shown in FIG. The wired section response delay is acquired from the wired section response delay in the TCP / UDP log table 422.
劣化イベント数は、劣化イベントの計数値である。劣化イベントとは、端末201の通信品質劣化と認識する制御メッセージ(C−Planeパケット)であり、通信品質劣化に関する制御メッセージの種類とその原因(cause)との組み合わせにより特定される。当該組み合わせは、制御メッセージログのメッセージタイプおよび原因(cause)により特定される。たとえば、制御メッセージが「UE CONTEXT RELEASE REQUEST message」であり、当該制御メッセージの原因(cause)「radio−connection−with−ue−lost」であれば、劣化イベントとなる。また、劣化イベント数は、劣化イベントを特定する制御メッセージとその原因(cause)との組み合わせ単位での計数値でもよく、それらの総和でもよい。 The number of degradation events is a count value of degradation events. The deterioration event is a control message (C-Plane packet) recognized as communication quality deterioration of the terminal 201, and is specified by a combination of the type of control message related to communication quality deterioration and the cause thereof. The combination is specified by the message type and cause of the control message log. For example, if the control message is “UE CONTEXT RELEASE REQUEST message” and the cause of the control message is “radio-connection-with-ue-lost”, a degradation event occurs. Further, the number of degradation events may be a count value in a combination unit of a control message for specifying a degradation event and a cause thereof, or may be a sum of them.
C−Plane失敗数は、その端末201が関与する制御メッセージのうちセッションの失敗に関する制御メッセージの計数値である。たとえば、メッセージタイプが“SERVICE REJECT message”、“ATTACH REJECT message”、“TRACKING AREA UPDATE REJECT message”のようにセッション確立を拒否されたメッセージの計数値である。C−Plane失敗数は、メッセージタイプごとに計数してもよく、それらの総和でもよい。 The C-Plane failure count is a count value of control messages related to session failure among control messages related to the terminal 201. For example, the message type is a count value of a message whose session establishment is rejected such as “SERVICE REJECT message”, “ATTACH REJECT message”, “TRACKING AREA UPDATE REJECT message”. The number of C-Plane failures may be counted for each message type or may be the sum of them.
つぎに、基地局202の統計値について説明する。基地局202のQoE値は、接続相手となる端末群のQoE値の代表値である。接続相手は、たとえば、HTTPログテーブル421のユーザ情報において、基地局202に対応付けられているIMSIおよびIMEISVにより特定される。また、ここでいう代表値とは、端末群のQoE値の平均値、最大値、最小値、中央値、最頻値から採用される。いずれを採用するかは、あらかじめ設定しておけばよい。
Next, statistical values of the
また、基地局202の無線区間応答品質も通信相手となる端末群の無線区間応答品質の代表値である。ここでいう代表値とは、端末群の無線区間応答品質の平均値、最大値、最小値、中央値、最頻値から採用される。いずれを採用するかは、あらかじめ設定しておけばよい。
Further, the wireless section response quality of the
また、基地局202の有線区間応答品質も通信相手となる端末群の有線区間応答品質の代表値である。ここでいう代表値とは、端末群の有線区間応答品質の平均値、最大値、最小値、中央値、最頻値から採用される。いずれを採用するかは、あらかじめ設定しておけばよい。
The wired section response quality of the
また、基地局202の劣化イベント数も通信相手となる端末群の劣化イベント数の代表値である。ここでいう代表値とは、端末群の劣化イベント数の平均値、最大値、最小値、中央値、最頻値から採用される。いずれを採用するかは、あらかじめ設定しておけばよい。また、劣化イベント数が、通信品質劣化に関する制御メッセージの種類とその原因(cause)との組み合わせ単位で計数される場合は、算出部412は、組み合わせごとに代表値を算出する。
Further, the number of deterioration events of the
また、基地局202のC−Plane失敗数も通信相手となる端末群のC−Plane失敗数の代表値である。ここでいう代表値とは、端末群のC−Plane失敗数の平均値、最大値、最小値、中央値、最頻値から採用される。いずれを採用するかは、あらかじめ設定しておけばよい。また、C−Plane失敗数が、通信品質劣化に関する制御メッセージの種類とその原因(cause)との組み合わせ単位で計数される場合は、算出部412は、組み合わせごとに代表値を算出する。
The number of C-Plane failures of the
MME203の統計値は、トラフィック量と失敗(Failure)発生数である。トラフィック量は、制御メッセージログの宛先IPがそのMME203であるエントリ数である。トラフィック量によりMME203での輻輳を検出することができる。 The statistical values of the MME 203 are the traffic volume and the number of failures. The traffic volume is the number of entries whose destination IP of the control message log is the MME 203. The congestion at the MME 203 can be detected based on the traffic amount.
失敗発生数は、MME203との通信で失敗が発生したと認識する制御メッセージの数であり、失敗発生に関する制御メッセージの種類とその原因(cause)との組み合わせにより特定される。当該組み合わせは、制御メッセージログのメッセージタイプおよび原因(cause)により特定される。たとえば、制御メッセージが「UE CONTEXT RELEASE COMMAND message」であり、当該制御メッセージの原因(cause)「load−balancing−tau−required」であれば、失敗発生のエントリとなる。また、失敗発生数は、失敗発生を特定する制御メッセージとその原因(cause)との組み合わせ単位での計数値でもよく、それらの総和でもよい。失敗発生数によりMME203で失敗発生を特定する制御メッセージがある場合の輻輳を検出することができる。 The number of failure occurrences is the number of control messages recognized as failure in communication with the MME 203, and is specified by a combination of the type of control message related to failure occurrence and its cause. The combination is specified by the message type and cause of the control message log. For example, if the control message is “UE CONTEXT RELEASE COMMAND message” and the cause of the control message is “load-balancing-tau-required”, the entry is a failure occurrence. Further, the number of failure occurrences may be a count value in a combination unit of a control message for specifying the failure occurrence and a cause thereof, or may be a sum of them. It is possible to detect congestion in the case where there is a control message that identifies the failure occurrence in the MME 203 based on the number of failure occurrences.
図4に戻り、検出部413は、品質情報テーブル424を参照して、品質劣化を検出する。検出部413は、品質情報テーブル424の監視対象単位で品質劣化を検出する。まず、端末201の品質劣化について説明する。
Returning to FIG. 4, the
図11は、端末201のQoE値の時間的変化を示すグラフである。図11(a)、(b)において、横軸は経過時間、縦軸は端末201のQoE値である。波形wは、端末201のQoE値の時間的変化を示す。波形wは、品質情報テーブル424における各単位時間の端末201のQoE値をプロットすることで作成される。T1はしきい値である。 FIG. 11 is a graph showing a temporal change in the QoE value of the terminal 201. 11A and 11B, the horizontal axis represents elapsed time, and the vertical axis represents the QoE value of the terminal 201. A waveform w shows a temporal change in the QoE value of the terminal 201. The waveform w is created by plotting the QoE value of the terminal 201 for each unit time in the quality information table 424. T1 is a threshold value.
(a)では、検出部413は、たとえば、波形wがしきい値T1以下となった場合(劣化検出ポイントA)に、その端末201の通信品質が劣化したことを検出する。また、検出部413は、たとえば、波形wがしきい値T1以下となったとき(劣化検出ポイントA)から所定時間x継続してしきい値T1以下である場合(劣化検出ポイントAとBの区間)に、その端末201の通信品質が劣化したことを検出することとしてもよい。
In (a), the detecting
また、(b)に示したように、検出部413は、たとえば、ある劣化検出ポイントC(たとえば、現在時刻)から過去所定時間xx(xxはあらかじめ設定した値)の間、波形wがしきい値T1以下となる期間がy%(yはあらかじめ設定した値)以上である場合に、その端末201の通信品質が劣化したことを検出することとしてもよい。
Further, as shown in (b), the
(c)は、劣化イベント数の時間的変化を示すグラフである。横軸は経過時間、縦軸は端末201の劣化イベント数である。劣化イベント数は、たとえば、セッションの“Close reason”で無線区間の問題で強制切断された回数を示す。棒グラフg2は、劣化イベント数であり、折れ線グラフg1は、劣化イベント数の区間和である。T2はしきい値である。(c)の例では、検出部413は、区間和である折れ線グラフg1が、しきい値T2以上となった場合(劣化検出ポイントD)に、端末201の通信品質が劣化したことを検出する。なお、区間和ではなく、単に棒グラフg2で示した劣化イベント数がしきい値T2以上となった場合に、端末201の通信品質が劣化したことを検出することとしてもよい。
(C) is a graph which shows the time change of the number of degradation events. The horizontal axis represents the elapsed time, and the vertical axis represents the number of degradation events of the terminal 201. The number of degradation events indicates, for example, the number of forcible disconnections due to a problem in the radio section in the session “Close reason”. The bar graph g2 is the number of deterioration events, and the line graph g1 is a section sum of the number of deterioration events. T2 is a threshold value. In the example of (c), the
また、監視対象がMME203の場合、(c)の縦軸および棒グラフを失敗発生数として、検出部413は、区間和の折れ線グラフが、しきい値T2以上となった場合に、MME203の通信品質が劣化したことを検出することとしてもよい。また、監視対象が基地局202の場合、(a)〜(c)に示した検出方法を用いればよい。
Further, when the monitoring target is the MME 203, the
(d)および(e)は、MME203のバースト検出をおこなう場合の例であり、MME203へのトラフィック量の時間的変化を示すグラフである。波形wは、MME203へのトラフィック量の時間的変化を示す。波形wは、品質情報テーブル424における各単位時間のMME203へのトラフィック量をプロットすることで作成される。T1はしきい値である。 (D) and (e) are examples in the case where burst detection of the MME 203 is performed, and are graphs showing temporal changes in the traffic amount to the MME 203. A waveform w shows a temporal change in the traffic amount to the MME 203. The waveform w is created by plotting the traffic amount to the MME 203 for each unit time in the quality information table 424. T1 is a threshold value.
(d)では、検出部413は、たとえば、波形wがしきい値T1以上となった場合(劣化検出ポイントA)に、そのMME203にバーストが発生、すなわち、通信品質の劣化要因が発生したことを検出する。また、検出部413は、たとえば、波形wがしきい値T1以上となったとき(劣化検出ポイントA)から所定時間x継続してしきい値T1以上である場合(劣化検出ポイントAとBの区間)に、そのMME203にバーストが発生したことを検出することとしてもよい。
In (d), for example, when the waveform w is equal to or greater than the threshold value T1 (deterioration detection point A), the
また、(e)に示したように、検出部413は、たとえば、ある劣化検出ポイントC(たとえば、現在時刻)から過去所定時間xx(xxはあらかじめ設定した値)の間、波形wがしきい値T1以上となる期間がy%(yはあらかじめ設定した値)以上である場合に、そのMME203にバーストが発生したことを検出することとしてもよい。
As shown in (e), for example, the
また、検出部413は、通信品質の劣化を検出した場合、制御データを生成して、格納部414に送信する。
In addition, when detecting deterioration in communication quality, the
図12は、検出部413によって生成される制御データを示す説明図である。制御データ1200は、エントリ番号と、対象機器種別と、対象機器IDと、取得期間と、格納対象情報と、を有し、エントリごとに、図11の監視対象を特定する。
FIG. 12 is an explanatory diagram showing control data generated by the
エントリ番号は、制御データ1200を一意に特定する識別情報である。対象機器種別は、制御データ1200によって制御される機器の種別である。制御データ1200では、端末201(UE)、MME203、または基地局202が制御対象となる。対象機器IDは、対象機器種別の機器を一意に特定する識別情報である。たとえば、対象機器種別が端末201の場合、対象機器IDはIMSI(例としてimsi1)であり、MME203の場合、MME203に割り当てられたIPアドレス(例としてip(mmi1))である。
The entry number is identification information that uniquely identifies the
取得期間は、ログ400およびパケットデータ群403をRRD404から取得する時間的範囲を特定する情報である。取得期間は、開始時刻と終了時刻を有し、開始時刻から終了時刻までの範囲のログ400およびパケットデータ群403が取得されることになる。取得期間は、たとえば、図11および図12に示した劣化検出ポイントA〜Dを基準にして検出部413により決定される。取得期間の具体例については、図14において後述する。
The acquisition period is information specifying a time range for acquiring the
格納対象情報は、RRD404に格納されたログ400およびパケットデータ群403のうち、特定の種別のログ(HTTPログ431,TCP/UDP432)および特定のパケットデータ群441,442を抽出するフィルタである。格納対象情報は、タイプと対象とを有する。タイプとは、格納対象の種別であり、たとえば、端末201(UE)、基地局202(eNB)、端末201の通信相手(たとえば、サーバ212)がある。対象とは、種別に該当する個々の機器を特定する情報であり、端末201の場合はIMSI、基地局202の場合は基地局IDで特定される。
The storage target information is a filter that extracts a specific type of log (HTTP log 431, TCP / UDP 432) and a specific
ここで、格納対象情報の設定方法について説明する。まず、対象機器種別が端末201の場合について説明する。統計値の無線区間応答品質がしきい値以上(または、最新データからさかのぼって複数の単位時間で連続してしきい値以上)である場合、端末201が接続する基地局202の通信品質に問題があると判断して、エントリEcs1に示したように、タイプには基地局(eNB)、対象には基地局202を一意に特定する基地局ID(eNB1)が格納される。これにより、端末(imsi1)が接続する基地局(eNB1)を通過したトラフィック(U−Planeパケット)を抽出することができる。
Here, a method for setting the storage target information will be described. First, a case where the target device type is the terminal 201 will be described. If the wireless section response quality of the statistical value is equal to or higher than a threshold (or higher than the threshold continuously for a plurality of unit times from the latest data), there is a problem with the communication quality of the
また、統計値の無線区間応答品質がしきい値未満(または、最新データからさかのぼって複数の単位時間のいずれかでしきい値未満)である場合、端末201の通信品質に問題があると判断して、エントリEcs2に示したように、タイプには端末(UE)、対象には端末201を一意に特定する機器ID(imsi2)が格納される。これにより、端末(imsi2)のトラフィック(U−Planeパケット)のログを抽出することができる。 Further, if the wireless section response quality of the statistical value is less than the threshold value (or less than the threshold value in any of a plurality of unit times from the latest data), it is determined that there is a problem in the communication quality of the terminal 201. Then, as shown in the entry Ecs2, the type stores the terminal (UE), and the target stores the device ID (imsi2) that uniquely identifies the terminal 201. Thereby, the log of the traffic (U-Plane packet) of the terminal (imsi2) can be extracted.
また、統計値の有線区間応答品質がしきい値以上(または、最新データからさかのぼって複数の単位時間で連続してしきい値以上)である場合、端末201の通信相手の通信品質に問題があると判断して、エントリEcs3に示したように、タイプには通信相手であるサーバ(SV)、対象にはサーバを一意に特定するサーバのIPアドレス(ipsv2)が格納される。これにより、端末201と通信するサーバ212のトラフィック(U−Planeパケット)のログを抽出することができる。また、統計値の無線区間応答品質がしきい値未満(または、最新データからさかのぼって複数の単位時間のいずれかでしきい値未満)である場合については、無線区間応答品質と同じであるため、説明を省略する。
Further, when the wired section response quality of the statistical value is equal to or higher than a threshold value (or continuously higher than the threshold value in a plurality of unit times from the latest data), there is a problem with the communication quality of the communication partner of the terminal 201. As shown in the entry Ecs3, the type stores the server (SV) that is the communication partner, and the target stores the IP address (ipsv2) of the server that uniquely identifies the server. Thereby, the log of the traffic (U-Plane packet) of the
図13は、図12に示した取得期間の決定例を示す説明図である。(a)は、図11(a)により劣化検出された場合の取得期間の決定例を示す。(a)では、劣化検出ポイントAから所定のα時間(α≧0)遡った時刻を、取得期間の開始時間とし、波形wが再度しきい値T1以上となった時点A’からα時間経過した時刻を、取得期間の終了時刻とする。 FIG. 13 is an explanatory diagram illustrating an example of determining the acquisition period illustrated in FIG. FIG. 11A shows an example of determining the acquisition period when deterioration is detected according to FIG. In (a), a time that is a predetermined α time (α ≧ 0) before the deterioration detection point A is set as the start time of the acquisition period, and α time has elapsed from the time point A ′ when the waveform w becomes equal to or higher than the threshold value T1. This time is set as the end time of the acquisition period.
(b)は、しきい値T1よりも高いしきい値T3を設定しておき、波形wが劣化検出ポイントA以前にしきい値T3以下となったポイントA3を、取得期間の開始時間とし、波形wが再度しきい値T1以上となった時点A’の後に波形wがしきい値T3以上になった時点A3’を、取得期間の終了時刻とする。また、図11(b)により劣化検出された場合は、図11(b)に示した区間xxを取得期間としてもよく、また区間xxの前後のα時間を含めて取得期間としてもよい。 In (b), a threshold value T3 higher than the threshold value T1 is set, a point A3 where the waveform w is equal to or lower than the threshold value T3 before the deterioration detection point A is set as the start time of the acquisition period, and the waveform The time point A3 ′ when the waveform w becomes equal to or higher than the threshold value T3 after the time point A ′ when the w value becomes equal to or higher than the threshold value T1 is set as the end time of the acquisition period. When deterioration is detected in FIG. 11B, the section xx shown in FIG. 11B may be set as the acquisition period, or the acquisition period may include the α times before and after the section xx.
(c)は、図11(d)により劣化検出された場合の取得期間の決定例を示す。(d)では、劣化検出ポイントAから所定のα時間(α≧0)遡った時刻を、取得期間の開始時間とし、波形wが再度しきい値T1未満となった時点A’からα時間経過した時刻を、取得期間の終了時刻とする。 FIG. 11C shows an example of determining the acquisition period when deterioration is detected according to FIG. In (d), the time that is a predetermined α time (α ≧ 0) after the deterioration detection point A is set as the start time of the acquisition period, and α time has elapsed from the time point A ′ when the waveform w becomes less than the threshold value T1 again. This time is set as the end time of the acquisition period.
(d)は、しきい値T1よりも低いしきい値T3を設定しておき、波形wが劣化検出ポイントA以前にしきい値T3以上となったポイントA3を、取得期間の開始時間とし、波形wが再度しきい値T1未満となった時点A’の後に波形wがしきい値T3以下となった時点A3’を、取得期間の終了時刻とする。また、図11(e)により劣化検出された場合は、図11(e)に示した区間xxを取得期間としてもよく、また区間xxの前後のα時間を含めて取得期間としてもよい。 In (d), a threshold value T3 lower than the threshold value T1 is set, a point A3 where the waveform w is equal to or higher than the threshold value T3 before the deterioration detection point A is set as the start time of the acquisition period, and the waveform The time point A3 ′ when the waveform w becomes equal to or lower than the threshold value T3 after the time point A ′ when the w value again becomes less than the threshold value T1 is set as the end time of the acquisition period. In addition, when deterioration is detected in FIG. 11 (e), the section xx shown in FIG. 11 (e) may be used as the acquisition period, or the acquisition period may include the α times before and after the section xx.
図14は、図11(c)により劣化検出された場合の取得期間の決定例を示す。(a)では、劣化検出ポイントDより前で、最初に劣化イベントが検出された時点D1を取得期間の開始時刻とし、劣化検出ポイントDの後で、最後に劣化イベントが検出された時点D2を取得期間の終了時刻とする。 FIG. 14 shows an example of determining the acquisition period when deterioration is detected according to FIG. In (a), the time point D1 when the deterioration event is first detected before the deterioration detection point D is set as the start time of the acquisition period, and the time point D2 when the deterioration event is detected last after the deterioration detection point D The end time of the acquisition period.
(b)では、劣化検出ポイントDを含むフローf1を基準にして取得期間が決定される。具体的には、フローf1より前に発生したフローf0に劣化イベントがあり、かつ、フローf1と重複時間が存在する場合、フローf0を取得期間に含める。フローf0より前のフロー(不図示)についても同様である。また、フローf1より後に発生したフローf2に劣化イベントがあり、かつ、フローf1と重複時間が存在する場合、フローf2を取得期間に含める。フローf2より後のフロー(不図示)についても同様である。(d)の場合、フローf0、f2が取得期間に含まれるため、フローf0の開始時刻を取得期間の開始時刻とし、フローf2の終了時刻を取得期間の終了時刻とする。より簡素に、例えば、最初に劣化イベントが検出された時点で流れているフローf0,f1のうち開始時刻の最も古い時刻が取得期間の開始時刻とし、最後に劣化イベントが検出された時点で流れているフローf1,f2のうち終了時刻の最も新しい時刻が取得期間の終了時刻としてもよい。なお、図13(a)の場合においても同様に、フローの開始時刻と終了時刻を取得期間の開始時刻と終了時刻としてもよい。すなわち、品質劣化時刻AA’間に流れるフローのうち最も古い開始時刻を取得期間の開始時刻とし、フローのうち最も新しい終了時刻を取得期間の終了時刻とする。 In (b), the acquisition period is determined based on the flow f1 including the deterioration detection point D. Specifically, if there is a deterioration event in the flow f0 generated before the flow f1 and there is an overlapping time with the flow f1, the flow f0 is included in the acquisition period. The same applies to a flow (not shown) before the flow f0. Also, if there is a degradation event in the flow f2 that occurs after the flow f1, and there is an overlap time with the flow f1, the flow f2 is included in the acquisition period. The same applies to a flow (not shown) after the flow f2. In the case of (d), since the flows f0 and f2 are included in the acquisition period, the start time of the flow f0 is set as the start time of the acquisition period, and the end time of the flow f2 is set as the end time of the acquisition period. More simply, for example, the oldest start time of the flows f0 and f1 flowing when a deterioration event is first detected is the start time of the acquisition period, and flows when a deterioration event is detected last. The latest end time of the flows f1 and f2 may be the end time of the acquisition period. Similarly, in the case of FIG. 13A, the start time and end time of the flow may be used as the start time and end time of the acquisition period. That is, the oldest start time of the flows flowing between the quality deterioration times AA ′ is set as the start time of the acquisition period, and the latest end time of the flows is set as the end time of the acquisition period.
<基準値DB作成処理例>
図15は、作成部411による基準値DB作成処理例を示すフローチャートである。作成部411は、HTTPログテーブル421を取得し(ステップS1501)、不適切なフローを除外する(ステップS1502)。HTTPログテーブル421の個々のエントリはフローを示しているため、作成部411は、HTTPログテーブル421のエントリごとに、当該エントリが不適切なフローであるか否かを判断する。たとえば、作成部411は、リクエストコードがデータをダウンロードしないリクエストコードであるエントリを除外する。また、作成部411は、転送バイト数が0であるエントリも除外してもよい。
<Reference value DB creation processing example>
FIG. 15 is a flowchart illustrating an example of reference value DB creation processing by the
次に、作成部411は、フローをサービス単位で集約する(ステップS1503)。ここで、サービスは、HTTPログテーブル421のホストおよび転送バイト数(下り)の組み合わせで特定される。すなわち、端末201がホストから何バイトのデータをダウンロードしたかを示す。作成部411は、エントリをサービス単位でグループ分けすることで、フローをサービス単位で集約する。
Next, the
次に、作成部411は、集約されたサービスごとのエントリ群について、エントリ数が少ないサービスのエントリ群を削除する(ステップS1504)。具体的には、たとえば、作成部411は、エントリ数がしきい値以下となるサービスのエントリ群を削除してもよく、下位からx番目までのエントリ数であるサービスのエントリ群を削除してもよい。
Next, the
次に、作成部411は、サービス単位で基準値を算出する(ステップS1505)。具体的には、たとえば、図1または図9に示したように、作成部411は、横軸に各エントリのダウンロード時間、縦軸にダウンロード回数をプロットしてサービス単位の分布情報900を作成する。ダウンロード時間は、各エントリの統計情報のダウンロード時間により特定される。ダウンロード回数は、エントリの数により特定される。これにより、サービス単位の分布情報900が作成される。作成部411は、分布情報900ごとに基準値を算出する。上述したように、基準値は、分布情報900が示すヒストグラムについての平均値、中央値、最頻値などの値として算出される。
Next, the
このあと、作成部411は、サービスごとに、分布情報900および基準値の組み合わせを基準値DB100に登録する(ステップS1506)。これにより、通信品質の劣化の基準を得ることができる。
Thereafter, the
なお、図15のフローチャートに示した処理は、検出装置207による運用開始前または運用開始当初に実行してもよく、また、任意の運用中の任意のタイミングで実行することとしてもよい。運用中に実行する場合は、HTTPログの全エントリを用いてもよく、また、タイムスタンプの受信時刻が直近のエントリのみ用いて実行してもよい。
Note that the processing shown in the flowchart of FIG. 15 may be executed before or at the beginning of operation by the
<品質情報テーブル424の作成処理例1>
図16は、算出部412による品質情報テーブル424の作成処理例1を示すフローチャートである。図16では、監視対象が端末201または基地局202の場合の作成処理例を示す。まず、算出部412は、HTTPログテーブル421のエントリを監視対象別に分類する(ステップS1601)。監視対象については、各エントリのユーザ情報により特定することができる。
<Example 1 of Creating Quality Information Table 424>
FIG. 16 is a flowchart illustrating a processing example 1 for creating the quality information table 424 by the
つぎに、算出部412は、分類された監視対象群の中に未選択の監視対象があるか否かを判断する(ステップS1602)。未選択の監視対象がある場合(ステップS1602:Yes)、算出部412は、未選択の監視対象を選択する(ステップS1603)。そして、算出部412は、選択監視対象についてQoE値算出処理を実行する(ステップS1604)。QoE値算出処理(ステップS1604)については図17で説明する。QoE値算出処理(ステップS1604)により算出された選択監視対象のQoE値は、選択監視対象のエントリの最新データの列に格納される。なお、選択監視対象が基地局202の場合、選択監視対象のQoE値は、基地局202の接続相手となる各端末201のQoE値の代表値となる。
Next, the
つぎに、算出部412は、選択監視対象の無線区間応答品質を算出する(ステップS1605)。無線区間応答品質は、上述した式(1)により算出される。算出された無線区間応答品質は、選択監視対象のエントリの最新データの列に格納される。なお、選択監視対象が基地局202の場合、選択監視対象の無線区間応答品質は、基地局202の接続相手となる各端末201の無線区間応答品質の代表値となる。
Next, the
そして、算出部412は、有線区間応答品質を算出する(ステップS1606)。有線区間応答品質は、TCP/UDPログテーブル422の選択監視対象についての有線区間応答遅延である。有線区間応答品質は、選択監視対象のエントリの最新データの列に格納される。なお、選択監視対象が基地局202の場合、選択監視対象の有線区間応答品質は、基地局202の接続相手となる各端末201の有線区間応答品質の代表値となる。
Then, the
つぎに、算出部412は、選択監視対象の劣化イベント数を算出する(ステップS1607)。選択監視対象の劣化イベントは、選択監視対象のIMSIを含む制御メッセージログテーブル423のエントリについて、通信品質劣化に関する制御メッセージのメッセージタイプとその原因(cause)との組み合わせである。したがって、算出部412は、当該組み合わせを計数する。算出部412は、組み合わせごとに計数してもよく、組み合わせごとに計数された計数値の総和を劣化イベント数としてもよい。劣化イベント数は、選択監視対象のエントリの最新データの列に格納される。なお、選択監視対象が基地局202の場合、選択監視対象の劣化イベント数は、基地局202の接続相手となる各端末201の劣化イベント数の代表値となる。
Next, the
つぎに、算出部412は、制御メッセージログテーブル423を参照して、選択監視対象のC−Plane失敗数を算出する(ステップS1608)。具体的には、たとえば、算出部412は、選択監視対象である端末201が関与する制御メッセージのうちセッションの失敗に関する制御メッセージを計数して、選択監視対象のC−Plane失敗数とする。C−Plane失敗数は、メッセージタイプごとに計数してもよく、それらの総和でもよい。C−Plane失敗数は、選択監視対象のエントリの最新データの列に格納される。なお、選択監視対象が基地局202の場合、選択監視対象のC−Plane失敗数は、基地局202の接続相手となる各端末201のC−Plane失敗数の代表値となる。
Next, the
ステップS1608のあと、ステップS1602に戻る。そして、算出部412は、未選択の監視対象がない場合(ステップS1602:No)、一連の処理を終了する。なお、選択監視対象について、QoE値、無線区間応答品質、有線区間応答品質、劣化イベント数、およびC−Plane失敗数が最新データの列に格納される場合、すでに最新データの列に格納済みの値は、1単位時間前の列にシフトする。同様に、1単位時間前の列に格納済みの値は、2単位時間前の列にシフトする。このように、n(1以上の整数)単位時間前の列の値は、n+1単位時間前の列にシフトすることになる。
After step S1608, the process returns to step S1602. If there is no unselected monitoring target (step S1602: No), the
<QoE値算出処理>
図17は、図16に示したQoE値算出処理(ステップS1604)の一例を示すフローチャートである。まず、算出部412は、選択監視対象について分類されたHTTPログテーブル421のエントリ群に未選択エントリがあるか否かを判断する(ステップS1701)。未選択エントリがある場合(ステップS1701:Yes)、算出部412は、未選択エントリを選択する(ステップS1702)。そして、算出部412は、選択エントリに該当するホストを当該エントリから取得する(ステップS1703)。たとえば、算出部412は、選択エントリが図6のエントリEh1である場合、ホストとしてsv1を取得する。
<QoE value calculation processing>
FIG. 17 is a flowchart illustrating an example of the QoE value calculation process (step S1604) illustrated in FIG. First, the
つぎに、算出部412は、選択エントリの転送バイト数(下り)およびダウンロード時間を取得する(ステップS1704)。たとえば、算出部412は、選択エントリが図6のエントリEh1である場合、転送バイト数(下り)としてnbdt1、ダウンロード時間としてdlt1を取得する。
Next, the
そして、算出部412は、取得したホストおよび取得した転送バイト数(下り)の組み合わせに該当する分布情報900を基準値DB100から取得する(ステップS1705)。たとえば、算出部412は、選択エントリが図6のエントリEh1である場合、ホストsv1および転送バイト数(下り)nbdt1の組み合わせに該当する分布情報900を基準値DB100から取得する。
Then, the
つぎに、算出部412は、取得したダウンロード時間と取得した分布情報900により基準値比を算出する(ステップS1706)。たとえば、算出部412は、選択エントリが図6のエントリEh1である場合、取得したダウンロード時間dlt1を、取得した分布情報900の基準値で除算することにより基準値比を算出し、算出した基準値比をエントリEh1の統計情報に格納する。
Next, the
そして、算出部412は、選択エントリについて並列数を算出する(ステップS1707)。図6のエントリEh1〜Eh3を例に挙げると、選択監視対象がimsi1およびimeisv1で特定される端末201であり、選択エントリがEh1である場合、並列数の算出対象となるエントリは、ユーザ情報にimsi1およびimeisv1が存在するEh2である。
Then, the
そして、算出部412は、エントリEh1のタイムスタンプで特定されるダウンロード区間である開始時刻ts1〜終了時刻te1と、エントリEh2のタイムスタンプで特定されるダウンロード区間である開始時刻ts2〜終了時刻te2と、を比較する。両区間が少なくとも一部重複する場合、両エントリEh1、Eh2は重複していることになるため、並列数は「2」となる。一方、重複していない場合、選択エントリEh1のみとなるため、並列数は「1」となる。
Then, the
このあと、算出部412は、選択エントリのQoE値を算出し(ステップS1708)、ステップS1701に戻る。選択エントリのQoE値は、たとえば、下記式(2)により算出される。
Thereafter, the
選択エントリのQoE値=選択エントリの基準値比×選択エントリの並列数・・(2) QoE value of selected entry = reference value ratio of selected entry × parallel number of selected entries (2)
ステップS1701において、未選択エントリがない場合(ステップS1701:No)、算出部412は、選択監視対象のQoE値を算出する(ステップS1709)。具体的には、たとえば、算出部412は、同一ユーザについてのエントリから得られた1つ以上のQoE値から、代表値となるQoE値を求める。
If there is no unselected entry in step S1701 (step S1701: No), the
代表値は、たとえば、当該1つ以上のQoE値の平均値、最大値、最小値、中央値、最頻値から採用される。いずれを採用するかは、あらかじめ設定しておけばよい。代表値となるQoE値が、その端末201のQoE値となる。このあと、図16のステップS1605に移行する。このように、図17に示したQoE値算出処理(ステップS1604)により、選択監視対象が端末201または基地局202である場合のQoE値を算出することができる。
For example, the representative value is adopted from an average value, a maximum value, a minimum value, a median value, and a mode value of the one or more QoE values. Which one should be adopted may be set in advance. The QoE value that is the representative value is the QoE value of the terminal 201. Thereafter, the process proceeds to step S1605 in FIG. As described above, the QoE value when the selected monitoring target is the terminal 201 or the
<品質情報テーブル424の作成処理例2>
図18は、算出部412による品質情報テーブル424の作成処理例2を示すフローチャートである。図18では、監視対象がMME203の場合の作成処理例を示す。まず、算出部412は、制御メッセージログテーブル423のエントリを監視対象であるMME203別に分類する(ステップS1801)。具体的には、たとえば、算出部412は、制御メッセージログテーブル423の宛先IPに格納されているMME203のIPアドレスにより、制御メッセージログテーブル423のエントリをMME203別に分類する。
<Example 2 of Creating Quality Information Table 424>
FIG. 18 is a flowchart illustrating a processing example 2 for creating the quality information table 424 by the
つぎに、算出部412は、未選択の監視対象があるか否かを判断する(ステップS1802)。未選択の監視対象がある場合(ステップS1802:Yes)、算出部412は、未選択の監視対象を選択し(ステップS1803)、制御メッセージログテーブル423を参照して、選択監視対象のMME203のトラフィック量を算出する(ステップS1804)。具体的には、たとえば、算出部412は、選択監視対象であるMME203の宛先IPが存在するエントリの数をトラフィック量として算出する。なお、選択監視対象のトラフィック量は、選択監視対象のエントリの最新データの列に格納される。
Next, the
そして、算出部412は、選択監視対象について失敗(Failure)発生数を算出し(ステップS1805)、ステップS1802に戻る。制御メッセージログのメッセージタイプおよび原因(cause)の組み合わせにより失敗発生を示すエントリが特定される。たとえば、制御メッセージが「UE CONTEXT RELEASE COMMAND message」であり、当該制御メッセージの原因(cause)「load−balancing−tau−required」であれば、失敗発生のエントリとなる。
Then, the
算出部412は、選択監視対象のMME203についての失敗発生を示すエントリを計数することで、選択監視対象の失敗発生数を算出する。また、失敗発生数は、失敗発生を特定する制御メッセージとその原因(cause)との組み合わせ単位での計数値でもよく、それらの総和でもよい。なお、選択監視対象の失敗発生数は、選択監視対象のエントリの最新データの列に格納される。
The
また、ステップS1802において、未選択の監視対象がない場合(ステップS1802:No)、一連の処理を終了する。なお、図16に示した処理と図18に示した処理は同一のタイミングで実行してもよく、異なるタイミングで実行してもよい。 In step S1802, if there is no unselected monitoring target (step S1802: No), the series of processing is terminated. The process shown in FIG. 16 and the process shown in FIG. 18 may be executed at the same timing or may be executed at different timings.
<劣化検出処理例>
図19は、検出部413による劣化検出処理例を示すフローチャートである。ここでは、監視対象が端末201または基地局202の場合、劣化検出に用いられる統計値は、QoE値または劣化イベント数であり、監視対象がMME203である場合、劣化検出に用いられる統計値は、トラフィック量または失敗発生数となる。
<Example of deterioration detection processing>
FIG. 19 is a flowchart illustrating an example of deterioration detection processing by the
まず、検出部413は、品質情報テーブル424を参照して、未選択の監視対象があるか否かを判断する(ステップS1901)。未選択の監視対象がある場合(ステップS1901:Yes)、検出部413は、未選択の監視対象を選択し(ステップS1902)、選択監視対象の統計値の時系列データを、品質情報テーブル424の選択監視対象のエントリから取得する(ステップS1903)。統計値の時系列データとは、最新データから所定の単位時間分までの統計値の列である。
First, the
そして、検出部413は、取得したQoE値の時系列データに基づいて、通信品質が劣化したか否かを判断する(ステップS1904)。当該判断は、上述した図11に示したように行われる。劣化していない場合(ステップS1904:No)、ステップS1901に戻り、劣化した場合(ステップS1904:Yes)、検出部413は、格納部414に送信する制御データ1200用のエントリを生成して(ステップS1905)、劣化検出された監視対象の端末側IPおよび対象機器ID(IMSI)を、生成したエントリに設定する(ステップS1906)。
Then, the
また、検出部413は、劣化検出時刻に基づいて、取得期間を生成して、生成したエントリに設定する(ステップS1907)。具体的には、たとえば、検出部413は、図13および図14に示したように、取得期間を生成する。そして、検出部413は、上述したように、選択監視対象の無線区間応答品質および有線区間応答品質に基づいて、格納対象情報を生成して、生成したエントリに設定して(ステップS1908)、ステップS1901に戻る。
Further, the
このあと、検出部413は、未選択の監視対象がない場合(ステップS1901:No)、制御データ1200を格納部414に出力して(ステップS1909)、一連の処理を終了する。
Thereafter, when there is no unselected monitoring target (step S1901: No), the
<格納処理例>
図20は、格納部414による格納処理例を示すフローチャートである。格納部414は、検出部413から制御データ1200を取得し(ステップS2001)、制御データ1200において未選択のエントリがあるか否かを判断する(ステップS2002)。未選択のエントリがある場合(ステップS2002:Yes)、格納部414は、未選択のエントリを選択する(ステップS2003)。そして、格納部414は、選択エントリに該当するエントリを、TCP/UDPログテーブル422およびHTTPログテーブル421から取得し、蓄積DB405に格納する(ステップS2004)。
<Example of storage processing>
FIG. 20 is a flowchart illustrating an example of storage processing by the
具体的には、格納部414は、取得期間の期間内において、機器対象種別および対象機器IDにより特定される機器および格納対象情報により特定される機器に関するトラフィックに関するログを取得して、蓄積DB405に格納する。たとえば、選択エントリが図12のエントリEcs1の場合、取得期間(開始時刻tsc1、終了時刻tec1)の区間での端末201(imsi1)が接続した基地局202(eNB1)を通過したトラフィック(U−Planeパケット)のログが抽出される。
Specifically, the
なお、ステップS1904は、ログだけでなく、当該ログに該当するパケットデータをU−Planeパケットデータ群403から抽出して、蓄積DB405に格納してもよい。抽出対象となるU−Planeパケットデータは、抽出されたログのタイムスタンプや端末側IP、サーバ側IP、リクエストコード、レスポンスコードなどにより特定される。これにより、図8に示したように、品質劣化に該当するU−PlaneパケットデータをRRD404から蓄積DB405に格納することができる。
In step S1904, not only the log but also packet data corresponding to the log may be extracted from the U-Plane
また、格納部414は、選択エントリの対象機器種別が端末201(UE)であるか否かを判断する(ステップS2005)。端末201でない場合(ステップS2005:No)、ステップS2002に戻る。一方、端末201である場合(ステップS2005:Yes)、対象機器IDで特定される端末201のC−Plane失敗数の時系列データを、品質情報テーブル424から取得する(ステップS2006)。C−Plane失敗数の時系列データとは、最新データから所定の単位時間分までのC−Plane失敗数の列である。
Further, the
そして、格納部414は、C−Plane失敗数の時系列データにより、C−Planeパケットを特定した端末201が関与するC−Planeパケットデータを蓄積DB405に格納すべきか否かを判断する(ステップS2007)。たとえば、C−Plane失敗数の時系列データについて、最新データから連続してC−Plane失敗数が所定数以上である場合、通信品質に問題があると判断して、格納部414は、格納対象にすべきと判断する。
Then, the
格納すべきでない場合(ステップS2007:No)、ステップS2002に戻る。一方、格納すべきである場合(ステップS2007:Yes)、格納部414は、RRD404のC−Planeパケットデータ群403から、C−Plane失敗数の時系列データに対応する時間帯に該当し、かつ、C−Plane失敗数に該当する端末201の機器ID(IMSI)をIMSIリストに含むC−Planeパケットデータを取得して、蓄積DB405に格納する(ステップS2008)。
When it should not be stored (step S2007: No), the process returns to step S2002. On the other hand, if it should be stored (step S2007: Yes), the
このように、C−Planeパケットデータ群403にIMSIリストを埋め込んでおくことにより、通信失敗に関与する端末201のC−Planeパケットデータを取得することができる。したがって、通信失敗に関与する端末201のC−Planeパケットデータを分析することにより、どの端末201がどのように通信失敗となったかという要因を特定することができる。このあと、ステップS2002に戻る。ステップS2002において、未選択エントリがない場合(ステップS2002:No)、一連の処理を終了する。
In this way, by embedding the IMSI list in the C-Plane
このように、本実施例によれば、監視対象の統計値を単位時間ごとに保存しておき、あらたに統計値を取得した場合に、過去の統計値の時系列データと比較することにより、通信品質の劣化の兆候を捉えることができる。そして、劣化に該当する特定のログをRRD404から蓄積DB405に格納することにより、劣化要因の分析に必要な記憶容量の低減化を図ることができる。すなわち、保存期間が限られているRRD404にある各種テーブル421〜424を用いて、品質劣化に関する特定のログを蓄積DB405に退避させることができる。すなわち、蓄積DB405への格納対象は、常にRRD404に残存するログから特定されるため、品質劣化に関する特定のログをRRD404が消去してしまうという誤消去を防止することができる。
As described above, according to the present embodiment, the statistical value to be monitored is stored for each unit time, and when the statistical value is newly obtained, by comparing with the time series data of the past statistical value, Can detect signs of communication quality degradation. Then, by storing a specific log corresponding to deterioration from the
また、統計値としてQoE値を用いることにより、劣化イベントが発生していない場合でも、ユーザが体感した通信品質を客観的に特定して、通信品質の劣化を検出することができる。また、統計値として、劣化イベント数や失敗発生数を用いることにより、トラフィックで発生した劣化イベント数や失敗発生数に応じて通信品質の劣化を検出することができる。 Further, by using the QoE value as the statistical value, it is possible to objectively specify the communication quality experienced by the user and detect the deterioration of the communication quality even when the deterioration event has not occurred. Further, by using the number of degradation events and the number of failures as statistical values, it is possible to detect communication quality degradation in accordance with the number of degradation events and the number of failures occurring in traffic.
また、ログの取得範囲を、通信品質の劣化が検出されたタイミングだけでなく、それ以前または/およびそれ以後の期間を含めて、取得範囲内のログを蓄積DB405に格納することにより、通信品質の劣化を経時的に分析することができる。また、通信品質の劣化が検出されたときのトラフィックにおけるフロー継続期間に応じて、ログの取得範囲を決定することにより、フローにおけるシーケンスに絞り込んでログを取得することができる。したがって、劣化要因の分析を効率的におこなうことができる。
In addition, the log acquisition range includes not only the timing at which degradation of communication quality is detected, but also the log within the acquisition range including the period before and / or after that, in the
また、フロー継続期間と他のフローの継続期間とが重複する場合、当該フローと他のフローとの間に関連性がある場合がある。このような場合でも、他のフロー継続期間もログの取得範囲に含めることにより、両フロー継続期間のログをまとめて取得することができる。したがって、両フローのログを参照して、劣化要因の分析を効率的におこなうことができる。 In addition, when the flow continuation period and the continuation period of another flow overlap, there may be a relationship between the flow and the other flow. Even in such a case, logs of both flow continuation periods can be acquired together by including other flow continuation periods in the log acquisition range. Therefore, degradation factors can be efficiently analyzed with reference to the logs of both flows.
また、統計値としてMMEへの流入トラフィック量を経時的に算出することにより、バースト発生を検出することができる。したがって、バースト発生に関与するログを蓄積DB405に格納することにより、バーストトラフィックについての劣化要因の分析を効率的におこなうことができる。
Moreover, burst generation can be detected by calculating the inflow traffic amount to the MME over time as a statistical value. Therefore, by storing the log related to the occurrence of the burst in the
また、ログを取得する際に、端末201と基地局202との無線区間応答品質を用いることにより、ログの格納対象を絞り込むことができる。たとえば、無線区間の応答品質がしきい値以上である場合、端末201自体の通信品質には問題がなく、端末201が接続する基地局202の通信品質に問題があると判断する。したがって、接続相手の基地局202が関与するログをRRD404から取得して蓄積DB405に格納することにより、接続相手の基地局202が関与するログ(他の端末と接続したフローのログも含む)に絞り込んで劣化要因の分析を効率的におこなうことができる。また、しきい値未満の場合は、端末201の通信品質に問題があるため、端末201が関与するログを取得して蓄積DB405に格納することにより、端末201に絞り込んで劣化要因の分析を効率的におこなうことができる。
Further, when acquiring the log, the log storage target can be narrowed down by using the wireless section response quality between the terminal 201 and the
また、ログを取得する際に、端末201とサーバ212との有線区間応答品質を用いることにより、ログの格納対象を絞り込むことができる。たとえば、有線区間の応答品質がしきい値以上である場合、端末201自体の通信品質には問題がなく、端末201の通信相手であるサーバ212の通信品質に問題があると判断する。したがって、通信相手のサーバ212が関与するログをRRD404から取得して蓄積DB405に格納することにより、通信相手のサーバ212が関与するログ(当該サーバ212が他の端末201と通信したフローのログも含む)に絞り込んで劣化要因の分析を効率的におこなうことができる。また、しきい値未満の場合は、端末201の通信品質に問題があるため、端末201が関与するログを取得して蓄積DB405に格納することにより、端末201に絞り込んで劣化要因の分析を効率的におこなうことができる。
Further, when acquiring the log, it is possible to narrow down the log storage target by using the wired section response quality between the terminal 201 and the
以上に説明したように、保存期間が一定であるRRD404には通信品質の劣化検出に必要な分の記憶容量があればよいため、本実施例で示したRRD404内のログを用いて通信品質の劣化検出をすることにより、RRD404の記憶容量の低減化を図ることができる。また、蓄積DB405には、通信品質の劣化に関する特定のログを記憶する分の記憶容量があればよいため、蓄積DB405の記憶容量の低減化を図ることができる。
As described above, the
なお、本発明は前述した実施例に限定されるものではなく、添付した特許請求の範囲の趣旨内における様々な変形例及び同等の構成が含まれる。例えば、前述した実施例は本発明を分かりやすく説明するために詳細に説明したものであり、必ずしも説明した全ての構成を備えるものに本発明は限定されない。また、ある実施例の構成の一部を他の実施例の構成に置き換えてもよい。また、ある実施例の構成に他の実施例の構成を加えてもよい。また、各実施例の構成の一部について、他の構成の追加・削除・置換をしてもよい。 The present invention is not limited to the above-described embodiments, and includes various modifications and equivalent configurations within the scope of the appended claims. For example, the above-described embodiments have been described in detail for easy understanding of the present invention, and the present invention is not necessarily limited to those having all the configurations described. A part of the configuration of one embodiment may be replaced with the configuration of another embodiment. Moreover, you may add the structure of another Example to the structure of a certain Example. In addition, for a part of the configuration of each embodiment, another configuration may be added, deleted, or replaced.
また、前述した各構成、機能、処理部、処理手段等は、それらの一部又は全部を、例えば集積回路で設計する等により、ハードウェアで実現してもよく、プロセッサがそれぞれの機能を実現するプログラムを解釈し実行することにより、ソフトウェアで実現してもよい。 In addition, each of the above-described configurations, functions, processing units, processing means, etc. may be realized in hardware by designing a part or all of them, for example, with an integrated circuit, and the processor realizes each function. It may be realized by software by interpreting and executing the program to be executed.
各機能を実現するプログラム、テーブル、ファイル等の情報は、メモリ、ハードディスク、SSD(Solid State Drive)等の記憶装置、又は、ICカード、SDカード、DVD等の記録媒体に格納することができる。 Information such as programs, tables, and files that realize each function can be stored in a storage device such as a memory, a hard disk, or an SSD (Solid State Drive), or a recording medium such as an IC card, an SD card, or a DVD.
また、制御線や情報線は説明上必要と考えられるものを示しており、実装上必要な全ての制御線や情報線を示しているとは限らない。実際には、ほとんど全ての構成が相互に接続されていると考えてよい。 Further, the control lines and the information lines are those that are considered necessary for the explanation, and not all the control lines and the information lines that are necessary for the mounting are shown. In practice, it can be considered that almost all the components are connected to each other.
100 基準値DB
201 端末
202 基地局
207 検出装置
212 サーバ
410 登録部
411 作成部
412 算出部
413 検出部
414 格納部
421 HTTPログテーブル
422 TCP/UDPログテーブル
423 制御メッセージログテーブル
424 品質情報テーブル
100 Reference value DB
201 terminal 202
Claims (15)
前記第1の記憶部に記憶されたログのうち、通信品質の監視対象が関与する特定のトラフィックについての特定のログを参照することにより、前記監視対象についての通信品質に関する時系列な統計値群を算出する算出部と、
前記算出部によって算出された時系列な統計値群と、前記監視対象についての通信品質の劣化に関するしきい値と、を比較することにより、前記監視対象についての通信品質の劣化を検出する検出部と、
前記検出部によって前記監視対象についての通信品質の劣化が検出された場合、前記特定のログを前記第1の記憶部から取得して、第2の記憶部に格納する格納部と、
を有することを特徴とする検出装置。 A first storage unit that stores a log relating to traffic between communication devices, and deletes the oldest log among the stored logs when the storage capacity exceeds a predetermined amount;
Of the logs stored in the first storage unit, by referring to a specific log for a specific traffic related to a monitoring target of communication quality, a time-series statistical value group related to the communication quality of the monitoring target A calculation unit for calculating
A detection unit for detecting deterioration in communication quality for the monitoring target by comparing a time-series statistical value group calculated by the calculation unit with a threshold value regarding deterioration in communication quality for the monitoring target. When,
A storage unit that acquires the specific log from the first storage unit and stores the specific log in the second storage unit when the detection unit detects a deterioration in communication quality for the monitoring target;
A detection apparatus comprising:
前記算出部は、前記サーバから前記端末群の中の監視対象となるある端末が前記データをダウンロードしたダウンロード時間を前記特定のログから取得し、当該ダウンロード時間と前記分布情報の基準値とに基づいて、前記ある端末についての通信品質に関する時系列な統計値群を算出することを特徴とする請求項1に記載の検出装置。 Distribution information of data download time and number of times of download of data from a server which is one communication device for specifying the specific traffic to a terminal group which is the other communication device, and a reference value of the download time in the distribution information And a third storage unit for storing
The calculation unit obtains, from the specific log, a download time when a certain terminal to be monitored from the server downloads the data from the server, and based on the download time and a reference value of the distribution information The detection apparatus according to claim 1, wherein a time-series statistical value group relating to communication quality for the certain terminal is calculated.
前記算出部は、前記サーバから前記端末群の中の監視対象となる基地局に接続された特定の端末群が前記データをダウンロードしたダウンロード時間を前記特定のログから取得し、当該ダウンロード時間と前記分布情報の基準値とに基づいて、前記基地局についての通信品質に関する時系列な統計値群を算出することを特徴とする請求項1に記載の検出装置。 The download time of data from the server that is one communication device in the specific traffic to the terminal group that is the other communication device and the distribution information of the download count of the data, the reference value of the download time in the distribution information, A third storage unit for storing
The calculation unit obtains, from the specific log, a download time when a specific terminal group connected to a base station to be monitored in the terminal group from the server downloads the data, and the download time and the The detection apparatus according to claim 1, wherein a time-series statistical value group relating to communication quality for the base station is calculated based on a reference value of distribution information.
前記格納部は、前記検出部によって前記ある端末についての通信品質の劣化が検出された場合、前記無線区間の応答品質の高さを示す時系列な評価値が所定のしきい値以上であれば、前記特定のログを前記第2の記憶部から取得して、前記第3の記憶部に格納し、前記無線区間の応答品質の高さを示す時系列な評価値が所定のしきい値未満であれば、前記接続相手の基地局が関与するログを前記第2の記憶部から取得して、前記第3の記憶部に格納することを特徴とする請求項1に記載の検出装置。 The calculation unit specifies a response delay of a radio section between the certain terminal to be monitored and a base station to be connected from the specific log, and based on the response delay, the response quality of the certain terminal Time-series evaluation value indicating the height of the
When the detection unit detects a deterioration in communication quality for the certain terminal, the storage unit has a time-series evaluation value indicating a high response quality in the wireless section if it is equal to or higher than a predetermined threshold value. The specific log is acquired from the second storage unit, stored in the third storage unit, and a time-series evaluation value indicating a high response quality of the wireless section is less than a predetermined threshold value If so, the detection apparatus according to claim 1, wherein a log related to the base station of the connection partner is acquired from the second storage unit and stored in the third storage unit.
前記格納部は、前記検出部によって前記ある端末についての通信品質の劣化が検出された場合、前記有線区間の応答品質の高さを示す時系列な評価値が所定のしきい値以上であれば、前記特定のログを前記第2の記憶部から取得して、前記第3の記憶部に格納し、前記無線区間の応答品質の高さを示す時系列な評価値が所定のしきい値未満であれば、前記サーバが関与するログを前記第2の記憶部から取得して、前記第3の記憶部に格納することを特徴とする請求項1に記載の検出装置。 The calculation unit specifies a response delay of a wired section between the certain terminal that is the monitoring target and a server that is a communication partner of the certain terminal, from the specific log, and based on the response delay, the certain terminal Time-series evaluation value indicating the high response quality of
The storage unit, when a deterioration in communication quality for the certain terminal is detected by the detection unit, if a time-series evaluation value indicating a high response quality of the wired section is equal to or greater than a predetermined threshold value The specific log is acquired from the second storage unit, stored in the third storage unit, and a time-series evaluation value indicating a high response quality of the wireless section is less than a predetermined threshold value If so, the detection apparatus according to claim 1, wherein a log related to the server is acquired from the second storage unit and stored in the third storage unit.
通信装置間のトラフィックに関するログを記憶し、記憶容量が所定量以上になると記憶済みのログのうち最古のログから削除する第1の記憶部を有し、
前記第1の記憶部に記憶されたログのうち、通信品質の監視対象が関与する特定のトラフィックについての特定のログを参照することにより、前記監視対象についての通信品質に関する時系列な統計値群を算出する算出処理と、
前記算出処理によって算出された時系列な統計値群と、前記監視対象についての通信品質の劣化に関するしきい値と、を比較することにより、前記監視対象についての通信品質の劣化を検出する検出処理と、
前記検出処理によって前記監視対象についての通信品質の劣化が検出された場合、前記特定のログを前記第1の記憶部から取得して、第2の記憶部に格納する格納処理と、
を実行することを特徴とする検出方法。 A detection device that detects deterioration in communication quality
A log relating to traffic between communication devices is stored, and when the storage capacity becomes a predetermined amount or more, a first storage unit that deletes from the oldest log among stored logs,
Of the logs stored in the first storage unit, by referring to a specific log for a specific traffic related to a monitoring target of communication quality, a time-series statistical value group related to the communication quality of the monitoring target A calculation process for calculating
A detection process for detecting deterioration in communication quality for the monitoring target by comparing a time-series statistical value group calculated by the calculation process with a threshold value regarding communication quality deterioration for the monitoring target. When,
A storage process for acquiring the specific log from the first storage unit and storing the specific log in the second storage unit when a deterioration in communication quality for the monitoring target is detected by the detection process;
The detection method characterized by performing.
前記プロセッサは、通信装置間のトラフィックに関するログを記憶し、記憶容量が所定量以上になると記憶済みのログのうち最古のログから削除する第1の記憶部にアクセス可能であり、
前記プロセッサに、
前記第1の記憶部に記憶されたログのうち、通信品質の監視対象が関与する特定のトラフィックについての特定のログを参照することにより、前記監視対象についての通信品質に関する時系列な統計値群を算出する算出処理と、
前記算出処理によって算出された時系列な統計値群と、前記監視対象についての通信品質の劣化に関するしきい値と、を比較することにより、前記監視対象についての通信品質の劣化を検出する検出処理と、
前記検出処理によって前記監視対象についての通信品質の劣化が検出された場合、前記特定のログを前記第1の記憶部から取得して、第2の記憶部に格納する格納処理と、
を実行させることを特徴とする検出プログラム。 A detection program stored in a memory readable by a processor and causing the processor to detect deterioration in communication quality,
The processor stores a log relating to traffic between communication devices, and can access a first storage unit that is deleted from the oldest log among stored logs when the storage capacity exceeds a predetermined amount,
In the processor,
Of the logs stored in the first storage unit, by referring to a specific log for a specific traffic related to a monitoring target of communication quality, a time-series statistical value group related to the communication quality of the monitoring target A calculation process for calculating
A detection process for detecting deterioration in communication quality for the monitoring target by comparing a time-series statistical value group calculated by the calculation process with a threshold value regarding communication quality deterioration for the monitoring target. When,
A storage process for acquiring the specific log from the first storage unit and storing the specific log in the second storage unit when a deterioration in communication quality for the monitoring target is detected by the detection process;
A detection program characterized by causing
Priority Applications (2)
| Application Number | Priority Date | Filing Date | Title |
|---|---|---|---|
| JP2014040384A JP2015165636A (en) | 2014-03-03 | 2014-03-03 | Detecting device, detecting method, and detecting program |
| US14/637,326 US20150249585A1 (en) | 2014-03-03 | 2015-03-03 | Detection apparatus, detection method, and detection program |
Applications Claiming Priority (1)
| Application Number | Priority Date | Filing Date | Title |
|---|---|---|---|
| JP2014040384A JP2015165636A (en) | 2014-03-03 | 2014-03-03 | Detecting device, detecting method, and detecting program |
Publications (2)
| Publication Number | Publication Date |
|---|---|
| JP2015165636A true JP2015165636A (en) | 2015-09-17 |
| JP2015165636A5 JP2015165636A5 (en) | 2016-09-15 |
Family
ID=54007270
Family Applications (1)
| Application Number | Title | Priority Date | Filing Date |
|---|---|---|---|
| JP2014040384A Pending JP2015165636A (en) | 2014-03-03 | 2014-03-03 | Detecting device, detecting method, and detecting program |
Country Status (2)
| Country | Link |
|---|---|
| US (1) | US20150249585A1 (en) |
| JP (1) | JP2015165636A (en) |
Cited By (2)
| Publication number | Priority date | Publication date | Assignee | Title |
|---|---|---|---|---|
| JP2017092626A (en) * | 2015-11-06 | 2017-05-25 | ソフトバンク株式会社 | Relay station classification device, response time deriving device, program, and communication management system |
| JP2023013691A (en) * | 2021-07-16 | 2023-01-26 | サイレックス・テクノロジー株式会社 | Communication monitoring apparatus, communication monitoring system, and communication monitoring method |
Families Citing this family (7)
| Publication number | Priority date | Publication date | Assignee | Title |
|---|---|---|---|---|
| US9652723B2 (en) * | 2015-06-05 | 2017-05-16 | Sas Institute Inc. | Electrical transformer failure prediction |
| US10582266B2 (en) * | 2015-10-07 | 2020-03-03 | Vasona Networks Inc. | Rating video-download quality |
| US9860273B2 (en) | 2015-10-09 | 2018-01-02 | T-Mobile Usa, Inc. | Logging encrypted data communications for QOE analysis |
| CN106919578B (en) * | 2015-12-24 | 2021-04-20 | 创新先进技术有限公司 | A method and device for determining an associated resource value of an Internet resource |
| US10970380B2 (en) * | 2016-06-13 | 2021-04-06 | Verizon Patent And Licensing Inc. | Internet-of-Things partner integration |
| US10791026B2 (en) * | 2016-11-10 | 2020-09-29 | Ciena Corporation | Systems and methods for adaptive over-the-top content quality of experience optimization |
| CN111858043B (en) * | 2020-07-10 | 2024-03-22 | 海尔优家智能科技(北京)有限公司 | Service request processing method and device, storage medium and electronic device |
Citations (3)
| Publication number | Priority date | Publication date | Assignee | Title |
|---|---|---|---|---|
| JP2005094716A (en) * | 2003-09-22 | 2005-04-07 | Yokogawa Electric Corp | Communications system |
| JP2010109744A (en) * | 2008-10-30 | 2010-05-13 | Nec Corp | Communication quality management system, communication detection apparatus, network management apparatus, method of communication quality management, and communication detection program |
| JP2013026841A (en) * | 2011-07-21 | 2013-02-04 | Ntt Comware Corp | Failure detection device, failure detection method, and failure detection program |
Family Cites Families (4)
| Publication number | Priority date | Publication date | Assignee | Title |
|---|---|---|---|---|
| US6928471B2 (en) * | 2001-05-07 | 2005-08-09 | Quest Software, Inc. | Method and apparatus for measurement, analysis, and optimization of content delivery |
| US7519700B1 (en) * | 2005-02-18 | 2009-04-14 | Opnet Technologies, Inc. | Method and system for topological navigation of hierarchical data groups |
| US8589541B2 (en) * | 2009-01-28 | 2013-11-19 | Headwater Partners I Llc | Device-assisted services for protecting network capacity |
| US8892720B2 (en) * | 2009-02-12 | 2014-11-18 | Arcsoft, Inc. | System and method for network optimization through predictive downloading |
-
2014
- 2014-03-03 JP JP2014040384A patent/JP2015165636A/en active Pending
-
2015
- 2015-03-03 US US14/637,326 patent/US20150249585A1/en not_active Abandoned
Patent Citations (3)
| Publication number | Priority date | Publication date | Assignee | Title |
|---|---|---|---|---|
| JP2005094716A (en) * | 2003-09-22 | 2005-04-07 | Yokogawa Electric Corp | Communications system |
| JP2010109744A (en) * | 2008-10-30 | 2010-05-13 | Nec Corp | Communication quality management system, communication detection apparatus, network management apparatus, method of communication quality management, and communication detection program |
| JP2013026841A (en) * | 2011-07-21 | 2013-02-04 | Ntt Comware Corp | Failure detection device, failure detection method, and failure detection program |
Cited By (3)
| Publication number | Priority date | Publication date | Assignee | Title |
|---|---|---|---|---|
| JP2017092626A (en) * | 2015-11-06 | 2017-05-25 | ソフトバンク株式会社 | Relay station classification device, response time deriving device, program, and communication management system |
| JP2023013691A (en) * | 2021-07-16 | 2023-01-26 | サイレックス・テクノロジー株式会社 | Communication monitoring apparatus, communication monitoring system, and communication monitoring method |
| JP7425489B2 (en) | 2021-07-16 | 2024-01-31 | サイレックス・テクノロジー株式会社 | Communication monitoring device, communication monitoring system, and communication monitoring method |
Also Published As
| Publication number | Publication date |
|---|---|
| US20150249585A1 (en) | 2015-09-03 |
Similar Documents
| Publication | Publication Date | Title |
|---|---|---|
| JP2015165636A (en) | Detecting device, detecting method, and detecting program | |
| JP5877429B2 (en) | Method and apparatus for network analysis | |
| US9491285B2 (en) | Technique for performance management in a mobile communications network | |
| US9426046B2 (en) | Web page download time analysis | |
| EP2875680B1 (en) | Method and apparatus for selecting a wireless access point | |
| US10111121B2 (en) | Localizing faults in wireless communication networks | |
| US20160065419A1 (en) | Method and apparatus for generating insight into the customer experience of web based applications | |
| US11683703B2 (en) | Network monitoring system and method | |
| US8782188B2 (en) | Automated device reporting | |
| US20160254944A1 (en) | Classification of detected network anomalies using additional data | |
| US20160036710A1 (en) | Network system, traffic management server, and base station management server | |
| CN104754630A (en) | A network quality assessment method, device and processing platform | |
| CN107438254B (en) | Service identification method, device and system based on user behavior | |
| EP3460769A1 (en) | System and method for managing alerts using a state machine | |
| US20160212034A1 (en) | Communication management apparatus, communication system and storage medium | |
| US8976689B2 (en) | Methods, systems, and computer program products for monitoring network performance | |
| US20170208486A1 (en) | Voice optimization enablement apparatus | |
| CN108990092B (en) | Communication abnormity positioning method and device | |
| CN104363130B (en) | The system and method for network quality case study location control is realized in communication network | |
| CN107888394B (en) | Method and device for positioning network fault reason | |
| CN110120883B (en) | Method and device for evaluating network performance and computer readable storage medium | |
| CN110121190B (en) | A data management method, apparatus and computer-readable storage medium | |
| CN109963292B (en) | Complaint prediction method, complaint prediction device, electronic apparatus, and storage medium | |
| US9762727B2 (en) | Quality degradation analysis method, quality degradation analysis device, and network system | |
| US20240250763A1 (en) | Interference identification in a ran |
Legal Events
| Date | Code | Title | Description |
|---|---|---|---|
| A521 | Request for written amendment filed |
Free format text: JAPANESE INTERMEDIATE CODE: A523 Effective date: 20160727 |
|
| A621 | Written request for application examination |
Free format text: JAPANESE INTERMEDIATE CODE: A621 Effective date: 20160727 |
|
| A977 | Report on retrieval |
Free format text: JAPANESE INTERMEDIATE CODE: A971007 Effective date: 20170529 |
|
| A131 | Notification of reasons for refusal |
Free format text: JAPANESE INTERMEDIATE CODE: A131 Effective date: 20170613 |
|
| A02 | Decision of refusal |
Free format text: JAPANESE INTERMEDIATE CODE: A02 Effective date: 20180123 |