JP2009544090A - Image processing for change detection - Google Patents
Image processing for change detection Download PDFInfo
- Publication number
- JP2009544090A JP2009544090A JP2009519969A JP2009519969A JP2009544090A JP 2009544090 A JP2009544090 A JP 2009544090A JP 2009519969 A JP2009519969 A JP 2009519969A JP 2009519969 A JP2009519969 A JP 2009519969A JP 2009544090 A JP2009544090 A JP 2009544090A
- Authority
- JP
- Japan
- Prior art keywords
- image
- data
- value
- change rate
- spatial
- Prior art date
- Legal status (The legal status is an assumption and is not a legal conclusion. Google has not performed a legal analysis and makes no representation as to the accuracy of the status listed.)
- Withdrawn
Links
Images


Classifications
-
- G—PHYSICS
- G06—COMPUTING OR CALCULATING; COUNTING
- G06T—IMAGE DATA PROCESSING OR GENERATION, IN GENERAL
- G06T7/00—Image analysis
- G06T7/20—Analysis of motion
-
- G—PHYSICS
- G06—COMPUTING OR CALCULATING; COUNTING
- G06V—IMAGE OR VIDEO RECOGNITION OR UNDERSTANDING
- G06V10/00—Arrangements for image or video recognition or understanding
- G06V10/20—Image preprocessing
- G06V10/28—Quantising the image, e.g. histogram thresholding for discrimination between background and foreground patterns
Landscapes
- Engineering & Computer Science (AREA)
- Physics & Mathematics (AREA)
- General Physics & Mathematics (AREA)
- Multimedia (AREA)
- Theoretical Computer Science (AREA)
- Computer Vision & Pattern Recognition (AREA)
- Image Processing (AREA)
- Image Analysis (AREA)
Abstract
基準画像及び画像シーケンス内の各入力画像を規定する画像データが処理されて、画像における変化が検出される。画素ごとに、当該画素における画像データの均一性の空間変化率を規定する値が計算される。各画像内の画素の異なる複数の領域が選択され、各領域内の値が連結されて、領域ごとにベクトルが規定される。ベクトルはその後処理されて、各画像内の対応する領域が比較される。比較の結果は、変化が起こった画像内のエリアを識別する相関マップを規定する。 Image data defining the reference image and each input image in the image sequence is processed to detect changes in the image. For each pixel, a value that defines a spatial change rate of uniformity of image data in the pixel is calculated. A plurality of regions having different pixels in each image are selected, values in each region are connected, and a vector is defined for each region. The vectors are then processed and the corresponding regions in each image are compared. The result of the comparison defines a correlation map that identifies the area in the image where the change has occurred.
Description
本発明は、画像処理の分野に関し、より詳細には、画像における変化、特に(しかし排他的ではない)物体の動きを検出するための、画像シーケンスを規定する画像データの処理に関する。そして、このような変化の検出は、たとえば、他方の画像データからの変化に関連する画像データを分割し且つ/又は外部装置及び処理を制御するために使用することができる。 The present invention relates to the field of image processing, and more particularly to the processing of image data defining an image sequence to detect changes in the image, particularly (but not exclusively) object motion. Such change detection can then be used, for example, to split image data related to changes from the other image data and / or to control external devices and processes.
同じシーンの異なる画像の間の変化を確認することは、多くのコンピュータビジョン用途における基本的動作である。衛星イメージングのような幾つかの用途では、課題は、比較的長い時間スケールにわたって変化を検出すること(たとえば、地形の侵食の効果若しくは構造を観察すること、又は農地利用における変化を確認すること)である。対照的に、ビデオ分析では、目標は、短い時間スケールにわたって変化を検出することであり得る。ビデオシーケンス内の間隔が狭いフレーム間で変化が測定される場合、問題のうちの1つは、シーン内の物体の動きを検出することである。 Confirming changes between different images of the same scene is a fundamental operation in many computer vision applications. In some applications, such as satellite imaging, the challenge is to detect changes over a relatively long time scale (eg, to observe the effects or structure of terrain erosion, or to confirm changes in agricultural land use). It is. In contrast, in video analysis, the goal may be to detect changes over a short time scale. When changes are measured between closely spaced frames in a video sequence, one of the problems is detecting motion of objects in the scene.
閉回路テレビ(CCTV)ビデオ監視は、取得されるビデオデータの量が、通常、人による観察及び分析の能力をはるかに超えている用途の一例である。大抵の状況では、制御室内のモニタよりもはるかに多くのカメラが存在し、それと人間の操作者との比は言うまでもない。他の顕著な特徴は、このビデオデータの大部分が興味を引かないものであることである(カメラの視野は長い期間にわたって無人であるか若しくは変化がない)か、又は操作者が特定のタイプの行動の監視にしか興味を示さない場合があることである。 Closed circuit television (CCTV) video surveillance is an example of an application where the amount of video data acquired is typically far beyond the capabilities of human observation and analysis. In most situations, there are far more cameras than monitors in the control room, not to mention the ratio of human operators. Another notable feature is that the vast majority of this video data is uninteresting (the camera's field of view is unattended or unchanged over a long period of time) You may only be interested in monitoring your behavior.
これらの理由によって、画像シーケンスの何らかの自動分析を実行することは著しい実利をもたらす。適切なコンピュータビジョンアルゴリズムを実施することによって、興味を引かないビデオを放棄することができるか、又は逆に、興味対象のイベントを、人間の操作者に気付いてもらうために強調することができる。このように、視覚情報をより効率的且つ効果的に管理することができる。 For these reasons, performing some automatic analysis of the image sequence has significant benefits. By implementing appropriate computer vision algorithms, videos that are not of interest can be abandoned, or conversely, the events of interest can be emphasized for the human operator to notice. In this way, visual information can be managed more efficiently and effectively.
監視ビデオの1つの基本的分析機能は、動きの検出及び位置特定である。動き検出器はそれ自体で、操作者にシーン内の行動に注意するよう呼びかけるか又はビデオストリームの記録を誘発することができる。さらに、ビデオフレーム内の移動物体(複数可)の位置を特定することができる場合、システムは、特定のゾーンへの侵入のようなより複雑なイベントを検査することができる。動き分割もさらなる分析のための重要な基盤である。物体追跡アルゴリズムは、履歴データと比較するために、検出された物体又はこれらの物体の測定された属性からイニシャライズすることができる。 One basic analysis function of surveillance video is motion detection and localization. The motion detector by itself can call the operator to watch for behavior in the scene or trigger the recording of a video stream. In addition, if the location of the moving object (s) within the video frame can be determined, the system can inspect more complex events such as entering a particular zone. Motion segmentation is also an important basis for further analysis. The object tracking algorithm can be initialized from detected objects or measured attributes of these objects for comparison with historical data.
このような動的な物体の動きは、興味対象となり得る、ビデオシーケンス内の変化の唯一のタイプではないことに留意されたい。数分又は数時間の期間にわたって、たとえば、シーン内の、静的な他の物体の到着又は出発を検出することが望ましい場合がある。したがって、本明細書で使用される場合の用語「動き」は、このような状況、及びさらには他の同様の状況の両方を包含するように使用される。フルレートビデオシーケンスが利用可能である場合、これは、動き検出とフレーム毎の物体追跡との組み合わせによって達成することができる。しかし、変化がより長い時間基準にわたって直接検出される可能性がある場合、2つのフレームの直接比較によって同じ結果がはるかにより簡単に達成され得る。さらには、動き分析及び物体追跡のアルゴリズムのうちの多数は、物体は連続するフレーム間でわずかに(インクリメンタルに)動くという仮定に依存し、この仮定は、たとえば低速度撮影ビデオ記録の場合のようには必ずしも満たされない。 Note that such dynamic object movement is not the only type of change in a video sequence that may be of interest. It may be desirable to detect the arrival or departure of other static objects in a scene, for example over a period of minutes or hours. Thus, the term “movement” as used herein is used to encompass both this situation and even other similar situations. If full-rate video sequences are available, this can be achieved by a combination of motion detection and frame-by-frame object tracking. However, if changes can be detected directly over a longer time base, the same result can be achieved much more easily by direct comparison of the two frames. Furthermore, many of the motion analysis and object tracking algorithms rely on the assumption that the object moves slightly (incrementally) between successive frames, which is the case, for example, with time-lapse video recording. Is not necessarily satisfied.
画像シーケンス内の変化を検出するための様々な方法を上記で提示した。これらの方法及びこれらの方法の不利な点を以下で要約する。 Various methods for detecting changes in the image sequence are presented above. These methods and the disadvantages of these methods are summarized below.
背景差分
1つの既知の方法は、現在のフレームから基準又は「背景」画像を減算するという着想、すなわちフレーム差分(frame differencing)又は背景差分(background subtraction)である。この手法のほとんどの基本用途では、各時点における基準画像は単に前のフレームである。より複雑な背景モデルは、性能の向上をもたらし得る。線形フィルタリング及び非線形フィルタリング、予測、及び統計的モデリングを含む、前のフレームの履歴を統合する様々な方法が提案されている。これら方法のうちの幾つかの概説及び評価は、Cheung及びKamath(非特許文献1)によって提供されている。
Background Difference One known method is the idea of subtracting a reference or “background” image from the current frame, ie, frame differencing or background subtraction. In most basic applications of this approach, the reference image at each point in time is simply the previous frame. More complex background models can result in improved performance. Various methods for integrating the history of previous frames have been proposed, including linear and non-linear filtering, prediction, and statistical modeling. A review and evaluation of some of these methods is provided by Cheung and Kamath (1).
背景差分を使用する最良の既知の方法のうちの1つは、Stauffer及びGrimsonによる「混合ガウス分布」背景モデルである(非特許文献2)。このアルゴリズムでは、背景強度/色の統計的モデルは画素ごとに構築される。これは、少数のガウス分布の混合モデルとして表現される。各ガウスは平均偏差及び標準偏差によって特徴付けられる。したがって、新しいフレームごとに、各画素はその混合モデル内の全成分と比較され、平均の2.5標準偏差内にある場合に、一致が宣言される。その後、画素ごとのモデルのパラメータは、次のフレームに進む前に更新される。 One of the best known methods using background subtraction is the “mixed Gaussian distribution” background model by Stauffer and Grimson (2). In this algorithm, a statistical model of background intensity / color is built for each pixel. This is expressed as a mixed model with a small number of Gaussian distributions. Each Gaussian is characterized by a mean deviation and a standard deviation. Thus, for each new frame, each pixel is compared with all components in its mixed model and a match is declared if it is within the mean 2.5 standard deviations. Thereafter, the model parameters for each pixel are updated before proceeding to the next frame.
別の多モードの背景モデルは、Haritaoglu他(非特許文献3)からの「W4」システムにおいて使用される。この場合では、ビデオシーケンス内の固定画素から背景モデルを学習するためにトレーニング期間がまず使用される。このモデルは、トレーニング期間にわたる最小値、最大値、及び最大差異値によって特徴付けられる。 Another multimodal background model is used in the “W4” system from Haritaoglu et al. In this case, a training period is first used to learn the background model from fixed pixels in the video sequence. This model is characterized by minimum, maximum and maximum difference values over the training period.
勾配法
Javed他(非特許文献4)は色とエッジベースの背景差分とを組み合わせる。Javed他は、画素色統計値のガウスモデルだけでなく、勾配の大きさ及び方向のガウスモデルも構築する。
Gradient method
Javed et al. (4) combine color and edge-based background subtraction. Javed et al. Build not only a Gaussian model of pixel color statistics, but also a Gaussian model of gradient magnitude and direction.
近傍変化検出
幾人かの著者は、画素ごとの差分手法は、有用ではあるが、特にシーン照度が変化する状況において、複数の欠点を有することを述べている。これに応じて、これらの著者らは様々な局所的な近傍ベースの方法を提案している。Durucan及びEbrahimi(非特許文献5)は、周囲の近傍内の画素値を連結してベクトルを形成することによって各画素をモデル化するように提案している。2つのこのようなベクトル間の変化を測定するために、著者らは、これらのベクトルが一次独立であるか否かを評価する2つの異なる手段を開発している。基本となる仮定は、変化する照度はベクトルの線形スケーリングによってモデル化することができ、それによって、一次独立の程度(degree)の測定は、このような変化に対して単純な差分よりもロバストになるというものである。
Neighbor Change Detection Some authors state that the pixel-by-pixel difference approach is useful, but has several drawbacks, especially in situations where scene illumination changes. In response, these authors have proposed various local neighborhood-based methods. Durucan and Ebrahimi (Non-Patent Document 5) propose to model each pixel by concatenating pixel values in surrounding neighborhoods to form a vector. In order to measure the change between two such vectors, the authors have developed two different means to evaluate whether these vectors are linearly independent. The basic assumption is that varying illuminance can be modeled by linear scaling of the vector, so that a first order degree of measurement is more robust than simple differences to such changes. It is to become.
Nagaya他(特許文献1)は同様の方法を提案している。Nagaya他は、画像内の画素の「スリット」又は線形スライス(linear slice)からベクトルを構築し、照度変化がこのベクトルの大きさを変更するが、このベクトルの方向は変更しないことを述べている。したがって、Nagaya他は、ベクトルがまず単位球面に投影され、その後比較される、正規化ベクトル距離を規定している。この距離はスケーリングに対して不変であり、したがって、アルゴリズムは照度変化に対してロバストであるはずである。Aoki他(特許文献2)は、画素のブロックからベクトルを構築し、同等の正規化距離を、2つのベクトル間の角度を直接測定するために内積を使用することによって計算することができることに言及している。 Nagaya et al. (Patent Document 1) has proposed a similar method. Nagaya et al. Construct a vector from "slits" or linear slices of pixels in the image and state that changes in illumination change the magnitude of this vector, but not the direction of this vector. . Thus, Nagaya et al. Define a normalized vector distance where vectors are first projected onto a unit sphere and then compared. This distance is invariant to scaling, so the algorithm should be robust to illumination changes. Aoki et al. (Patent Document 2) mention that a vector can be constructed from a block of pixels and an equivalent normalized distance can be calculated by using an inner product to directly measure the angle between the two vectors. is doing.
Matsuyama他(非特許文献6)は、距離値の空間統計値及び時間統計値を記録することによって、正規化ベクトル距離の概念をさらに発展させている。このようにすることで、Matsuyama他は、画像シーケンスのコンテンツ(content)に対する決定関数をより良好に採用するように意図している。 Matsuyama et al. (6) further develops the concept of normalized vector distance by recording spatial and temporal statistics of distance values. By doing so, Matsuyama et al. Intends to better adopt the decision function for the content of the image sequence.
Kondo他(特許文献3)は、近傍の画素値のベクトルを比較するために正規化相関を使用している。この種類の距離測定は、線形スケーリングのみでなく、考慮されている2つの画像間の相加因子(additive factor)に対しても不変性を達成する。 Kondo et al. (Patent Document 3) uses normalized correlation to compare vectors of neighboring pixel values. This type of distance measurement achieves invariance not only for linear scaling, but also for additive factors between the two images considered.
Li及びLeung(非特許文献7)は、近傍ベースの比較の概念と画像勾配の使用とを組み合わせて、画像テクスチャ内の差異を測定する。しかし、Li及びLeungの論文で提案されている距離関数は依然として、(線形スケーリングによってモデル化されるような)照度の変化の影響を受けやすい。 Li and Leung (7) combine the concept of neighborhood-based comparison with the use of image gradients to measure differences in image textures. However, the distance function proposed in Li and Leung's paper is still susceptible to changes in illumination (as modeled by linear scaling).
照度補償
Bassman他(特許文献4)はまた、画素値の線形スケーリングによって照度変化をモデル化している。しかし、Bassman他は、これを大域的効果として扱い、したがって、スケーリング係数及びオフセットをフレーム全体にわたって評価する。これらのパラメータは、通常の画素ごとの差分を実行する前に、基準画像を変更して変化を補償するために使用される。
Illuminance compensation
Bassman et al. (Patent Document 4) also models illuminance changes by linear scaling of pixel values. However, Bassman et al. Treat this as a global effect and thus evaluate scaling factors and offsets throughout the frame. These parameters are used to change the reference image to compensate for the change before performing the normal pixel-by-pixel differences.
自動視覚分析アルゴリズムが、実際のシーンにおいて遭遇する広範な環境変化に対してロバストであるということは非常に重要である。これは特に、視覚監視のような、セキュリティが重要である用途に当てはまる。システムは、興味対象のイベント(及び複数の潜在的脅威)と、悪意によらない変化による画像変化とを区別することができなければならない。照明条件を変えることは、このような悪意によらないが、遍在する変化の一例である。 It is very important that automatic visual analysis algorithms are robust to the wide range of environmental changes encountered in real scenes. This is especially true for applications where security is important, such as visual surveillance. The system must be able to distinguish events of interest (and potential threats) from image changes due to non-malicious changes. Changing the lighting conditions is an example of a ubiquitous change, although not based on such malicious intent.
上記に挙げた従来技術の変化検出アルゴリズムのうちの多数は、多かれ少なかれ、照度変化に敏感である。画素ベースの背景差分方法は、検出された強度及び色の変化を動きの証拠として解釈する場合に、誤認警報を生成することになる。照度変化を正規化又は補償するように試みる方法のうち、大抵の方法は、局所的近傍において、又は画像全体にわたって大域的に、のいずれかで、強度変化の線形モデルに基づく。大域的仮定は自然の複雑なシーンにおいては直ぐに崩壊する。3次元シーンが、均一な照度又は全体における均一な照度変化のいずれかを有することは稀である。局所的仮定は、単一の物体又は表面にわたるような、画像の幾つかの部分においては有効であるが、不可避的に、相互反射、シャドーイング、及び不均一な照度が存在する場合では、線形モデルが機能しなくなる不連続(物体境界又は照度境界)が生じることになる。 Many of the prior art change detection algorithms listed above are more or less sensitive to illuminance changes. The pixel-based background subtraction method will generate a false alarm when interpreting detected intensity and color changes as evidence of motion. Of the methods that attempt to normalize or compensate for illuminance changes, most methods are based on a linear model of intensity change, either locally in the vicinity or globally throughout the image. Global assumptions quickly collapse in natural complex scenes. It is rare for a three-dimensional scene to have either uniform illumination or uniform illumination changes throughout. Local assumptions are valid for some parts of the image, such as over a single object or surface, but are inevitably linear in the presence of interreflection, shadowing, and non-uniform illumination. Discontinuities (object boundaries or illuminance boundaries) that cause the model to fail will occur.
従来技術の技法はしたがって、特に以下の、多数の問題を抱える:
差異が局所的な照明変化によってモデル化される場合があるため、強度が均一な移動領域の内部を均一な背景にわたって検出することができない、局所的近傍方法が直面するいわゆる「窓問題」(さらに詳細に後述する)。
複雑な背景モデルを維持する必要。
照度変化の影響を吸収する背景更新メカニズムへの依存、特に、背景差分に基づく方法は、物体の動きと動態的な他の変化とを区別する。したがって、速い照度変化及びゆっくり移動する物体はエラーをもたらす。
Prior art techniques therefore have a number of problems, in particular:
The so-called “window problem” faced by the local neighborhood method, where the interior of a moving area of uniform intensity cannot be detected over a uniform background, as the differences may be modeled by local illumination changes (further Details will be described later).
Need to maintain complex background models.
Dependence on background update mechanisms that absorb the effects of illuminance changes, especially methods based on background differences, distinguish between object motion and other dynamic changes. Thus, fast illumination changes and slowly moving objects cause errors.
本発明は、従来技術の検出方法の問題のうちの少なくとも1つに対処することを目標とする。 The present invention aims to address at least one of the problems of prior art detection methods.
本発明によれば、
第1の画像内の画素値がその画素において変化する割合を表す、第1の画像内の各画素の値を計算すること、
第2の画像内の画素値がその画素において変化する割合を表す、第2の画像内の各画素の値を計算すること、
第1の画像の異なる複数の領域における計算された値を結合することであって、各領域のそれぞれの代表値を生成する、結合すること、
第2の画像の異なる複数の領域における計算された値を結合することであって、各領域のそれぞれの代表値を生成する、結合すること、
第1の画像及び第2の画像の対応する領域の代表値を比較すること、並びに
比較結果に従って画像間の差異を確認すること、
によって、第1の画像及び第2の画像を規定する画像データが処理されて、画像間の差異が検出される、画像処理装置及び方法が提供される。
According to the present invention,
Calculating the value of each pixel in the first image representing the rate at which the pixel value in the first image changes at that pixel;
Calculating the value of each pixel in the second image that represents the rate at which the pixel value in the second image changes at that pixel;
Combining calculated values in different regions of the first image, generating respective representative values for each region;
Combining calculated values in different regions of the second image, generating respective representative values for each region;
Comparing representative values of corresponding regions of the first image and the second image, and confirming differences between images according to the comparison results;
Provides an image processing apparatus and method in which image data defining a first image and a second image is processed to detect differences between the images.
好ましくは、領域は異なるサイズを有し、第1の画像及び第2の画像においてサイズは同じである。これは、差異の検出を複数のスケールで実行することを可能にし、上述した「窓問題」に対処する。 Preferably, the regions have different sizes and the size is the same in the first image and the second image. This allows the difference detection to be performed at multiple scales and addresses the “window problem” described above.
好ましくは、代表値の比較は、代表値R1が代表値R2と比較される場合と、R1がαR2と比較される(αは線形スケーリング係数である)場合とにおいて同じ比較結果をもたらす線形不変比較処理によって実行される。この方法では、比較は、照度の変化によって引き起こされる差異と、物体の動作によって引き起こされる差異とを区別することができる。 Preferably, the comparison of representative values is a linear invariant comparison that results in the same comparison when representative value R1 is compared to representative value R2 and when R1 is compared to αR2 (α is a linear scaling factor). It is executed by processing. In this way, the comparison can distinguish between differences caused by changes in illuminance and differences caused by object movement.
代表値は、画素値が変化する割合を規定する符号無しの値を使用して生成することができる。この符号無しの値の使用は、代表値が画像内の画素値の変化の方向から独立しており、それによって、照度変化によって引き起こされる方向の変化が無効になるという利点を有する。 The representative value can be generated using an unsigned value that defines the rate at which the pixel value changes. The use of this unsigned value has the advantage that the representative value is independent of the direction of change of the pixel value in the image, thereby negating the change of direction caused by the change in illumination.
代替的に、画素値の変化の方向の変化を引き起こす照度変化の問題は、代表値を比較して符号無しの比較結果を生成することによって対処することができる。 Alternatively, the problem of illuminance change that causes a change in the direction of change in pixel value can be addressed by comparing the representative values to produce an unsigned comparison result.
各領域における計算された値を、互いに対して重み付けして、画像間の差異のより精密な位置特定を可能にすることができる。 The calculated values in each region can be weighted relative to each other to allow for more precise localization of differences between images.
画像のうちの一方を少なくとも1つのさらなる画像と共に処理して、他方の画像の代表領域値との比較のために代表領域値を生成することができる。たとえば、画素値が変化する割合を表す計算された値を異なる複数の画像に関して結合して、画素ごとに結合値を生成することができる(たとえば、同じ位置における画素の値の中央値をとることによる)。代表領域値はその後、結合値から生成することができる。これは、背景モデルを、照度条件及び移動物体から独立して合成することを可能にする。 One of the images can be processed with at least one further image to generate a representative region value for comparison with the representative region value of the other image. For example, calculated values representing the rate at which pixel values change can be combined for different images to generate a combined value for each pixel (eg, taking the median value of the pixels at the same location) by). The representative region value can then be generated from the combined value. This allows the background model to be synthesized independently from the illumination conditions and moving objects.
本発明は、プログラム可能な処理装置を、上述したような装置として構成されるように又は上述したような方法を実行するように動作可能になるようにプログラムするための、コンピュータプログラム命令を記憶する記憶媒体のようなコンピュータプログラム製品、又はコンピュータプログラム命令を搬送する信号も提供する。 The present invention stores computer program instructions for programming a programmable processing device to be configured as a device as described above or operable to perform a method as described above. A computer program product, such as a storage medium, or a signal carrying computer program instructions is also provided.
本発明の一実施の形態は、(強度値(intensity values)、又は赤、緑、及び青の値のような)画像画素値の偏導関数を使用して、照度に対して概ね不変である方法で画像における変化を検出する。 One embodiment of the invention is generally invariant to illuminance using partial derivatives of image pixel values (such as intensity values or red, green, and blue values). The method detects changes in the image.
本発明の一実施形態は、基準画像と入力画像との間の勾配構造における変化の検出によって物体の動きを検出及び分割する。この手法は、複数の副次的な利益をもたらす。たとえば、簡単だが強力な背景モデルを、勾配領域において有利に構築することができる。 One embodiment of the invention detects and divides object motion by detecting changes in the gradient structure between the reference image and the input image. This approach provides several secondary benefits. For example, a simple but powerful background model can be advantageously built in the gradient region.
一実施の形態では、構造変化は、様々なサイズ(varying sizes)の近傍にわたって測定される。これは、この実施の形態が、カメラから異なる距離における異なるサイズの物体を一様に効率的に扱うと共に、上述した窓問題にも対処することを可能にする。 In one embodiment, structural changes are measured over neighborhoods of varying sizes. This allows this embodiment to uniformly and efficiently handle objects of different sizes at different distances from the camera and also address the window problem described above.
本発明の一実施の形態は、実世界のシーンの照度変化の柔軟なモデルを提供し、それによって、このような変化に対するロバスト性を向上させる。 One embodiment of the present invention provides a flexible model of illuminance changes in real world scenes, thereby improving robustness against such changes.
本発明の一実施の形態は、計算的に単純な一連の処理を通じてロバスト変化検出を達成し、それによって、最大の効率性及び精度を提供する。 One embodiment of the present invention achieves robust change detection through a computationally simple series of processes, thereby providing maximum efficiency and accuracy.
これより、本発明の実施形態を、例としてのみ、添付の図面を参照して説明する。 Embodiments of the present invention will now be described, by way of example only, with reference to the accompanying drawings.
第1の実施形態
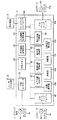
図1を参照すると、本発明の一実施形態は、従来の様態で、1つ又は複数のプロセッサ、メモリ、グラフィックカード等を、従来のパーソナルコンピュータモニタのような表示装置4と、キーボード、マウス等のようなユーザ入力装置6と共に含む、パーソナルコンピュータ(PC)のようなプログラム可能な処理装置2を含む。
First Embodiment Referring to FIG. 1, one embodiment of the present invention, in a conventional manner, includes one or more processors, memory, graphics cards, etc., with a display device 4 such as a conventional personal computer monitor. A
処理装置2は、たとえば、(光学CD ROM、半導体ROM、磁気記録媒体等のような)データ記憶媒体12上に記憶されるデータ、及び/若しくは信号14(たとえば、インターネットのような通信ネットワーク(図示せず)を介する送信若しくは大気を通じる送信による、たとえば遠隔データベースからの処理装置2に対する電気信号入力若しくは光信号入力)として入力され、且つ/又はユーザによってキーボードのようなユーザ入力装置6を介して入力される、プログラミング命令に従って動作するようにプログラムされる。
The
より詳細に後述されるように、プログラミング命令は、シーンの画像シーケンス内の各画像と基準画像とを比較して、これらの画像の間で変化が生じたか否かを判断するように構成されるように、処理装置2をプログラムするための命令を含む。この比較方法は、2つの画像内の対応する領域における画像構造を調査すると共に、照度の変化によって差異が説明され得るか否かを評価することによって動作する。このように説明することができない差異が存在する場合、重要な変化が生じたとみなされる。
As will be described in more detail below, the programming instructions are configured to compare each image in the image sequence of the scene with the reference image to determine whether a change has occurred between these images. As such, it includes instructions for programming the
プログラミング命令によってプログラムされた場合、処理装置2は、処理動作を実行する複数の機能装置として構成されていると考えることができる。このような機能装置及びこれらの相互接続の例は図1に示されている。しかし、図1に示されている装置及び相互接続は、概念的なものであり、理解を助けるように例示のためにのみ示されている。これらは、必ずしも、処理装置2のプロセッサ、メモリ等がその中に実際に構成される装置及び接続を表していない。
When programmed by a programming instruction, the
図1に示されている機能装置を参照すると、中央コントローラ20は、ユーザ入力装置6からの入力を処理すると共に、さらに他の機能装置に制御及び処理を提供するように動作可能である。作業メモリ30が、中央コントローラ20及び他の機能装置による使用のために設けられる。
Referring to the functional device shown in FIG. 1, the
入力データインタフェース40は、処理装置2内の入力データの記憶を制御するように動作可能である。データは、たとえば記憶媒体42上に記憶されるデータ又は処理装置2に送信される信号44として、処理装置2に対する入力とすることができる。この実施形態では、入力データは、変化が検出されるシーンの基準画像と、基準画像に対する変化を検出するためにリアルタイムで処理されるシーンの画像シーケンスとを規定するデータを含む。
The input data interface 40 is operable to control storage of input data in the
基準画像記憶装置50は、基準画像の画像データと、基準画像データが処理されるときに当該データから導出される他のデータとを記憶するために設けられる。同様に、入力画像記憶装置60は、シーケンス内の各画像の画像データと、後続の処理において当該データから導出されるデータとを記憶するために設けられる。
The reference
水平勾配計算器70及び垂直勾配計算器80は、基準画像の画像データ、及び画像のシーケンス内の各入力画像の画像データを処理して、それらにおける画素ごとの水平及び垂直の勾配成分をそれぞれ計算するように動作可能である。
A horizontal gradient calculator 70 and a
絶対値計算器90は、水平勾配計算器70及び垂直勾配計算器80によって計算された勾配成分の絶対値(符号から独立した大きさ又は振幅である)を計算するように動作可能である。
The
結合振幅計算器94は、水平及び垂直の勾配成分を処理して、画像内の画素ごとの結合勾配振幅値を計算するように動作可能である。
The combined
領域選択器100は、絶対値計算器90によって生成される絶対値の画像から領域を選択するように動作可能である。この実施形態では、領域選択器100は、画像内の異なるサイズの領域及び異なる位置の領域を選択するように動作可能である。
The
連結器110は、領域選択器100によって選択される対応する領域のセット内の絶対値を連結して、対応する領域の各セットの各代表領域値を生成するように動作可能である。
The
相関器120は、連結器110によって生成される、基準画像及び入力画像の対応する領域の代表領域値を比較して相関マップを生成するように動作可能である。
The
画像変化検出器130は、相関器120によって生成される相関マップを処理して、そこから、基準画像と、基準画像と比較される入力画像との間の差異を検出するように動作可能である。
The
ディスプレイコントローラ140は、中央コントローラ20の制御下で、表示装置4を制御してこの表示装置上に画像データを表示するように動作可能である。画像データは、たとえば、基準画像及び処理装置2に入力された入力画像のシーケンス、並びに/又は処理装置2による処理の結果(たとえば変化が検出された領域を識別するためにマークされた入力画像)を含むことができる。
The
出力データインタフェース150は、処理装置2からのデータの出力を制御するように動作可能である。この実施形態では、出力データは、変化が検出された入力画像の領域を画定するか、又は単に変化が検出されたことを示す信号を含むことができる。出力データインタフェース150は、たとえば、(光学CD ROM、半導体ROM、磁気記録媒体等のような)記憶媒体152上のデータ、及び/又は信号154(たとえばインターネットのような通信ネットワークを介して若しくは大気を通じて送信される電気信号若しくは光信号)としてデータを出力するように動作可能である。出力データの記録は、記録装置(図示せず)を使用して、出力信号154を直接又は間接的に記録することによって(たとえば第1の記録を「マスタ」として行い、その後、後続の記録をマスタ又はマスタから派生した記録から行うことによって)行うことができる。
The
図2は、この実施形態において、入力データを処理するために処理装置2によって実行される処理動作を示している。この実施形態では、処理は、入力画像が処理装置2によって受信されるときにリアルタイムで実行される。しかし、当業者は理解するように、入力画像のシーケンスは、代わりに、処理装置2内に記憶して非リアルタイムで処理することができる。
FIG. 2 shows the processing operations performed by the
図2を参照すると、ステップS2−2において、次の入力画像が処理のために選択される(初めてステップS2−2が実行される場合は、これは第1の入力画像である)。 Referring to FIG. 2, in step S2-2, the next input image is selected for processing (if step S2-2 is executed for the first time, this is the first input image).
ステップS2−4において、処理が実行されて、基準画像記憶装置50に記憶されている基準画像の代表領域値と、ステップS2−2において選択された入力画像の代表領域値とが生成される。
In step S2-4, processing is executed to generate the representative area value of the reference image stored in the reference
図3は、ステップS2−4においてこの実施形態で実行される処理動作を示している。特定の処理は、基準画像及び入力画像に対して別個に実行される。これらの処理は、図3において、基準画像処理の場合は「a」で終わるステップ番号によって指定され、入力画像処理の場合は「b」で終わるステップ番号によって指定されている。処理が基準画像及び入力画像の両方で同じ場合、以下の説明は、両方に言及するために包括的な用語「画像」を使用して処理を説明している。 FIG. 3 shows the processing operations performed in this embodiment in step S2-4. Specific processing is performed separately on the reference image and the input image. In FIG. 3, these processes are designated by step numbers ending with “a” in the case of reference image processing, and designated by step numbers ending with “b” in the case of input image processing. If the processing is the same for both the reference image and the input image, the following description describes the processing using the generic term “image” to refer to both.
図3を参照すると、処理における第1の段階は、基準画像(ステップS3−2a)及び入力画像(ステップS3−2b)のそれぞれにおける画像データの均一性の空間変化率を規定する、これらの画像における画素値の空間導関数成分の計算である。この処理は、両方のステップS3−2a及びS3−2bにおいて同じであり、画像の画像関数の偏導関数を評価することから成る。導関数は、各特定の用途に最も適切な様態で評価することができる。この実施形態では、水平及び垂直の勾配は偏導関数として計算される。しかし、当業者は理解するように、異なる方向における勾配を(互いに直交であるか否かを問わず)適切な場合に代わりに使用することができる。さらに、異なるタイプの導関数を後述するように計算することができる。 Referring to FIG. 3, the first stage in the process is to define these images that define the spatial change rate of uniformity of image data in each of the reference image (step S3-2a) and the input image (step S3-2b). Is the calculation of the spatial derivative component of the pixel value at. This process is the same in both steps S3-2a and S3-2b and consists of evaluating the partial derivative of the image function of the image. The derivative can be evaluated in the most appropriate manner for each particular application. In this embodiment, the horizontal and vertical gradients are calculated as partial derivatives. However, as those skilled in the art will appreciate, gradients in different directions (whether or not orthogonal to each other) can be used instead where appropriate. In addition, different types of derivatives can be calculated as described below.
この実施形態では、水平勾配計算器70及び垂直勾配計算器80は、ステップS3−2a及びS3−2bにおいて、ソーベルオペレータを使用して水平及び垂直の勾配計算を実行する。ソーベルフィルタ係数は水平方向及び垂直方向のそれぞれに関して以下の通りである:
In this embodiment, horizontal gradient calculator 70 and

これらのフィルタは有利には、勾配に対応する方向においては係数[1 0 −1]、逆の方向においては係数[1 2 1]を用いる分離可能フィルタリングを介して実施することができる。本発明は、オペレータのこの選択には限定されず、当業者には既知であるように、ソーベルフィルタの代わりに使用することができる多くの他の離散微分近似法が存在することに留意されたい。同様に、勾配オペレータのサイズは目下説明されている実施形態のサイズには限定されない。 These filters can advantageously be implemented via separable filtering using coefficients [1 0 -1] in the direction corresponding to the gradient and coefficients [1 2 1] in the opposite direction. It is noted that the present invention is not limited to this choice of operator and there are many other discrete differential approximation methods that can be used in place of the Sobel filter, as is known to those skilled in the art. I want. Similarly, the size of the gradient operator is not limited to the size of the presently described embodiment.
この実施形態では、画像強度(image intensity)の勾配が計算される。しかし、画像色成分のような他の画素値の勾配も計算することができる。たとえば、赤、緑、及び青の色成分の導関数を計算することができる。 In this embodiment, the gradient of image intensity is calculated. However, other pixel value gradients such as image color components can also be calculated. For example, the derivatives of the red, green, and blue color components can be calculated.
ステップS3−2aにおける処理の結果として、2つの勾配画像が基準画像に関して生成され、一方は画素ごとの各水平勾配値を含み、他方は画素ごとの各垂直勾配値を含む。同様に2つの勾配画像がステップS3−2bにおいて入力画像に関して生成される(R、G、B色成分の勾配が計算された場合、6つの勾配画像が画像ごとに結果的に生じるであろう。すなわち色成分ごとに水平及び垂直の勾配画像が生じる)。 As a result of the processing in step S3-2a, two gradient images are generated for the reference image, one containing each horizontal gradient value for each pixel and the other containing each vertical gradient value for each pixel. Similarly, two gradient images are generated for the input image in step S3-2b (if gradients of R, G, B color components are calculated, six gradient images will result for each image. That is, horizontal and vertical gradient images are generated for each color component).
ステップS3−3における処理は任意選択の処理であり、この処理では、その値が基準画像又は入力画像のいずれかにおいて画素値のダイナミックレンジの極値であるか又は当該極値に近い画素が識別及び処理され、それによってこれらの画素は後続の処理において無視される。たとえば、[0、255]の範囲内の画素値の場合、基準画像又は入力画像のいずれかにおける、第1の閾値(たとえば250)よりも大きい強度を有する画素、及び第2の閾値(たとえば5)よりも小さい強度を有する画素は無視することができる。これは、画像のうちの1つにおいて、照度の変化がクリッピング/飽和をもたらす場合に有益である。クリップされた画像にはないがクリップされていない画像には存在する細部は、後続の相関処理(後述する)において変化が誤って検出されることをもたらす可能性がある。この実施形態では、ステップS3−2aにおいて生成される勾配画像の両方、及びステップS3−2bにおいて生成される勾配画像の両方において、この種の画素が識別され、画素の対応する勾配値がゼロに設定される。このように、基準画像又は入力画像のいずれかにおける、第1の閾値を上回るか又は第2の閾値を下回る強度を有する画素は、4つの全ての勾配画像(基準画像から2つ及び入力画像から2つ)においてその勾配成分をゼロに設定することによって、後続の処理において無視される。 The process in step S3-3 is an optional process. In this process, a pixel whose value is the extreme value of the dynamic range of the pixel value in either the reference image or the input image is identified. And processed so that these pixels are ignored in subsequent processing. For example, in the case of a pixel value within the range [0, 255], a pixel having an intensity greater than a first threshold (eg, 250) and a second threshold (eg, 5) in either the reference image or the input image. Pixels with an intensity less than) can be ignored. This is beneficial if the change in illumination results in clipping / saturation in one of the images. Details that are not in the clipped image but present in the uncripped image can lead to false detection of changes in subsequent correlation processing (described below). In this embodiment, this kind of pixel is identified both in the gradient image generated in step S3-2a and in the gradient image generated in step S3-2b, and the corresponding gradient value of the pixel is zero. Is set. Thus, pixels having intensities above the first threshold or below the second threshold in either the reference image or the input image are all four gradient images (two from the reference image and two from the input image). By setting the gradient component to zero in 2), it is ignored in subsequent processing.
ステップS3−4a及びS3−4bにおいて、処理が実行されて、ステップS3−2a及びS3−2bにおいて計算された各勾配値の符号(すなわち、プラス又はマイナスの符号)が除去され、各値が符号無しの値に変換される。この実施形態では、これは、ステップS3−2a及びS3−2bにおいて計算された各勾配値の絶対値(すなわち、符号から独立している振幅又は大きさ)を計算する絶対値計算器90によって行われる。この処理の理由は、勾配特性の極(正又は負)が、照度条件に従って、たとえば、照度の主な方向が変化する場合に、変化し得るということである。この効果は、図4a及び図4bに示されており、これらの図は、小さなウィンドウ内の理想的な物体の1つのエッジに沿う照度条件における変化の予測される効果を示している。図4aでは、第1の面200が照明され、第2の面210は暗くなっている。図4bでは状況は逆であり、第1の面200が暗くなっており、第2の面210が照明されている。このエッジに沿う垂直及び水平の勾配成分は、極(符号)を逆にされるが、その比率は同じままである。理由を理解するために、水平導関数と垂直導関数との比率はエッジの方向を符号化し、これは照明の変化の影響を受けないことに留意されたい。後に説明されるように、この実施形態において画像ブロックに関して使用される比較関数は、勾配振幅成分の比率を保つ効果に対して不変である。したがって、図4a及び図4bの画像の場合、構造変化ではなく、照度変化が生じたと判断される。
In steps S3-4a and S3-4b, processing is performed to remove the sign (ie, plus or minus sign) of each gradient value calculated in steps S3-2a and S3-2b, and each value is signed. Converted to a value with no. In this embodiment, this is done by an
ステップS3−4aにおける処理の結果として、画素ごとの符号無しの勾配値(この実施形態では絶対勾配値)を備える2つの勾配画像が基準画像に関して生成される。同様に、画素ごとの符号無しの勾配値を備える2つの勾配画像が、ステップS3−4bにおいて入力画像に関して生成される。 As a result of the processing in step S3-4a, two gradient images with unsigned gradient values (absolute gradient values in this embodiment) for each pixel are generated for the reference image. Similarly, two gradient images with unsigned gradient values for each pixel are generated for the input image in step S3-4b.
ステップS3−5における処理は任意選択の処理である。この処理では、ステップS3−4aにおいて基準画像に関して生成された勾配画像が処理されて、勾配画像内の対応する画素(すなわち、水平及び垂直の勾配画像において同じ位置を有する画素)の対ごとに結合勾配振幅値が計算される。同様に、ステップS3−4bにおいて入力画像に関して生成された勾配画像が処理されて、これらの勾配画像内の対応する画素の対ごとに結合勾配振幅値が計算される。基準画像及び入力画像の両方における、振幅閾値を下回る結合勾配振幅値を有する画素は、識別及び処理され、それによって後続の処理において無視される。 The process in step S3-5 is an optional process. In this process, the gradient image generated for the reference image in step S3-4a is processed and combined for each pair of corresponding pixels in the gradient image (ie, pixels having the same position in the horizontal and vertical gradient images). A gradient amplitude value is calculated. Similarly, the gradient images generated for the input images in step S3-4b are processed to calculate a combined gradient amplitude value for each corresponding pair of pixels in these gradient images. Pixels with combined gradient amplitude values below the amplitude threshold in both the reference image and the input image are identified and processed, and are thus ignored in subsequent processing.
より詳細には、この実施形態では、結合勾配振幅値 More specifically, in this embodiment, the combined gradient amplitude value
は水平勾配画像及び垂直勾配画像において同じ位置にある画素の対ごとに、結合振幅計算器94によって以下のように計算される:
Is calculated by the combined
式中、 Where
及び as well as
は、基準画像の処理の場合にステップS3−4aにおいて生成され又は入力画像の処理の場合にステップS3−4bにおいて生成された勾配画像から得られる、水平方向及び垂直方向における画像導関数(勾配成分値)である。 Are the image derivatives (gradient components) in the horizontal and vertical directions generated in step S3-4a in the case of reference image processing or obtained from the gradient image in step S3-4b in the case of input image processing. Value).
結合振幅計算器94は、基準画像に関して計算された各結合勾配振幅値と振幅閾値とを比較して、この閾値を下回る結合勾配振幅値を識別する。同様に、結合振幅計算器94は、入力画像に関して計算された各結合勾配振幅値と同じ振幅閾値とを比較し、この閾値を下回る結合勾配振幅値を識別する。結合振幅計算器94はその後、基準画像及び入力画像の両方において、振幅閾値を下回る結合勾配振幅値を有する画素を識別する。その後、このような識別された画素ごとに、結合振幅計算器94は、ステップS3−4aにおいて基準画像に関して生成された2つの勾配画像において、またステップS3−4bにおいて入力画像に関して生成された2つの勾配画像において、これらの画素の絶対勾配値を0に設定する。勾配絶対値を0に設定することは、画素が後続の処理において考慮されないことを確実にする。
The combined
ステップS3−5において実行される閾値化(thresholding)の利点は、不安定な測定値を除去することである。非常に小さい勾配成分値を有する画素は、付加ノイズによって影響を受ける可能性がより高く、構造は後続の処理において振幅の相対比率によって測定されるため、初期値が小さい場合、小さい振幅変化でさえ結果を乱す可能性がある。このように除去される画素は、画像内の「フラットな」(均一な)領域に対応し、構造のみが、ランダムで大部分が不可視の変化に起因する。このような領域は重要な変化の検出に関して情報を提供しないため、これらを無視することは損害をもたらさない。 The advantage of thresholding performed in step S3-5 is to remove unstable measurements. Pixels with very small gradient component values are more likely to be affected by additive noise, and the structure is measured by the relative proportions of amplitude in subsequent processing, so even small amplitude changes when the initial value is small May disturb results. The pixels removed in this way correspond to “flat” (uniform) regions in the image, only the structure is due to random and mostly invisible changes. Since such areas do not provide information regarding the detection of significant changes, ignoring them will not cause damage.
上述した結合振幅値以外の特性は代替的に、水平方向及び垂直方向における絶対値の和又は単に絶対値の最大値のように、測定及び閾値化することができることに留意されたい。 It should be noted that characteristics other than the combined amplitude values described above can alternatively be measured and thresholded, such as the sum of absolute values in the horizontal and vertical directions or simply the maximum of the absolute values.
ステップS3−5の後の後続の処理では、画素の近傍セット(すなわち、画素の対応する領域)が共に処理される。したがって、ステップS3−6aにおいて、領域選択器100は、ステップS3−4aにおいて生成された(且つステップS3−5において変更された)、基準画像の勾配振幅画像から近傍(領域)を選択し、ステップS3−6bにおいて入力画像に関して同じ処理を実行する。ステップS3−6a及びS3−6bにおいて選択された領域は同じであり、その結果、これらの領域は基準画像及び入力画像では同一である。この実施形態では、領域は正方形又は矩形のブロックであるが、概して、任意の形状の領域から成ることができる。幾つかの実施態様では、矩形ブロックが、2の累乗である寸法を有することが有利である。なぜなら、これが、メモリアドレス指定をより効率的にし、したがって良い計算効率を提供するためである。この実施形態では、ブロックのサポートが空間において連続しているが、これは必須条件ではない。穴又は非連続サポートを有するブロック又は近傍は同様に有効である。形状にかかわらず、これらのブロックは、照明不変構造比較(後述する)において使用される領域を選択する。
In subsequent processing after step S3-5, a neighborhood set of pixels (ie, a corresponding region of pixels) is processed together. Accordingly, in step S3-6a, the
この実施形態では、様々なサイズの領域が選択される。さらに、この実施形態では、領域のうちの幾つかは重なり合うように、複数の位置における領域が選択される。より詳細には、3つの異なるサイズの領域が、32×32画素、16×16画素、及び8×8画素と画定される。それぞれのサイズごとに、半分の領域サイズのシフトステップが各方向において使用され、画像内の異なる位置における領域が画定される。 In this embodiment, various size regions are selected. Furthermore, in this embodiment, regions at a plurality of positions are selected such that some of the regions overlap. More specifically, three different sized regions are defined as 32 × 32 pixels, 16 × 16 pixels, and 8 × 8 pixels. For each size, a half region size shift step is used in each direction to define regions at different locations in the image.
異なるサイズのブロックを選択する理由は、図5a及び図5bに示されている。図5aは、異なる(しかし均一でもある)強度の背景に対して均一の強度の楕円形物体の画像を表す。基準画像は均一の背景のみを含むと仮定する。構造のブロックごとの比較は、中央ではなく、物体の周辺の辺りの線影付けされたブロックにおける変化を検出する。近傍ブロック300、310、及び320はこの物体の存在によって有効化されない。これは、各ブロック内の画素の全てが同じように変化し、結果として強度の変化を照度変化でモデル化することができるためである。換言すると、外見上の構造が変化しないため、システムはここでは何も検出しない。これが、上述した「窓」問題である。
The reason for selecting different sized blocks is shown in FIGS. 5a and 5b. FIG. 5a represents an image of an elliptical object of uniform intensity against a background of different (but also uniform) intensity. Assume that the reference image contains only a uniform background. The block-by-block comparison of the structure detects changes in the shaded blocks around the periphery of the object, not the center. Neighboring
図5bでは、対照的に、窓問題はない。これは近傍のより大きいサイズによって、ブロックが物体を完全にカバーすることができるためである。当然のことながら、検出されるエリア全体が大きくなるため、代わりに位置特定精度が低減するという不利益が生じる。このため、この実施形態は、様々な異なるスケール(すなわち、異なる領域サイズ)にわたって得られる測定値を統合し、それによって窓問題に対処する。 In FIG. 5b, in contrast, there is no window problem. This is because the block can fully cover the object due to the larger size of the neighborhood. As a matter of course, since the entire detected area becomes large, there is a disadvantage that the position specifying accuracy is reduced instead. For this reason, this embodiment integrates measurements obtained over a variety of different scales (ie, different region sizes), thereby addressing the window problem.
任意選択的に、幾つかの状況では、ステップS3−6a及びS3−6bにおいて選択された近傍内の画素を重み付けすることが有利である。たとえば、正方形領域の場合、画素値は、正方形の中央に配される(centred)ガウス関数によって重み付けすることができる。テーパ関数(tapered function)によって、このように重み付けすることは、近傍の中央近くの画素が、後続の比較の結果に対して、比較的大きい影響を有することを意味する。これは、構造変化を位置特定する際に利益をもたらす。 Optionally, in some situations, it is advantageous to weight the pixels in the neighborhood selected in steps S3-6a and S3-6b. For example, in the case of a square region, pixel values can be weighted by a Gaussian function that is centered in the square. This weighting by means of a taper function means that pixels near the center of the neighborhood have a relatively large influence on the result of subsequent comparisons. This provides benefits in locating structural changes.
ステップS3−6aにおける処理の結果として、複数の領域が、基準画像の勾配画像のそれぞれにおいて画定されており、各領域は絶対値を含む。各勾配画像内の領域は、他方の勾配画像内の領域の位置と同じ位置を有する。同様に、1つの勾配画像内で画定される領域の異なるサイズは、他方の勾配画像内で画定される領域の異なるサイズと同じである。結果として、同じサイズ及び同じ位置を有する対応する領域が勾配画像内に存在する。勾配画像からの対応する領域は、本明細書では対応する領域の「セット」と呼ばれる。同じように、ステップS3−6bにおける処理は、入力画像の勾配画像内の絶対値の同じ領域を生成する。 As a result of the processing in step S3-6a, a plurality of regions are defined in each of the gradient images of the reference image, and each region includes an absolute value. The region in each gradient image has the same position as the region in the other gradient image. Similarly, the different sizes of the areas defined in one gradient image are the same as the different sizes of the areas defined in the other gradient image. As a result, corresponding regions having the same size and the same position are present in the gradient image. The corresponding region from the gradient image is referred to herein as a “set” of the corresponding region. Similarly, the processing in step S3-6b generates a region having the same absolute value in the gradient image of the input image.
ステップ3−8a〜S3−12aにおいて、基準画像に関して処理が実行されて、対応する領域のセットごとの代表領域値が生成される。同じ処理がステップS3−8b〜S3−12bにおいて入力画像に関して実行される。この処理は、基準画像に関して後述されるが、入力画像の処理は同じである。 In steps 3-8a to S3-12a, processing is performed on the reference image to generate a representative region value for each corresponding region set. The same processing is executed for the input image in steps S3-8b to S3-12b. This process will be described later with respect to the reference image, but the process of the input image is the same.
より詳細には、ステップS3−8aにおいて、連結器110は、基準画像の勾配画像から対応する領域の次のセットを選択する。この実施形態では、2つの勾配画像(水平及び垂直)が存在するため、セットは2つの領域を含む。各領域は自身のそれぞれの勾配画像において同じ位置及びサイズを有する。
More specifically, in step S3-8a, the
ステップS3−10aにおいて、連結器110は、ステップS3−8aにおいて選択された領域内の勾配絶対値を連結して領域ベクトルを形成する。
In step S3-10a, the
より詳細には、セットの領域内の全ての(場合によっては重み付けされる)絶対画素勾配値が連結されて、単一の領域ベクトルが形成される。ベクトルの次元は、領域のサイズ及び勾配画像の数によって決まる。この実施形態では、画素強度が考慮されるため、画像ごとに2つの勾配画像が存在する。したがってステップS3−10aにおいて生成される領域ベクトルの次元は2NBであり、ここで、NBは各領域内の画素の数である。より多くの勾配画像が、たとえば複数の色チャネルのそれぞれに関して計算される場合、2NCNBの要素が各ベクトル内に存在することになり、ここで、NCはチャネルの数である。 More particularly, all (possibly weighted) absolute pixel gradient values within a set of regions are concatenated to form a single region vector. The dimension of the vector depends on the size of the region and the number of gradient images. In this embodiment, since the pixel intensity is taken into account, there are two gradient images for each image. Therefore, the dimension of the region vector generated in step S3-10a is 2N B , where N B is the number of pixels in each region. If more gradient images are calculated for each of a plurality of color channels, for example, 2N C N B elements will be present in each vector, where N C is the number of channels.
絶対画素勾配値がベクトル内で配置される順序は、ステップS3−10a及びS3−10bにおける処理中に、基準画像及び入力画像にそれぞれ、同じ順序が使用されているならば、問題ではない。 The order in which the absolute pixel gradient values are arranged in the vector is not a problem if the same order is used for the reference image and the input image, respectively, during the processing in steps S3-10a and S3-10b.
ステップS3−12aにおいて、連結器110は、対応する領域の別のセットが処理されるために残っているか否かを判断する。ステップS3−8a〜S3−12aは、対応する領域の各セットが上述したように処理されるまで繰り返される。
In step S3-12a,
この処理の結果として、代表領域値(この実施形態ではベクトル)が基準画像内の複数の領域のそれぞれに関して生成されたことになる。各領域は異なるサイズ及び位置を基準画像内で有し、各領域値は領域内の画素の勾配値の振幅を表す。 As a result of this processing, representative region values (vectors in this embodiment) are generated for each of the plurality of regions in the reference image. Each region has a different size and position in the reference image, and each region value represents the amplitude of the gradient value of the pixels in the region.
上述したように、基準画像に関してステップS3−8a〜S3−12aにおいて実行された処理と同じ処理がステップS3−8b〜S3−12bにおいて入力画像に関して実行され、それによって入力画像内の領域ごとの代表領域値が生成される(基準画像の領域と入力画像の領域とは同じである)。 As described above, the same processing as that performed in steps S3-8a to S3-12a with respect to the reference image is performed with respect to the input image in steps S3-8b to S3-12b, thereby representing each region in the input image. Region values are generated (the region of the reference image and the region of the input image are the same).
再び図2を参照すると、ステップS2−6において、相関器120が、基準画像及び選択された入力画像の対応する領域(すなわち、基準画像及び入力画像内の同じ位置及びサイズを有する領域)からの代表領域値を比較して相関マップを生成する。より詳細には、代表領域値の対ごとに相関値が生成され、後述するように、相関値が相関マップ内に記憶される。
Referring again to FIG. 2, in step S2-6, the
ステップS2−6において実行される相関処理は、勾配振幅の線形スケーリングに対して不変であるように設計される。この実施形態では、これは、対応する領域ベクトル(すなわち、ステップS3−10aにおいて基準画像内の領域に関して生成される領域ベクトル、及びステップS3−10bにおいて同じ位置及びサイズを有する入力画像内の領域に関して生成される領域ベクトル)の各対の間の角度の余弦を計算することによって達成される。ベクトルの対が線形スケーリングによって関連付けられる場合、2つの間の角度はゼロになる。したがって、余弦は1になる。この実施形態では、余弦は、内積を使用して以下のように計算される: The correlation process performed in step S2-6 is designed to be invariant to linear scaling of the gradient amplitude. In this embodiment, this is for the corresponding region vector (ie, the region vector generated for the region in the reference image in step S3-10a and the region in the input image that has the same position and size in step S3-10b). This is accomplished by calculating the cosine of the angle between each pair of generated region vectors). If a vector pair is related by linear scaling, the angle between the two will be zero. Therefore, the cosine is 1. In this embodiment, the cosine is calculated using the dot product as follows:
式中、vinは入力画像領域ベクトルであり、vrefは基準画像領域ベクトルであり、|v|はベクトルノルム(vector norm)を示す。 Wherein, v in is the input image region vectors, v ref is the reference image region vectors, | v | indicates the vector norm (vector norm).
このステップにおいて式(2)によって規定されるロバスト比較方法の数値的に効率的な実施に関しては幾つかの可能性がある。余弦公式を個別のベクトル成分に関して展開することによって、余弦公式は画素ごとの乗算の総和から成るようにみなすことができる: There are several possibilities for a numerically efficient implementation of the robust comparison method defined by equation (2) in this step. By expanding the cosine formula with respect to individual vector components, the cosine formula can be viewed as consisting of the sum of multiplications per pixel:
式中、v(i)はベクトルvのi番目の要素を示す。各乗算は1回のみ実施されるべきであり、入力ブロックがシフトパターンに起因して重なり合う場合、結果は再使用のために記憶される。したがって、3つの積画像(product image)が規定される: In the formula, v (i) indicates the i-th element of the vector v. Each multiplication should be performed only once and if the input blocks overlap due to the shift pattern, the result is stored for reuse. Thus, three product images are defined:
ここで、余弦計算は、これらの積画像からの要素の選択及び総和にのみに依存し、その後、単一の乗算、平方根、及び除算が生じる。さらに、このような総和を実現する効率的な方法が存在する。たとえば、入力ブロックが各ステップにおいて1画素だけシフトされる場合、総和は、積画像のそれぞれに対する線形フィルタリング演算に等価である。そして、分離可能フィルタを選択することによって計算をさらに向上させることができる。同時に、線形フィルタの使用は、上述したテーパ中心重み付けの簡単な実現を可能にし、フィルタ係数はまさに説明した重みであることに留意されたい。式(4)、(5)、及び(6)を評価するためにこの実施形態において実行される処理は図6に示されている。 Here, the cosine calculation depends only on the selection and summation of elements from these product images, after which a single multiplication, square root and division occur. In addition, there are efficient ways to achieve such summation. For example, if the input block is shifted by one pixel at each step, the sum is equivalent to a linear filtering operation on each of the product images. And the calculation can be further improved by selecting a separable filter. At the same time, it should be noted that the use of a linear filter allows a simple realization of the taper center weighting described above, and the filter coefficients are just the described weights. The processing performed in this embodiment to evaluate equations (4), (5), and (6) is shown in FIG.
重み付けが必要でなく且つ入力近傍が矩形の形状(又は少なくとも矩形の結合)に制約される用途では、代替の効率的な実施態様が、エリア総和テーブル(summed area tables)(F. Crow著「Summed-area tables for texture mapping」(in Proc. SIGGRAPH, 18 (3): 207-212, 1984))としても既知である、積分画像(integral images)の方法(P. Viola及びM. Jones著「Rapid object detection using a boosted cascade of simple features」(In Proc . IEEE Conference on Computer Vision and Pattern Recognition, Dec. 2001))によって達成される。データの積分表現への変換は、高速な計算を提供し、4つのみの画素基準値(矩形の角の座標値)と、総和ごとの3回の加算演算とを伴う。重要なことに、これは、ブロックサイズにかかわらず、総和の計算コストを一定にする。 For applications where no weighting is required and the input neighborhood is constrained to a rectangular shape (or at least a combination of rectangles), an alternative efficient implementation is the summed area tables ("Summed by F. Crow" -area tables for texture mapping "(in Proc. SIGGRAPH, 18 (3): 207-212, 1984)), the method of integral images (" Rapid "by P. Viola and M. Jones) object detection using a boosted cascade of simple features "(In Proc. IEEE Conference on Computer Vision and Pattern Recognition, Dec. 2001)). The conversion of the data into an integral representation provides a fast calculation and involves only four pixel reference values (rectangular corner coordinate values) and three addition operations per summation. Importantly, this keeps the total computational cost constant regardless of the block size.
この手法に従事する一実施形態では、積分積画像は以下のように生成することができる: In one embodiment engaged in this approach, the integral product image can be generated as follows:
これは、各場合において、画像上のシングルパスによって達成され、画素ごとの2回の加算演算を伴う。 This is achieved in each case by a single pass over the image, involving two addition operations per pixel.
上記において、幾つかの画素は有利には、画像の強度又は結合勾配振幅が測定値を信頼できないものにするか又は不安定にするため、ステップS3−3及び/又はステップS3−5において無視することができることを述べた。したがって、画素の領域の全体が「無視された」画素から成ることが生じ得る。この状況に対処するために様々な方法が存在する。この実施形態では、ステップS2−6における処理においてcosθ=1の値がこのような領域に割り当てられ、これは、無視された画素は構造において何の変化も含まないことを暗に仮定している。 In the above, some pixels are advantageously ignored in step S3-3 and / or step S3-5 because the intensity or combined gradient amplitude of the image makes the measurement unreliable or unstable. Said that you can. Thus, it can happen that the entire area of pixels consists of “ignored” pixels. There are various ways to deal with this situation. In this embodiment, the value of cos θ = 1 is assigned to such a region in the processing in step S2-6, which implicitly assumes that the ignored pixels do not contain any change in the structure. .
領域内の画素の幾つかのみが無視される場合、相関/余弦計算が通常通り進行するため問題はない。この場合では、無視される勾配値をゼロ(ステップS3−3)、又は勾配振幅をゼロ(ステップS3−5)に事前に設定することによって、非ゼロ成分間の角度の余弦のみが効率的に計算される。 If only some of the pixels in the region are ignored, there is no problem because the correlation / cosine calculation proceeds as usual. In this case, only the cosine of the angle between the non-zero components is efficiently achieved by presetting the neglected gradient value to zero (step S3-3) or the gradient amplitude to zero (step S3-5). Calculated.
概して、各余弦尺度は、基準領域及び入力領域における勾配振幅成分が、互いのスケーリングされたコピーであるとき、すなわち、vin=αvrefであるとき、1の最大値に達する。この状況は、図4a及び図4bに示されている照度極の変化を含む。 In general, each cosine measure reaches a maximum value of 1 when the gradient amplitude components in the reference and input regions are scaled copies of each other, ie, v in = αv ref . This situation includes the change in illuminance pole shown in FIGS. 4a and 4b.
上述したように、ステップS2−6における処理は、(基準画像内の領域と、同じ位置にあり且つ同じサイズを有する入力画像内の領域とを含む)対応する領域の各対の相関値(この実施形態では余弦値)を生成する。 As described above, the processing in step S2-6 includes the correlation value of each pair of corresponding regions (including the region in the reference image and the region in the input image at the same position and the same size) (this In the embodiment, a cosine value) is generated.
基準画像及び入力画像と同じサイズの相関マップを生成するために、画像空間にわたって且つ複数のスケールにわたって、結果的に得られた余弦値の割り当て及び結合を実施する多くの異なる方法が存在する。選択は典型的には、所望の計算複雑性及び位置特定精度に依存する。 There are many different ways to perform the assignment and combination of the resulting cosine values across the image space and across multiple scales to generate a correlation map of the same size as the reference image and the input image. The selection typically depends on the desired computational complexity and location accuracy.
たとえば、領域の単一のサイズがステップS3−6a及びS3−6bにおいて選択され、且つ重ね合わせを一切伴わないブロックシフトパターンが使用される、非常に基本的な実施形態の場合、領域ごとの余弦計算の結果は、相関マップ内のこの領域内の全ての画素に割り当てることができる。シフトパターン及び出力割り当ては、相関マップの実行解像度を決定する。 For example, in a very basic embodiment where a single size of region is selected in steps S3-6a and S3-6b and a block shift pattern without any overlay is used, the cosine for each region The result of the calculation can be assigned to all pixels in this region in the correlation map. The shift pattern and output assignment determine the execution resolution of the correlation map.
領域がステップS3−6a及びS3−6bにおいて重なり合うように選択される場合、(たとえば領域をブロックの中央領域に割り当てることによって)領域が重なり合わないように出力余弦値を割り当てるか又は領域が重なり合ように出力余弦値を割り当てるかが選択される。後者の場合では、隣接し重なり合うブロックからの測定値を統合するために結合の或る方法が必要である。同様に、結合は、処理が様々な異なるスケールにおいて行われる場合に一般的に必要である。異なるサイズ及び/又は異なる位置の領域の余弦値の結合は、総和(若しくは平均化)、最小値、最大値、又は積(若しくは幾何平均)を含む(しかしこれらに限定されない)任意の適切な規則を採用することができる。総和規則は、たとえば、基準画像及び入力画像と同じサイズのアキュムレータアレイを維持することによって実施することができる。(任意のサイズの)処理される領域ごとに、結果的に得られる余弦値がアキュムレータ内の各出力領域画素のそれぞれに加えられる。その後、各画素が出力領域の同じ数、すなわちNoverlapによってカバーされる場合、累算された値は正確な範囲[0、Noverlap]内にある。 If regions are selected to overlap in steps S3-6a and S3-6b, assign output cosine values so that regions do not overlap (eg, by assigning regions to the central region of the block) or regions overlap Whether to assign an output cosine value is selected. In the latter case, some method of combination is required to integrate measurements from adjacent and overlapping blocks. Similarly, coupling is generally necessary when processing is performed at a variety of different scales. The combination of cosine values of regions of different sizes and / or different locations includes any suitable rule, including (but not limited to) a sum (or average), minimum, maximum, or product (or geometric mean) Can be adopted. Sum rules can be implemented, for example, by maintaining an accumulator array of the same size as the reference image and the input image. For each region to be processed (of any size), the resulting cosine value is added to each of the output region pixels in the accumulator. Then, if each pixel is covered by the same number of output regions, ie N overlap , the accumulated value is in the exact range [0, N overlap ].
この実施形態では、半分のブロックサイズのシフトステップが各方向において使用される。余弦測定の結果は、図7a、図7b、及び図7cに示されているように、相関マップ内の各ブロックの中央象限(central quadrant)における各画素に割り当てられる。これらの図では、入力ブロックはより大きい正方形によって実線で示されており、一方、より小さい出力ブロックが点線によって示されている。図は、基準画像及び入力画像内のブロック500の3つの例の位置と、相関マップ内の関連付けられているブロック510とを強調している。これは、基準画像及び入力画像内のブロック選択の重なり合っているパターンにもかかわらず、相関マップ内のブロックがどのように重なり合わないかを示している。この例では、ブロック500の余弦測定値は、相関マップ内のブロック510内の全ての画素に割り当てられる。
In this embodiment, half block size shift steps are used in each direction. The result of the cosine measurement is assigned to each pixel in the central quadrant of each block in the correlation map, as shown in FIGS. 7a, 7b, and 7c. In these figures, the input blocks are indicated by solid lines with larger squares, while the smaller output blocks are indicated by dotted lines. The figure highlights three example positions of the
この実施形態では、32×32画素、16×16画素、及び8×8画素のブロックを有する3つのスケールが使用されている。結果的に得られる相関マップ(スケールごとに1つ)は、総和によって結合され、最終的な相関マップが生成される。 In this embodiment, three scales with 32 × 32 pixel, 16 × 16 pixel, and 8 × 8 pixel blocks are used. The resulting correlation maps (one for each scale) are combined by summation to produce the final correlation map.
再び図2を参照すると、ステップS2−8において、画像変化検出器130が、ステップS2−6において生成された相関マップを処理して、基準画像と入力画像との間の重要な構造変化を検出する。上述したように、この実施形態における相関マップは、垂直方向及び水平方向において基準画像及び入力画像と同じ数の画素を有し、画素ごとに単一の実数値の数を含む。したがって、単純な実施形態では、ステップS2−8における処理は、各値の閾値に対する比較を含み、値は閾値を下回る場合は値1に置き換えられ、そうでない場合は値0に置き換えられる。これは、値1を有する画素が画像における重要な構造変化のロケーションを規定するバイナリマップを提供する。
Referring back to FIG. 2, in step S2-8, the
より発展した実施形態では、出力をさらに処理して、誤って検出された変化を抑制することが有利であり得る。このような後処理は、たとえば、特定のエリアよりも小さい、値1を有する画素の連続する「ブロブ」が拒絶される、サイズベースの処理を含むことができる。この後処理はまた、たとえば「Digital Image Processing」(Second Edition by Gonzalez and Woods, Practice-Hall 2003, pages 519 to 560)において記載されているような技法を使用して特定の形状(及びサイズ)のブロブ(blobs)が拒絶される形態学的処理(morphological processing)(グレースケール又はバイナリのいずれか)を含むことができる。概して、このタイプの処理は、興味対象の構造が特定のサイズ及び形状属性を有し、これらがこれらの構造をノイズに起因する反応から区別するという仮定を反映するであろう。 In more advanced embodiments, it may be advantageous to further process the output to suppress erroneously detected changes. Such post-processing can include, for example, size-based processing where successive “blobs” of pixels having a value of 1 that are smaller than a particular area are rejected. This post-processing can also be done for specific shapes (and sizes) using techniques such as those described, for example, in “Digital Image Processing” (Second Edition by Gonzalez and Woods, Practice-Hall 2003, pages 519 to 560). It can include morphological processing (either grayscale or binary) in which blobs are rejected. In general, this type of processing will reflect the assumption that the structures of interest have specific size and shape attributes, which distinguish these structures from reactions due to noise.
後処理は時間領域及び空間領域において作用することができる。たとえば、有効な物体が特定の最小持続時間を有すると仮定される場合、より短い持続時間を有する検出は除外することができる。これは、誤った検出が素早く連続して現れて消失する「ちらつき」ノイズの低減をもたらすことができる。 Post-processing can operate in the time domain and the spatial domain. For example, if a valid object is assumed to have a certain minimum duration, detection with a shorter duration can be ruled out. This can lead to a reduction in “flicker” noise in which false detections appear and disappear quickly and continuously.
再び図2を参照すると、ステップS2−10において、シーケンス内の別の入力画像が処理されるべきか否かが判断される。ステップS2−2〜S2−10は、各入力画像が上述したように処理されるまで繰り返される。 Referring again to FIG. 2, in step S2-10, it is determined whether another input image in the sequence should be processed. Steps S2-2 to S2-10 are repeated until each input image is processed as described above.
第2の実施形態
本発明の第2の実施形態をこれより説明する。
Second Embodiment A second embodiment of the present invention will now be described.
第1の実施形態では、(図4a及び図4bにおいて示されており且つこれらを参照して説明されたような)勾配極変化をもたらす照度変化の問題が対処されたが、これは、勾配成分の符号無しの値を使用することによるものであった。第2の実施形態では、この問題は、代わりに、ステップS2−6において余弦相関値の符号無しの値を計算することによって対処される。 In the first embodiment, the problem of illuminance change that resulted in a gradient pole change (as shown in and described with reference to FIGS. 4a and 4b) was addressed, which is a gradient component. Of unsigned values. In the second embodiment, this problem is instead addressed by calculating the unsigned value of the cosine correlation value in step S2-6.
第2の実施形態の構成要素、及びこれらによって実行される処理動作は、以下の例外を除いて第1の実施形態におけるものと同じである:
第2の実施形態では、絶対値計算器90は図1に示されている構成要素から省かれる。
第2の実施形態では、ステップS3−4a及びS3−4bは図3に示されている処理から省かれ、後続のステップにおける処理は絶対勾配値ではなく勾配値を使用して実行される。結果として、第2の実施形態では、図3における処理の結果として生成される各代表領域ベクトルは、符号付き勾配成分値を含む。
第2の実施形態においてステップS2−6において相関器120によって実行される処理は、第1の実施形態において実行される処理とは異なる。第2の実施形態において実行される処理は後述する。
The components of the second embodiment and the processing operations performed by them are the same as in the first embodiment with the following exceptions:
In the second embodiment, the
In the second embodiment, steps S3-4a and S3-4b are omitted from the processing shown in FIG. 3, and the processing in subsequent steps is performed using gradient values rather than absolute gradient values. As a result, in the second embodiment, each representative region vector generated as a result of the processing in FIG. 3 includes a signed gradient component value.
In the second embodiment, the process executed by the
第1の実施形態におけるように、第2の実施形態においてステップS2−6において実行される相関処理は勾配の線形スケーリングに対して不変であるように設計される。 As in the first embodiment, the correlation process performed in step S2-6 in the second embodiment is designed to be invariant to the linear scaling of the gradient.
第2の実施形態では、ステップS2−6において、相関器120は、対応する領域ベクトル(すなわち、ステップS3−10aにおいて基準画像内の領域に関して生成される領域ベクトル、及びステップS3−10bにおいて生成される、同じ位置及びサイズを有する、入力画像内の領域ベクトル)の各対の間の角度の符号無しの余弦尺度を計算する。より詳細には、第2の実施形態では、相関器120は、内積を使用して以下のように絶対余弦値を計算する:
In the second embodiment, in step S2-6, the
式中、vinは入力画像領域ベクトルであり、vrefは基準画像領域ベクトルであり、‖v‖はベクトルノルムを示し、|v|は絶対値を示す。絶対値オペレータの適用によって、vin又はvrefが極(符号)を変える場合、計算の結果は影響を受けないことが確実になる。 Wherein, v in is the input image region vectors, v ref is the reference image region vectors, ‖V‖ represents a vector norm, | v | indicates the absolute value. Application of the absolute value operator ensures that the result of the calculation is not affected if v in or v ref changes the pole (sign).
このステップにおいて式(10)によって規定されるロバスト比較方法の数値的に効率的な実施に関しては幾つかの可能性がある。余弦公式を個別のベクトル成分に関して展開することによって、余弦公式は画素ごとの乗算の総和から成るようにみなすことができる: There are several possibilities for a numerically efficient implementation of the robust comparison method defined by equation (10) in this step. By expanding the cosine formula with respect to individual vector components, the cosine formula can be viewed as consisting of the sum of multiplications per pixel:
式中、v(i)はベクトルvのi番目の要素を示す。各乗算は1回のみ実施されるべきであり、入力ブロックがシフトパターンに起因して重なり合う場合、結果は再使用のために記憶される。したがって、3つの積画像が規定される: In the formula, v (i) indicates the i-th element of the vector v. Each multiplication should be performed only once and if the input blocks overlap due to the shift pattern, the result is stored for reuse. Thus, three product images are defined:
ここで、余弦計算は、これらの積画像からの要素の選択及び総和にのみに依存し、その後、単一の乗算、絶対値、平方根、及び除算が生じる。さらに、このような総和を実現する効率的な方法が存在する。たとえば、入力ブロックが各ステップにおいて1画素だけシフトされる場合、総和は、積画像のそれぞれに対する線形フィルタリング演算に等価である。そして、分離可能フィルタを選択することによって計算をさらに向上させることができる。同時に、線形フィルタの使用は、上述したテーパ中心重み付けの簡単な実現を可能にし、フィルタ係数はまさに説明した重みであることに留意されたい。式(12)、(13)、及び(14)を評価するためにこのような実施形態において実行される処理は図8に示されている。 Here, the cosine calculation depends only on the selection and summation of elements from these product images, after which a single multiplication, absolute value, square root, and division occur. In addition, there are efficient ways to achieve such summation. For example, if the input block is shifted by one pixel at each step, the sum is equivalent to a linear filtering operation on each of the product images. And the calculation can be further improved by selecting a separable filter. At the same time, it should be noted that the use of a linear filter allows a simple realization of the taper center weighting described above, and the filter coefficients are just the described weights. The process performed in such an embodiment to evaluate equations (12), (13), and (14) is shown in FIG.
実験(Experiments)は、少なくとも幾つかの場合では、余弦の絶対値は、決して最適でないパフォーマンスを提供することを示した。したがって、この実施形態では、変更された余弦尺度が計算される。式(12)の積画像の代わりに、その絶対値が計算される: Experiments have shown that in at least some cases, the absolute value of the cosine provides a performance that is never optimal. Thus, in this embodiment, a modified cosine measure is calculated. Instead of the product image of equation (12), its absolute value is calculated:
構造は、(全体の領域ベクトルにわたってではなく)個別の画素において極の変化に対して不変である。すなわち、入力画像勾配成分 The structure is invariant to changes in poles at individual pixels (not across the entire region vector). That is, the input image gradient component
が But
に置き換えられる場合、p(x、y)の値は影響を受けない。同じことが基準画像勾配成分にも当てはまる。 The value of p (x, y) is not affected. The same applies to the reference image gradient component.
変更
多くの変更を、添付の特許請求の範囲内で、上述した実施形態に対して行うことができる。
Modifications Many modifications can be made to the above-described embodiments within the scope of the appended claims.
たとえば、上述したように、勾配画像の使用は、シーン背景の効率的なモデリングにおいてさらなる利益をもたらす。上記の実施形態では、単一の基準画像が使用される。理想的には、これは、人間の操作者又は或る他の手段のいずれかによって選択される、無人の背景シーンの画像とすることができる。多くの用途では、しかし、このように基準画像を得ることは可能ではないであろう。これは、たとえば、シーンが常に往来若しくは対象物を含むか、又は人間の操作者が大規模ネットワークにおいて全てのカメラをこのように初期設定することは非常に時間がかかるためである。このような状況では、背景モデルを経時的な複数の画像から合成することが可能である。 For example, as described above, the use of gradient images provides additional benefits in efficient modeling of the scene background. In the above embodiment, a single reference image is used. Ideally, this can be an image of an unattended background scene, selected by either a human operator or some other means. In many applications, however, it may not be possible to obtain a reference image in this way. This is because, for example, the scene always includes traffic or objects, or it is very time consuming for a human operator to initialize all cameras in this way in a large network. In such a situation, it is possible to synthesize a background model from multiple images over time.
この場合、システムのより発展した実施形態は、指定された時間期間にわたる異なる入力画像に関してステップS3−2bにおいて生成される複数の勾配画像を記録することができる。その場合、背景モデルは、各画素の勾配成分の中央値を経時的にとることによって形成される。このように勾配領域内の中央値をとることによって、結果的に得られる基準背景モデルは、画像のバッチにおける現在の照度及び移動物体の存在の両方から独立する。これの根拠は、典型的な自然シーンの大規模な反応の希薄さと組み合わされる照度変化の下での画像勾配の相対的恒常性である。他方、画像強度の中央値が代わりに使用される場合、基準背景モデルは学習期間の間、照度変化の影響に対して敏感になるだろう。基準背景モデルはまた、学習期間の間、背景を曖昧にする移動物体の影響をよりはるかに受けやすくなるであろう。 In this case, a more advanced embodiment of the system can record a plurality of gradient images generated in step S3-2b for different input images over a specified time period. In that case, the background model is formed by taking the median of the gradient components of each pixel over time. By thus taking the median value within the gradient region, the resulting reference background model is independent of both the current illumination and the presence of moving objects in the batch of images. The basis for this is the relative constancy of the image gradient under illuminance changes combined with the large-scale sparseness of typical natural scenes. On the other hand, if the median image intensity is used instead, the reference background model will be sensitive to the effects of illumination changes during the learning period. The reference background model will also be much more susceptible to moving objects that obscure the background during the learning period.
上述した学習期間は、オフラインで(すなわち、システムが物体の検出を開始する前に)又はオンラインで(すなわち、物体を検出している間)実行することができる。オンライン学習期間は、各画素における勾配履歴の「スライディングウィンドウ」にわたるメジアンフィルタリング(median filtering)から成り、それによってシーンに対する長期間の変化は、所定のレートでゆっくりと基準モデルに組み込まれる。 The learning period described above can be performed off-line (ie, before the system starts detecting objects) or online (ie, while detecting objects). The online learning period consists of median filtering over a “sliding window” of the gradient history at each pixel, whereby long-term changes to the scene are slowly incorporated into the reference model at a predetermined rate.
上記の実施形態では、基準画像及び各入力画像は、後続の処理における使用のために、ステップS3−2a及びS3−2bにおいて勾配画像を生成するために処理される。勾配画像は、そこから画像構造が分析されると共に変化が測定される強力なプラットフォームを提供するが、同様の強度を提供し、特定の状況ではさらなる利益を伴う他のタイプのフィルタを代わりに使用することができる。画像強度関数の第2の導関数が計算されるラプラシアンフィルタリングが一例であり、ウェーブレットフィルタバンクが別の例である。全ての場合においてアスペクトを統一することは、フィルタリングが、異なる複数の画素位置において画像データの均一性の空間変化率を規定するデータを生成し、ハイパス又はバンドパスのいずれかである、すなわち、空間領域における均一性の低周波数の変化を減衰させ、均一性における中域〜高域周波数変化を減衰(増幅)させるということである。低周波数をこのように抑制することは、典型的には輝度を変化させることによってもたらされるような、領域にわたる一定又は概ね一定の変化を無視するため、有益である。 In the above embodiment, the reference image and each input image are processed to generate gradient images in steps S3-2a and S3-2b for use in subsequent processing. Gradient images provide a powerful platform from which the image structure is analyzed and changes are measured, but provide similar intensities and use other types of filters instead with additional benefits in certain situations can do. An example is Laplacian filtering where the second derivative of the image intensity function is calculated, and another example is a wavelet filter bank. Unifying the aspect in all cases means that the filtering produces data that defines the spatial rate of change of the uniformity of the image data at different pixel positions and is either high pass or band pass, ie spatial That is, the low frequency change in uniformity in the region is attenuated, and the mid to high frequency change in uniformity is attenuated (amplified). Suppressing the low frequency in this way is beneficial because it ignores constant or nearly constant changes across the region, typically caused by changing the brightness.
上記の第1の実施形態においてステップS3−4a及びS3−4bで実行される処理では、各勾配値の符号(すなわち、プラス符号又はマイナス符号)は各勾配値の絶対値を計算することによって除去される。しかし、符号を除去すると同時に結果的に得られる符号無しの値内で或る形態で振幅を維持する任意の他の処理を、代わりに実行することができる。したがって、たとえば、各勾配値の2乗の計算の処理を実行して符号無しの値を生成することができる。 In the processing executed in steps S3-4a and S3-4b in the first embodiment, the sign of each gradient value (ie, plus or minus sign) is removed by calculating the absolute value of each gradient value. Is done. However, any other process that removes the sign while maintaining the amplitude in some form within the resulting unsigned value can be performed instead. Therefore, for example, an unsigned value can be generated by executing a process of calculating the square of each gradient value.
上述の実施形態では、ステップS2−6における処理は、対応する領域ベクトルの各対の間の角度の余弦(第1の実施形態)又は絶対値余弦(absolute cosine)(第2の実施形態)を計算する。しかし、余弦以外の角度の尺度を代わりに用いてもよい。自明なことであるが、たとえば、角度θ自体をその余弦の代わりに使用することができる。別の代替案は、各ベクトルをその大きさによって正規化することであり、それによって、両方が単位半径の円弧上にあるようになる。弧上のこれらの2つの点の間のユークリッド距離(the Euclidean distance)は、ベクトル間の角度に以下のように関連する: In the above-described embodiment, the processing in step S2-6 calculates the cosine of the angle (first embodiment) or the absolute cosine (second embodiment) between each pair of corresponding region vectors. calculate. However, an angular scale other than cosine may be used instead. Obviously, for example, the angle θ itself can be used instead of its cosine. Another alternative is to normalize each vector by its magnitude so that both are on a unit radius arc. The Euclidean distance between these two points on the arc is related to the angle between the vectors as follows:
実際に、このような正規化ユークリッド距離Dは、正規化ベクトル距離に等しい。概して、ベクトル間の角度に関連する任意の関数形式を一実施形態において使用することができ、特に、直前に述べた例のように角度と単調な関係を維持するものを使用することができる。 In fact, such a normalized Euclidean distance D is equal to the normalized vector distance. In general, any functional form related to the angle between vectors can be used in one embodiment, and in particular, one that maintains a monotonic relationship with the angle as in the example just described.
ステップS2−8における比較を実行するために使用される余弦評価に対する変更として、比較を実行するために、領域内の導関数構造(derivative structure)の比較を実行する任意の処理を代わりに用いることができる。しかし、既に述べたように、比較が線形スケーリングに対して不変であることが有利である。このような不変比較方法は、正規化ベクトル距離、正規化相関、一次従属検出器、及びロンスキアン検出器を含み(しかしこれらに限定されない)、これらの全ては既に参照した「Neighbourhood Change Detection」と題する著作に記載されている。特性を統一することは、近傍コンテンツ及びスケーリング係数αから独立して、vrefとαvrefとの比較が同じ結果をもたらすということである。 As a change to the cosine evaluation used to perform the comparison in step S2-8, instead use any process that performs a comparison of the derivative structure in the region to perform the comparison. Can do. However, as already mentioned, it is advantageous that the comparison is invariant to linear scaling. Such invariant comparison methods include (but are not limited to) normalized vector distances, normalized correlations, first order dependent detectors, and Lonskian detectors, all of which are entitled “Neighbourhood Change Detection” already referenced. It is described in the work. Unifying the properties is that the comparison of vref and αvref yields the same result, independent of the neighboring content and the scaling factor α.
別の変更は、ステップS2−8における相関マップからノイズを除去するノイズフィルタリングに関する。上述した形態学的フィルタリングの他にまた(又はその代わりに)、各ブロブによって覆われているエリアに関する余弦距離尺度を計算することによって、検出されたブロブを有効にすることが可能である。このように代替のエリアにわたって比較を評価することは、変化を検査するための、場合によってはよりロバストな別の方法を提供する。これは、初期処理段階の固定された近傍の代わりに適応性がある近傍を使用する、第2のレベルの構造分析とみなすことができる。より詳細には、ステップS3−6a及びS3−6bが次の入力画像に関して後に実行されるときに領域を設定するために、変化を表す相関マップ内の領域が使用される。(上述した積分画像の実施態様を使用する場合)矩形ブロックの余弦尺度を評価することは労力がかからないため、たとえば検出された各ブロブのバウンディングボックス(the bounding box)のような矩形領域に対してこのような有効化を実行することは有利であろう。 Another change relates to noise filtering that removes noise from the correlation map in step S2-8. In addition to (or instead of) the morphological filtering described above, the detected blobs can be validated by calculating a cosine distance measure for the area covered by each blob. Evaluating the comparison across alternative areas in this way provides another possibly more robust method for examining changes. This can be viewed as a second level structural analysis that uses adaptive neighborhoods instead of fixed neighborhoods in the initial processing stage. More particularly, the region in the correlation map that represents the change is used to set the region when steps S3-6a and S3-6b are later performed on the next input image. Evaluating the cosine measure of a rectangular block (when using the integral image embodiment described above) is effortless, so for example for a rectangular region such as the bounding box of each detected blob It would be advantageous to perform such validation.
別の代替の実施形態では、(様々なサイズの領域がステップS3−6a及びS3−6bにおいて基準画像及び各入力画像に関して選択され、後に分析される)先の実施形態の多重スケールの実施態様は、多重解像度の実施態様で置き換えることができる。このような実施形態では、一定の解像度の画像からの異なるサイズの領域の選択の代わりに、入力画像及び基準画像は適切にダウンサンプリングされ、それによって、解像度が低減された画像の対に作用する一定サイズのウィンドウが、より大きいスケールの構造を比較する所望の機能を達成する。多重スケールとは対照的な多重解像度処理の1つの典型的な利点は、領域サイズが一定のままであり、代わりに画像サイズが縮小するため、計算量が、大きいほうの(すなわち、粗いほうの)スケールにおいて増加するのではなく低減するということである。特定の用途では、多重解像度システム、又は多重スケール手法及び多重解像度手法の両方のハイブリッドな組み合わせ(画像サイズ及びブロックサイズの両方が変更されて構造分析の所望のスケールが達成される)のいずれかを使用するさらなる利点が存在する。たとえば、勾配オペレータのサイズを、処理及び/又は近傍サイズのスケールに適合するようにすることができる。 In another alternative embodiment, the multi-scale implementation of the previous embodiment (regions of various sizes are selected for the reference image and each input image in steps S3-6a and S3-6b and later analyzed) Can be replaced with a multi-resolution embodiment. In such an embodiment, instead of selecting different sized regions from a constant resolution image, the input image and the reference image are appropriately downsampled, thereby acting on a reduced resolution image pair. A constant size window achieves the desired function of comparing larger scale structures. One typical advantage of multi-resolution processing as opposed to multi-scale is that the region size remains constant and instead the image size is reduced, so the computational complexity is larger (ie, the coarser ) To reduce rather than increase in scale. For specific applications, either a multi-resolution system or a hybrid combination of both multi-scale and multi-resolution techniques (both image size and block size are changed to achieve the desired scale for structural analysis) There are further advantages to use. For example, the size of the gradient operator can be adapted to the scale of the process and / or neighborhood size.
さらに別の変更は、シーンにおける変化の性質のさらなる洞察を得るための複数の基準画像の使用である。たとえば、入力画像は、まず「背景」基準フレームと比較され、次に最近の、記憶されている入力画像と比較されることができる。第1の比較は、背景とは異なる任意の領域のブロブをもたらし、一方、第2の比較は、短い時間スケールにわたって変化した、すなわち物体の動きに起因する領域のブロブをもたらす。このように、2つの出力を比較することによって、この手法は、(たとえば、物体の到着又は出発に起因する)静的な変化と動的な変化とを区別する。特定の用途に適するように、システムはその後、静的な変化を無視してそれらを基準背景モデルに吸収させるか、又は(窃盗若しくは物体の放棄のような)警報を引き起こすことができる。 Yet another change is the use of multiple reference images to gain further insight into the nature of changes in the scene. For example, the input image can be first compared to a “background” reference frame and then compared to the most recently stored input image. The first comparison results in a blob in any region that is different from the background, while the second comparison results in a blob in the region that has changed over a short time scale, ie, due to object motion. Thus, by comparing the two outputs, this approach distinguishes between static and dynamic changes (eg, due to object arrival or departure). To suit a particular application, the system can then ignore static changes and have them absorbed into the reference background model or trigger an alarm (such as theft or object abandonment).
上記の実施形態におけるステップS3−3における処理において、入力画像及び基準画像の両方における各画素の値は、第1の強度閾値を上回っているか又は第2の強度閾値を下回っているかを判断するために検査される。それぞれの閾値を上回っているか又は下回っている強度を有すると識別された各画素、及び他方の画像内の同じ位置における画素(その強度値は問わない)は、その後、後続の処理において無視されように処理される。しかし、代わりに、1つのみの画像(入力画像又は基準画像)内の各画素の値を検査することができ、結果的に上記の実施形態と比較して処理が低減される。この場合では、第1の閾値を上回るか又は第2の閾値を下回る強度を有する画素、及び他方の(検査されていない)画像内の同じ位置における画素は、全ての4つの勾配画像において勾配成分をゼロに設定することによって、後続の処理中、依然として無視されるであろう。 In the processing in step S3-3 in the above embodiment, in order to determine whether the value of each pixel in both the input image and the reference image is higher than the first intensity threshold or lower than the second intensity threshold. Inspected. Each pixel identified as having an intensity that is above or below the respective threshold, and a pixel at the same location in the other image (regardless of its intensity value) will then be ignored in subsequent processing. To be processed. However, instead, the value of each pixel in only one image (input image or reference image) can be examined, resulting in reduced processing compared to the above embodiment. In this case, pixels having intensities above the first threshold or below the second threshold, and pixels at the same position in the other (non-inspected) image are gradient components in all four gradient images. By setting to zero, it will still be ignored during subsequent processing.
ステップS3−5における処理では、結合勾配振幅値(第1の実施形態)又は結合勾配値(第2の実施形態)が、入力画像内の各画素に関して計算されるとともに基準画像内の各画素に関して計算され、その後、入力画像及び基準画像の両方における閾値を下回る結合値を有する画素が、後続の処理において無視されるように処理される。代替的に、入力画像又は基準画像のいずれかにおいても閾値を下回る結合値を有する任意の画素は、他方の画像内の同じ位置における画素(その結合値は問わない)と共に、後続の処理において無視されるように処理することができる。これは、入力画像の2つの勾配画像及び基準画像の2つの勾配画像において、絶対勾配値をゼロに設定することによって達成される(それによってこれらの画素は両方の画像において依然として無視される)。さらなる変更として、結合値を、計算して、画像のうちの一方のみにおける各画素の閾値と比較することができ、それによって処理要件が低減する。閾値を下回る結合値を有する各画素、及び他方の(検査されていない)画像内の対応する位置における画素は、その後、後続の処理において無視されるように処理される。 In the processing in step S3-5, a combined gradient amplitude value (first embodiment) or a combined gradient value (second embodiment) is calculated for each pixel in the input image and for each pixel in the reference image. Computed and then processed so that pixels with combined values below the threshold in both the input image and the reference image are ignored in subsequent processing. Alternatively, any pixel that has a combined value below the threshold in either the input image or the reference image is ignored in subsequent processing, along with the pixel at the same location in the other image (regardless of its combined value) Can be processed. This is achieved by setting the absolute gradient value to zero in the two gradient images of the input image and the two gradient images of the reference image (so that these pixels are still ignored in both images). As a further modification, the combined value can be calculated and compared to the threshold value of each pixel in only one of the images, thereby reducing processing requirements. Each pixel that has a combined value below the threshold, and the pixel at the corresponding position in the other (untested) image is then processed to be ignored in subsequent processing.
上述したように、ステップS3−3及びS3−5における処理は任意選択である。この処理を省く実施形態では、ステップS3−2a〜S3−12aにおける基準画像データに対する処理は1回だけ実行することができ、結果が記憶され、それによって処理は新しい入力画像が処理されるごとに実行される必要はない。したがって、この場合では、ステップS3−2a〜S3−12aにおける基準画像に対する処理は、何らかの入力画像データが受信される前に「オフライン」で非リアルタイムに実行することができる。 As described above, the processing in steps S3-3 and S3-5 is optional. In an embodiment that omits this processing, the processing on the reference image data in steps S3-2a to S3-12a can be performed only once, and the result is stored so that the processing is performed each time a new input image is processed. There is no need to be executed. Therefore, in this case, the process for the reference image in steps S3-2a to S3-12a can be performed "offline" and in non-real time before any input image data is received.
導入部において述べたように、変化検出はコンピュータビジョンにおける基本的機能である。本発明の実施形態は、変化検出が必要とされるあらゆる分野において適用することができ、ロバスト性rが勾配成分の(概ね)線形のスケーリングをもたらす要素に対して望まれる場合、(背景差分のような)より単純な方法よりも優れる場合が多いであろう。これらは、たとえば、標準画像における変化する照度、コントラスト、輝度、若しくは適応利得制御、又は赤外画像における温度変化を含むことができる。 As mentioned in the introduction, change detection is a fundamental function in computer vision. Embodiments of the present invention can be applied in any field where change detection is required, and if robustness r is desired for an element that provides a (substantially) linear scaling of the gradient components (background difference It is often better than simpler methods). These can include, for example, changing illumination, contrast, brightness, or adaptive gain control in a standard image, or temperature changes in an infrared image.
上記の実施形態は照明のような効果を考慮に入れずに検出変化に関して説明されたが、同じ技法を静的なシーンにおける照度変化の検出に適用することが可能であろう。たとえば、上記のロバストな変化検出処理の出力は、背景差分のようなロバストでない変化検出技法と組み合わせることができる。したがって、後者の技法によって強調されるが、ロバスト比較をパスする変化は、照度変化の証拠とみなすことができる。 Although the above embodiments have been described in terms of detection changes without taking into account effects such as lighting, the same technique could be applied to detecting illumination changes in static scenes. For example, the output of the robust change detection process described above can be combined with non-robust change detection techniques such as background differences. Thus, although emphasized by the latter technique, changes that pass the robust comparison can be considered evidence of illumination changes.
上述の実施形態では、処理は、コンピュータプログラム命令によって規定される処理ルーチンを使用するプログラム可能なコンピュータ処理装置によって実行される。しかし、幾つかの又は全ての処理は、代わりにハードウェアを使用して実行することができる。 In the embodiments described above, the processing is performed by a programmable computer processing device that uses processing routines defined by computer program instructions. However, some or all of the processing can be performed using hardware instead.
当然のことながら、他の変更が可能である。 Of course, other changes are possible.
Claims (62)
前記第1の画像の画像データを処理することであって、該第1の画像内の異なる複数の画素位置において前記画像データの均一性の空間変化率を表すデータを生成する、処理すること、
前記第2の画像の画像データを処理することであって、該第2の画像内の異なる複数の画素位置において前記画像データの均一性の空間変化率を表すデータを生成する、処理すること、
前記第1の画像内の異なる複数の画素位置に関して生成される前記空間変化率データを結合することであって、前記第1の画像内の複数の画素の代表値を生成する、結合すること、
前記第2の画像内の異なる複数の画素位置に関して生成される前記空間変化率データを結合することであって、前記第2の画像内の複数の画素の代表値を生成する、結合すること、及び
前記第1の画像の前記代表値と前記第2の画像の前記代表値とを比較することであって、前記画像間の差異を確認する、比較すること、
を含む、方法。 A method of processing image data defining the first image and the second image to detect changes in the first image and the second image, comprising:
Processing image data of the first image, generating data representing a spatial change rate of uniformity of the image data at a plurality of different pixel positions in the first image;
Processing image data of the second image, generating data representing a spatial change rate of uniformity of the image data at a plurality of different pixel positions in the second image;
Combining the spatial change rate data generated for different pixel positions in the first image, generating representative values for the plurality of pixels in the first image,
Combining the spatial change rate data generated for different pixel positions in the second image, generating representative values for the plurality of pixels in the second image, And comparing the representative value of the first image with the representative value of the second image, checking a difference between the images, comparing
Including a method.
前記代表値間の相関を表す相関値を計算すること、及び
前記相関値を閾値と比較すること、
を含む、請求項1〜5のいずれか一項に記載の方法。 The process of comparing the representative values is:
Calculating a correlation value representing a correlation between the representative values; and comparing the correlation value with a threshold value;
The method according to claim 1, comprising:
前記第2の画像内の異なる複数の画素位置の前記空間変化率データが結合されて、前記第2の画像内の異なるサイズの複数の領域のそれぞれの各代表値が生成され、前記第2の画像内の前記領域は前記第1の画像内の前記領域と同じサイズを有し、
前記代表値を比較する処理は、前記第1の画像及び前記第2の画像からの同じサイズの領域の前記代表値を比較することを含む、請求項1〜6のいずれか一項に記載の方法。 The spatial change rate data of a plurality of different pixel positions in the first image are combined to generate respective representative values for a plurality of regions of different sizes in the first image,
The spatial change rate data of a plurality of different pixel positions in the second image are combined to generate respective representative values of a plurality of regions of different sizes in the second image, The region in the image has the same size as the region in the first image;
The process of comparing the representative values includes comparing the representative values of regions of the same size from the first image and the second image. Method.
前記第2の画像内の異なる複数の画素位置の前記空間変化率データが結合されて、前記第2の画像内の異なる位置における複数の領域のそれぞれの各代表値が生成され、前記第2の画像内の前記領域の前記位置は前記第1の画像内の前記領域の前記位置と同じであり、
前記代表値を比較する処理は、前記第1の画像及び前記第2の画像内の同じ位置における領域の前記代表値を比較することを含む、請求項1〜7のいずれか一項に記載の方法。 The spatial change rate data of different pixel positions in the first image are combined to generate respective representative values for a plurality of regions at different positions in the first image,
The spatial change rate data at different pixel positions in the second image are combined to generate respective representative values for a plurality of regions at different positions in the second image, and The position of the region in the image is the same as the position of the region in the first image;
The process of comparing the representative values includes comparing the representative values of regions in the same position in the first image and the second image. Method.
前記第2の画像の前記空間変化率データが結合されて、該第2の画像の全体の代表値が生成され、
前記第1の画像の全体の前記代表値と前記第2の画像の全体の前記代表値とが比較されて、前記画像間の差異が確認される、請求項1〜6のいずれか一項に記載の方法。 The spatial change rate data of the first image is combined to generate an overall representative value for the first image;
The spatial change rate data of the second image is combined to generate an overall representative value for the second image;
The representative value of the whole of the first image and the representative value of the whole of the second image are compared to confirm a difference between the images. The method described.
前記第1の画像内の前記識別された画素及び前記第2の画像内の同じ位置を有する画素は、前記比較処理中、考慮に入れられない、請求項1〜11のいずれか一項に記載の方法。 The method further comprises identifying pixels in the first image that have a value that is above a first pixel value threshold or below a second pixel value threshold;
12. The identified pixel in the first image and a pixel having the same position in the second image are not taken into account during the comparison process. the method of.
前記第2の画像内の前記識別された画素及び前記第1の画像内の同じ位置を有する画素は、前記比較処理中、考慮に入れられない、請求項12に記載の方法。 The method further includes identifying a pixel in the second image that has a value that is above the first pixel value threshold or below the second pixel value threshold;
13. The method of claim 12, wherein the identified pixel in the second image and a pixel having the same position in the first image are not taken into account during the comparison process.
前記第2の画像の前記画像データの前記均一性の空間変化率を表すデータを生成する処理は、前記第2の画像データを処理することであって、複数の異なる方向における前記第2の画像データの前記均一性の空間変化率を規定するデータを生成する、処理することを含み、前記方向は前記第1の画像の前記画像データ及び前記第2の画像の前記画像データに関して同じである、請求項1〜14のいずれか一項に記載の方法。 The process of generating data representing the uniformity spatial change rate of the image data of the first image is to process the first image data, and the first image in a plurality of different directions. Generating and processing data defining a spatial change rate of said uniformity of data;
The process of generating data representing the spatial change rate of the uniformity of the image data of the second image is to process the second image data, and the second image in a plurality of different directions Generating and processing data defining a spatial change rate of the uniformity of the data, wherein the direction is the same for the image data of the first image and the image data of the second image; 15. A method according to any one of claims 1-14.
前記第1の画像において前記異なる方向に関して生成される前記空間変化率データにおいて、同じ位置における画素の前記空間変化率データを結合することであって、画素の各対のそれぞれの結合値を生成する、結合すること、及び
各前記結合値を検査することであって、該各結合値が結合値閾値を下回るか否かを判断する、検査すること、
をさらに含み、
前記結合値が前記結合値閾値を下回る画素と、前記第2の画像内の同じ位置を有する画素とは、前記比較処理中、考慮に入れられない、請求項15に記載の方法。 The method
In the spatial rate of change data generated for the different directions in the first image, combining the spatial rate of change data for pixels at the same position, generating a respective combined value for each pair of pixels. Combining and testing each said combined value to determine whether each said combined value is below a combined value threshold;
Further including
16. The method of claim 15, wherein pixels whose combined value is below the combined value threshold and pixels having the same position in the second image are not taken into account during the comparison process.
前記第2の画像において前記異なる方向に関して生成される前記空間変化率データにおいて、同じ位置における画素の前記空間変化率データを結合することであって、画素の各対のそれぞれの結合値を生成する、結合すること、及び
各前記結合値を検査することであって、該各結合値が前記結合値閾値を下回るか否かを判断する、検査すること、
をさらに含み、
前記結合値が前記結合値閾値を下回る画素と、前記第1の画像内の同じ位置を有する画素とは、前記比較処理中、考慮に入れられない、請求項16に記載の方法。 The method
In the spatial rate of change data generated for the different directions in the second image, combining the spatial rate of change data for pixels at the same position, and generating a respective combined value for each pair of pixels. Combining, and testing each of the combined values to determine whether each combined value is below the combined value threshold;
Further including
The method of claim 16, wherein pixels whose combined value is below the combined value threshold and pixels having the same position in the first image are not taken into account during the comparison process.
前記第1の画像において前記異なる方向に関して生成される前記空間変化率データにおいて、同じ位置における画素の前記空間変化率データを結合することであって、画素の各対のそれぞれの結合値を生成する、結合すること、
前記第2の画像において前記異なる方向に関して生成される前記空間変化率データにおいて、同じ位置における画素の前記空間変化率データを結合することであって、画素の各対のそれぞれの結合値を生成する、結合すること、及び
各前記結合値を検査することであって、該各結合値が結合値閾値を下回るか否かを判断する、検査すること、
をさらに含み、
前記第1の画像及び前記第2の画像の両方の、前記結合値が前記結合値閾値を下回る画素は、前記比較処理中、考慮に入れられない、請求項15に記載の方法。 The method
In the spatial rate of change data generated for the different directions in the first image, combining the spatial rate of change data for pixels at the same position, generating a respective combined value for each pair of pixels. Joining,
In the spatial rate of change data generated for the different directions in the second image, combining the spatial rate of change data for pixels at the same position, and generating a respective combined value for each pair of pixels. Combining and testing each said combined value to determine whether each said combined value is below a combined value threshold;
Further including
The method of claim 15, wherein pixels of both the first image and the second image for which the combined value is below the combined value threshold are not taken into account during the comparison process.
前記符号無しの値が結合されて、前記代表値のそれぞれが生成される、請求項1〜20のいずれか一項に記載の方法。 The method further includes calculating an unsigned value of the spatial change rate data for each pixel in the first image and the second image;
21. A method as claimed in any preceding claim, wherein the unsigned values are combined to generate each of the representative values.
前記第1の画像の前記代表値と前記第2の画像の前記代表値とを比較する処理は、
前記第1の画像のベクトルと前記第2の画像のベクトルとの符号無しの積を計算すること、及び
前記符号無しの積に従って符号無しの相関値を生成すること、
を含む、請求項22に記載の方法。 The process of combining the spatial change rate data of each of the first image and the second image includes connecting the data at different pixel positions in the image to form a vector;
The process of comparing the representative value of the first image with the representative value of the second image includes:
Calculating an unsigned product of the vector of the first image and the vector of the second image, and generating an unsigned correlation value according to the unsigned product;
23. The method of claim 22, comprising:
前記代表値を比較する処理は、前記ベクトル間の角度の尺度を求めることを含む、請求項24に記載の方法。 The process of combining the spatial change rate data of each of the first image and the second image includes connecting the data at different pixel positions in the image to form a vector;
The method of claim 24, wherein the process of comparing the representative values includes determining a measure of the angle between the vectors.
前記第1の画像内の前記複数の画素内の異なる複数の画素位置の前記空間変化率データを重み付けすること、及び
前記第2の画像内の前記複数の画素内の異なる複数の画素位置の前記空間変化率データを重み付けすること、
をさらに含み、
前記第1の画像の前記代表値及び前記第2の画像の前記代表値は、前記重み付けされた空間変化率データ値を含む、請求項1〜26のいずれか一項に記載の方法。 The method
Weighting the spatial change rate data at different pixel positions in the plurality of pixels in the first image, and the different pixel positions in the plurality of pixels in the second image. Weighting the spatial rate of change data,
Further including
27. A method according to any one of the preceding claims, wherein the representative value of the first image and the representative value of the second image comprise the weighted spatial change rate data value.
前記空間変化率を計算する処理、前記空間変化率データを結合する処理、及び前記代表値を比較する処理は、各解像度において前記第1の画像及び前記第2の画像に関して実行される、請求項1〜6のいずれか一項に記載の方法。 The method further includes processing each of the first image and the second image, generating a plurality of images of different resolutions, respectively.
The process of calculating the spatial change rate, the process of combining the spatial change rate data, and the process of comparing the representative values are performed on the first image and the second image at each resolution. The method as described in any one of 1-6.
少なくとも1つのさらなる画像の画像データを処理することであって、各該さらなる画像内の異なる複数の画素位置において前記画像データの前記均一性の空間変化率を表すデータを生成する、処理すること、及び
各前記さらなる画像の前記空間変化率データと、前記第1の画像の前記空間変化率データとを合成することであって、合成された変化率データを生成する、合成すること、
をさらに含み、
前記第1の画像内の異なる複数の画素位置の前記空間変化率データを結合する処理は、異なる複数の画素位置の前記合成された空間変化率データを結合することを含む、請求項1〜28のいずれか一項に記載の方法。 The method
Processing image data of at least one further image, generating data representing a spatial rate of change of the uniformity of the image data at different pixel locations within each further image; And combining the spatial change rate data of each of the further images and the spatial change rate data of the first image, and generating the combined change rate data,
Further including
29. The process of combining the spatial change rate data of different pixel positions in the first image includes combining the combined spatial change rate data of different pixel positions. The method as described in any one of.
空間変化率計算手段であって、
前記第1の画像の画像データを処理して、該第1の画像内の異なる複数の画素位置において前記画像データの均一性の空間変化率を表すデータを生成すると共に、
前記第2の画像の画像データを処理して、該第2の画像内の異なる複数の画素位置において前記画像データの均一性の空間変化率を表すデータを生成する
ように動作可能な空間変化率計算手段と、
結合手段であって、
前記第1の画像内の異なる複数の画素位置に関して生成される前記空間変化率データを結合して、前記第1の画像内の複数の画素の代表値を生成すると共に
前記第2の画像内の異なる複数の画素位置に関して生成される前記空間変化率データを結合して、前記第2の画像内の複数の画素の代表値を生成する
ように動作可能な結合手段と、
前記第1の画像の前記代表値と前記第2の画像の前記代表値とを比較して、前記画像間の差異を確認するように動作可能な比較手段と、
を備える、装置。 An apparatus for processing image data defining the first image and the second image in order to detect changes in the first image and the second image,
Spatial change rate calculation means,
Processing image data of the first image to generate data representing a spatial change rate of uniformity of the image data at a plurality of different pixel positions in the first image;
A spatial rate of change operable to process the image data of the second image and generate data representing a spatial rate of change of uniformity of the image data at a plurality of different pixel positions in the second image. Calculation means;
A coupling means,
Combining the spatial change rate data generated for different pixel locations in the first image to generate representative values for the plurality of pixels in the first image and in the second image; Combining means operable to combine the spatial rate-of-change data generated for different pixel positions to generate representative values for a plurality of pixels in the second image;
Comparing means operable to compare the representative value of the first image with the representative value of the second image to confirm a difference between the images;
An apparatus comprising:
前記代表値間の相関を表す相関値を計算するように動作可能な相関値計算手段と、
前記相関値を閾値と比較する手段と、
を含む、請求項31〜35のいずれか一項に記載の装置。 The comparison means includes
Correlation value calculating means operable to calculate a correlation value representing a correlation between the representative values;
Means for comparing the correlation value with a threshold;
36. The apparatus according to any one of claims 31 to 35, comprising:
前記第1の画像内の異なる複数の画素位置の前記空間変化率データを結合して、前記第1の画像内の異なる複数のサイズの領域のそれぞれの各代表値を生成すると共に
前記第2の画像内の異なる複数の画素位置の前記空間変化率データを結合して、前記第2の画像内の異なる複数のサイズの領域のそれぞれの各代表値を生成するように動作可能であり、前記第2の画像内の前記領域は前記第1の画像内の前記領域と同じサイズを有し、
前記比較手段は、前記第1の画像及び前記第2の画像からの同じサイズの領域の前記代表値を比較するように構成される、請求項31〜35のいずれか一項に記載の装置。 The coupling means includes
Combining the spatial change rate data of different pixel positions in the first image to generate respective representative values of regions of different sizes in the first image and the second Operable to combine the spatial change rate data at different pixel positions in the image to generate respective representative values for each of the different sized regions in the second image; The region in the second image has the same size as the region in the first image;
36. Apparatus according to any one of claims 31 to 35, wherein the comparison means is configured to compare the representative values of regions of the same size from the first image and the second image.
前記第1の画像内の異なる複数の画素位置の前記空間変化率データを結合して、前記第1の画像内の異なる位置における複数の領域のそれぞれの各代表値を生成すると共に
前記第2の画像内の異なる複数の画素位置の前記空間変化率データを結合して、前記第2の画像内の異なる位置における複数の領域のそれぞれの各代表値を生成するように動作可能であり、前記第2の画像内の前記領域の前記位置は前記第1の画像内の前記領域の前記位置と同じであり、
前記比較手段は、前記第1の画像及び前記第2の画像内の同じ位置における領域の前記代表値を比較するように構成される、請求項31〜37のいずれか一項に記載の装置。 The coupling means includes
Combining the spatial change rate data of a plurality of different pixel positions in the first image to generate respective representative values of a plurality of regions at different positions in the first image, and the second Operable to combine the spatial change rate data at different pixel positions in the image to generate respective representative values for each of the plurality of regions at different positions in the second image; The position of the region in the second image is the same as the position of the region in the first image;
38. The apparatus according to any one of claims 31 to 37, wherein the comparison means is configured to compare the representative values of regions at the same position in the first image and the second image.
前記第1の画像の前記空間変化率データを結合して、該第1の画像の全体の代表値を生成すると共に
前記第2の画像の前記空間変化率データを結合して、該第2の画像の全体の代表値を生成するように動作可能であり、
前記比較手段は、前記第1の画像の全体の前記代表値と前記第2の画像の全体の前記代表値とを比較して、前記画像間の差異を確認するように動作可能である、請求項31〜36のいずれか一項に記載の装置。 The space change rate calculation means includes:
Combining the spatial change rate data of the first image to generate an overall representative value of the first image and combining the spatial change rate data of the second image, Operable to generate a representative value for the entire image,
The comparison means is operable to compare the representative value of the whole of the first image with the representative value of the whole of the second image to confirm a difference between the images. Item 37. The apparatus according to any one of Items 31 to 36.
前記比較手段は、前記第1の画像内の前記識別された画素及び前記第2の画像内の同じ位置を有する画素を考慮に入れない比較処理を実行するように構成される、請求項31〜41のいずれか一項に記載の装置。 The apparatus further comprises pixel identification means operable to identify pixels in the first image that have a value above a first pixel value threshold or below a second pixel value threshold;
32. The comparison means is configured to perform a comparison process that does not take into account the identified pixels in the first image and pixels having the same position in the second image. 41. The apparatus according to any one of 41.
前記比較手段は、前記第2の画像内の前記識別された画素及び前記第1の画像内の同じ位置を有する画素を考慮に入れない比較処理を実行するように構成される、請求項42に記載の装置。 The pixel identification means is operable to identify pixels in the second image that have a value that is above the first pixel value threshold or below the second pixel value threshold;
The comparison means is configured to perform a comparison process that does not take into account the identified pixels in the second image and pixels having the same position in the first image. The device described.
前記第1の画像データを処理して、複数の異なる方向における該第1の画像データの前記均一性の空間変化率を規定するデータを生成すると共に
前記第2の画像データを処理して、複数の異なる方向における該第2の画像データの前記均一性の空間変化率を規定するデータを生成するように動作可能であり、前記方向は前記第1の画像の前記画像データ及び前記第2の画像の前記画像データに関して同じである、請求項31〜44のいずれか一項に記載の装置。 The space change rate calculation means includes:
Processing the first image data to generate data defining a spatial change rate of the uniformity of the first image data in a plurality of different directions; and processing the second image data to generate a plurality of Are operable to generate data defining a spatial change rate of the uniformity of the second image data in different directions, wherein the direction is the image data of the first image and the second image. 45. Apparatus according to any one of claims 31 to 44, which is the same with respect to the image data.
前記第1の画像において前記異なる方向に関して生成される前記空間変化率データにおいて、同じ位置における画素の前記空間変化率データを結合して、画素の各対のそれぞれの結合値を生成するように動作可能な結合値生成手段と、
各前記結合値を検査して、該各結合値が結合値閾値を下回るか否かを判断するように動作可能な結合値検査手段と、
をさらに備え、
前記比較手段は、前記結合値が前記結合値閾値を下回る画素と、前記第2の画像内の同じ位置を有する画素とを考慮に入れない比較処理を実行するように構成される、請求項45に記載の装置。 The device is
In the spatial change rate data generated for the different directions in the first image, the spatial change rate data of pixels at the same position are combined to generate a respective combined value of each pair of pixels Possible combined value generation means;
A combined value checking means operable to inspect each of the combined values to determine whether each of the combined values is below a combined value threshold;
Further comprising
46. The comparison means is configured to perform a comparison process that does not take into account pixels whose combined value is below the combined value threshold and pixels having the same position in the second image. The device described in 1.
前記結合値検査手段は、前記第2の画像の各前記結合値を検査して、該各結合値が前記結合値閾値を下回るか否かを判断するように動作可能であり、
前記比較手段は、前記結合値が前記結合値閾値を下回る画素と、前記第1の画像内の同じ位置を有する画素とを考慮に入れない比較処理を実行するように構成される、請求項46に記載の装置。 The combined value generation means combines the spatial change rate data of pixels at the same position in the spatial change rate data generated with respect to the different directions in the second image, and combines each pair of pixels. Is operable to generate a value,
The combined value inspection means is operable to inspect each combined value of the second image to determine whether each combined value is below the combined value threshold;
47. The comparison means is configured to perform a comparison process that does not take into account pixels whose combined value is below the combined value threshold and pixels having the same position in the first image. The device described in 1.
結合値生成手段であって、
前記第1の画像において前記異なる方向に関して生成される前記空間変化率データにおいて、同じ位置における画素の前記空間変化率データを結合して、画素の各対のそれぞれの結合値を生成すると共に
前記第2の画像において前記異なる方向に関して生成される前記空間変化率データにおいて、同じ位置における画素の前記空間変化率データを結合して、画素の各対のそれぞれの結合値を生成する
ように動作可能である、結合値生成手段と、
各前記結合値を検査して、該各結合値が結合値閾値を下回るか否かを判断するように動作可能である結合値検査手段と、
をさらに備え、
前記比較手段は、前記第1の画像及び前記第2の画像の両方の、前記結合値が前記結合値閾値を下回る画素を考慮に入れない比較処理を実行するように構成される、請求項45に記載の装置。 The device is
A combined value generating means,
In the spatial change rate data generated for the different directions in the first image, the spatial change rate data of pixels at the same position are combined to generate respective combined values for each pair of pixels, and In the spatial change rate data generated for the different directions in two images, operable to combine the spatial change rate data for pixels at the same position to generate a respective combined value for each pair of pixels. A certain combined value generation means;
A combined value checking means operable to inspect each said combined value to determine whether each said combined value is below a combined value threshold;
Further comprising
46. The comparison means is configured to perform a comparison process of both the first image and the second image that does not take into account pixels whose combined value is below the combined value threshold. The device described in 1.
前記結合手段は、前記符号無しの値を結合して、前記代表値のそれぞれを生成するように構成される、請求項31〜50のいずれか一項に記載の装置。 The apparatus further comprises means for calculating an unsigned value of the spatial change rate data for each pixel in the first image and the second image,
51. The apparatus according to any one of claims 31 to 50, wherein the combining means is configured to combine the unsigned values to generate each of the representative values.
前記比較手段は、
前記第1の画像のベクトルと前記第2の画像のベクトルとの符号無しの積を計算すること、及び
前記符号無しの積に従って符号無しの相関値を生成すること、
によって、前記第1の画像の前記代表値と前記第2の画像の前記代表値とを比較するように動作可能である、請求項52に記載の装置。 The combining unit combines the spatial change rate data of each of the first image and the second image by connecting the data of a plurality of different pixel positions in the image to form a vector. Is operable and
The comparison means includes
Calculating an unsigned product of the vector of the first image and the vector of the second image, and generating an unsigned correlation value according to the unsigned product;
53. The apparatus of claim 52, wherein the apparatus is operable to compare the representative value of the first image with the representative value of the second image.
前記比較手段は、前記ベクトル間の角度の尺度を求めることによって前記代表値を比較するように動作可能である、請求項54に記載の装置。 The combining unit combines the spatial change rate data of each of the first image and the second image by connecting the data of a plurality of different pixel positions in the image to form a vector. Is operable and
55. The apparatus of claim 54, wherein the comparison means is operable to compare the representative values by determining a measure of the angle between the vectors.
重み付け手段であって、
前記第1の画像内の前記複数の画素内の異なる複数の画素位置の前記空間変化率データを重み付けすると共に
前記第2の画像内の前記複数の画素内の異なる複数の画素位置の前記空間変化率データを重み付けする
ように動作可能である、重み付け手段をさらに備え、
前記結合手段は、前記重み付けされた空間変化率データ値を結合して、前記第1の画像の前記代表値及び前記第2の画像の前記代表値を生成するように動作可能である、請求項31〜56のいずれか一項に記載の装置。 The device is
A weighting means,
Weighting the spatial change rate data at different pixel positions in the plurality of pixels in the first image and the spatial change of different pixel positions in the plurality of pixels in the second image Further comprising weighting means operable to weight the rate data;
The combination means is operable to combine the weighted spatial change rate data values to generate the representative value of the first image and the representative value of the second image. The apparatus according to any one of 31 to 56.
前記空間変化率計算手段、前記結合手段、及び前記比較手段は、各解像度における前記第1の画像及び前記第2の画像を処理するように動作可能である、請求項31〜36のいずれか一項に記載の装置。 The apparatus further includes means for processing each of the first image and the second image, and generating and processing a plurality of images of different resolutions,
37. The space change rate calculating means, the combining means, and the comparing means are operable to process the first image and the second image at each resolution. The device according to item.
前記装置は、各前記さらなる画像の前記空間変化率データと、前記第1の画像の前記空間変化率データとを合成して、合成された変化率データを生成するように動作可能な合成手段をさらに備え、
前記結合手段は、異なる複数の画素位置の前記合成された空間変化率データを結合することによって前記第1の画像内の異なる複数の画素位置の前記空間変化率データを結合するように動作可能である、請求項31〜58のいずれか一項に記載の装置。 The spatial change rate calculation means processes the image data of at least one further image to generate data representing the spatial change rate of the uniformity of the image data at different pixel positions within each further image. Is operable and
The apparatus comprises combining means operable to combine the spatial change rate data of each further image and the spatial change rate data of the first image to generate combined change rate data. In addition,
The combining means is operable to combine the spatial change rate data of different pixel positions in the first image by combining the combined spatial change rate data of different pixel positions. 59. Apparatus according to any one of claims 31 to 58, wherein:
Applications Claiming Priority (2)
| Application Number | Priority Date | Filing Date | Title |
|---|---|---|---|
| EP06014801A EP1881454A1 (en) | 2006-07-17 | 2006-07-17 | Image processing for change detection |
| PCT/EP2007/057326 WO2008009656A1 (en) | 2006-07-17 | 2007-07-16 | Image processing for change detection |
Publications (1)
| Publication Number | Publication Date |
|---|---|
| JP2009544090A true JP2009544090A (en) | 2009-12-10 |
Family
ID=37690937
Family Applications (1)
| Application Number | Title | Priority Date | Filing Date |
|---|---|---|---|
| JP2009519969A Withdrawn JP2009544090A (en) | 2006-07-17 | 2007-07-16 | Image processing for change detection |
Country Status (4)
| Country | Link |
|---|---|
| US (1) | US20110293190A1 (en) |
| EP (1) | EP1881454A1 (en) |
| JP (1) | JP2009544090A (en) |
| WO (1) | WO2008009656A1 (en) |
Cited By (1)
| Publication number | Priority date | Publication date | Assignee | Title |
|---|---|---|---|---|
| JP2015534165A (en) * | 2012-09-11 | 2015-11-26 | クゥアルコム・インコーポレイテッドQualcomm Incorporated | Devices and methods for augmented reality applications |
Families Citing this family (29)
| Publication number | Priority date | Publication date | Assignee | Title |
|---|---|---|---|---|
| WO2009004996A1 (en) * | 2007-06-29 | 2009-01-08 | Nec Corporation | Screen transmission system, screen transmission server, screen transmission method, and program recording medium |
| KR101522985B1 (en) * | 2008-10-31 | 2015-05-27 | 삼성전자주식회사 | Apparatus and Method for Image Processing |
| US8553940B2 (en) * | 2009-10-06 | 2013-10-08 | Koninklijke Philips N.V. | Formation of a time-varying signal representative of at least variations in a value based on pixel values |
| US8428371B2 (en) | 2010-09-07 | 2013-04-23 | Hewlett-Packard Development Company, L.P. | Method and system to determine whether an image includes spatial adjustments |
| CN102024261B (en) * | 2010-12-29 | 2013-03-27 | 新奥特(北京)视频技术有限公司 | Method for calculating marginal information in noise image |
| CN103503028B (en) * | 2011-05-04 | 2017-03-15 | 斯泰克欧洲控股一有限责任公司 | The system and method for carrying out automatic detection and test to the clinical correlation of image |
| AR086256A1 (en) | 2011-05-06 | 2013-11-27 | Sanofi Aventis Deutschland | DRIVE SET FOR A DRUG ADMINISTRATION DEVICE AND CORRESPONDING DRUG ADMINISTRATION DEVICE |
| US9552648B1 (en) * | 2012-01-23 | 2017-01-24 | Hrl Laboratories, Llc | Object tracking with integrated motion-based object detection (MogS) and enhanced kalman-type filtering |
| US10743773B2 (en) * | 2012-05-02 | 2020-08-18 | Koninklijke Philips N.V. | Imaging thermometry |
| US20150297142A1 (en) * | 2012-07-30 | 2015-10-22 | Koninklijke Philips N.V. | Device and method for extracting physiological information |
| US9911036B2 (en) * | 2012-11-14 | 2018-03-06 | Tascent, Inc. | Focusing method for optically capturing an iris image |
| US9349055B1 (en) * | 2013-06-26 | 2016-05-24 | Google Inc. | Real-time image-based vehicle detection based on a multi-stage classification |
| US9213901B2 (en) | 2013-09-04 | 2015-12-15 | Xerox Corporation | Robust and computationally efficient video-based object tracking in regularized motion environments |
| US9251416B2 (en) | 2013-11-19 | 2016-02-02 | Xerox Corporation | Time scale adaptive motion detection |
| US9323991B2 (en) | 2013-11-26 | 2016-04-26 | Xerox Corporation | Method and system for video-based vehicle tracking adaptable to traffic conditions |
| US9335766B1 (en) | 2013-12-06 | 2016-05-10 | Google Inc. | Static obstacle detection |
| US9286707B1 (en) * | 2014-01-27 | 2016-03-15 | Google Inc. | Removing transient objects to synthesize an unobstructed image |
| US9245187B1 (en) * | 2014-07-07 | 2016-01-26 | Geo Semiconductor Inc. | System and method for robust motion detection |
| US9866734B2 (en) | 2014-08-26 | 2018-01-09 | Dolby Laboratories Licensing Corporation | Scene-change detection using video stream pairs |
| CN105046241B (en) * | 2015-08-19 | 2018-04-17 | 西安电子科技大学 | Target level method for detecting change of remote sensing image based on RBM models |
| US11217344B2 (en) * | 2017-06-23 | 2022-01-04 | Abiomed, Inc. | Systems and methods for capturing data from a medical device |
| JP6901386B2 (en) * | 2017-12-08 | 2021-07-14 | 株式会社東芝 | Gradient Estimator, Gradient Estimator, Program and Control System |
| CN108492298B (en) * | 2018-04-13 | 2021-11-09 | 西安电子科技大学 | Multispectral image change detection method based on generation countermeasure network |
| CN113763456B (en) * | 2020-06-01 | 2024-11-19 | 聚晶半导体股份有限公司 | Image detection device and image detection method |
| US11301702B2 (en) * | 2020-06-17 | 2022-04-12 | Fotonation Limited | Object detection for event cameras |
| US11270137B2 (en) | 2020-06-17 | 2022-03-08 | Fotonation Limited | Event detector and method of generating textural image based on event count decay factor and net polarity |
| US11164019B1 (en) * | 2020-06-17 | 2021-11-02 | Fotonation Limited | Object detection for event cameras |
| CN113591933B (en) * | 2021-07-07 | 2024-04-09 | 中国人民解放军海军航空大学 | A remote sensing image change detection method and system based on correlation measurement |
| CN115294003B (en) * | 2022-08-09 | 2025-12-19 | 西安欧亚学院 | Multi-focus image fusion method |
Family Cites Families (1)
| Publication number | Priority date | Publication date | Assignee | Title |
|---|---|---|---|---|
| US7706633B2 (en) * | 2004-04-21 | 2010-04-27 | Siemens Corporation | GPU-based image manipulation method for registration applications |
-
2006
- 2006-07-17 EP EP06014801A patent/EP1881454A1/en not_active Withdrawn
-
2007
- 2007-07-16 JP JP2009519969A patent/JP2009544090A/en not_active Withdrawn
- 2007-07-16 US US12/374,192 patent/US20110293190A1/en not_active Abandoned
- 2007-07-16 WO PCT/EP2007/057326 patent/WO2008009656A1/en not_active Ceased
Cited By (2)
| Publication number | Priority date | Publication date | Assignee | Title |
|---|---|---|---|---|
| JP2015534165A (en) * | 2012-09-11 | 2015-11-26 | クゥアルコム・インコーポレイテッドQualcomm Incorporated | Devices and methods for augmented reality applications |
| US10038892B2 (en) | 2012-09-11 | 2018-07-31 | Qualcomm Incorporated | Device and method for augmented reality applications |
Also Published As
| Publication number | Publication date |
|---|---|
| WO2008009656A1 (en) | 2008-01-24 |
| EP1881454A1 (en) | 2008-01-23 |
| US20110293190A1 (en) | 2011-12-01 |
Similar Documents
| Publication | Publication Date | Title |
|---|---|---|
| JP2009544090A (en) | Image processing for change detection | |
| Nandal et al. | Image edge detection using fractional calculus with feature and contrast enhancement | |
| Javed et al. | Vibration measurement of a rotating cylindrical structure using subpixel-based edge detection and edge tracking | |
| Abid Hasan et al. | Depth edge detection by image-based smoothing and morphological operations | |
| EP3438929B1 (en) | Foreground and background detection method | |
| CN111368771A (en) | A kind of tunnel fire warning method, device, computer equipment and computer-readable storage medium based on image processing | |
| JP2010532898A (en) | Visual background extractor | |
| Shang et al. | Infrared small target detection via line-based reconstruction and entropy-induced suppression | |
| KR101799143B1 (en) | System and method for estimating target size | |
| US20140376822A1 (en) | Method for Computing the Similarity of Image Sequences | |
| US20190251695A1 (en) | Foreground and background detection method | |
| CN118887200A (en) | Defect identification method, device, computer equipment and readable storage medium | |
| Choudhary et al. | A novel approach for edge detection for blurry images by using digital image processing | |
| CN113592801B (en) | Stripe interference detection method and device for video image | |
| Costianes et al. | Gray-level co-occurrence matrices as features in edge enhanced images | |
| Liu et al. | Background subtraction with multispectral images using codebook algorithm | |
| Masa et al. | Comparison of Noise Using Reduction Method for Repairing Digital Image | |
| Madhekar et al. | Real time object detection and tracking using Raspberry Pi | |
| Kim et al. | Analyzing the performance of canny edge detection on interpolated Images | |
| Dey et al. | Object detection using point feature matching based on SURF algorithm | |
| Priyadharshini et al. | Research and analysis on segmentation and thresholding techniques | |
| Domae et al. | Robust tracking based on orientation code matching under irregular conditions | |
| Kim et al. | Fast ROI Detection for Speed up in a CNN based Object Detection | |
| Dorado-Munoz et al. | Schrodinger eigenmaps for spectral target detection | |
| Kumar et al. | Small Motion Magnification Using Automated RoI Selection and Spatial Co-ordinate Approach |
Legal Events
| Date | Code | Title | Description |
|---|---|---|---|
| A621 | Written request for application examination |
Free format text: JAPANESE INTERMEDIATE CODE: A621 Effective date: 20100709 |
|
| A761 | Written withdrawal of application |
Free format text: JAPANESE INTERMEDIATE CODE: A761 Effective date: 20111031 |