EP3588120B1 - System und verfahren zur verbesserten signaldetektion in der nmr-spektroskopie - Google Patents
System und verfahren zur verbesserten signaldetektion in der nmr-spektroskopie Download PDFInfo
- Publication number
- EP3588120B1 EP3588120B1 EP18179985.9A EP18179985A EP3588120B1 EP 3588120 B1 EP3588120 B1 EP 3588120B1 EP 18179985 A EP18179985 A EP 18179985A EP 3588120 B1 EP3588120 B1 EP 3588120B1
- Authority
- EP
- European Patent Office
- Prior art keywords
- signal
- values
- frequency
- nmr
- base value
- Prior art date
- Legal status (The legal status is an assumption and is not a legal conclusion. Google has not performed a legal analysis and makes no representation as to the accuracy of the status listed.)
- Active
Links
Images


Classifications
-
- G—PHYSICS
- G01—MEASURING; TESTING
- G01R—MEASURING ELECTRIC VARIABLES; MEASURING MAGNETIC VARIABLES
- G01R33/00—Arrangements or instruments for measuring magnetic variables
- G01R33/20—Arrangements or instruments for measuring magnetic variables involving magnetic resonance
- G01R33/44—Arrangements or instruments for measuring magnetic variables involving magnetic resonance using nuclear magnetic resonance [NMR]
- G01R33/46—NMR spectroscopy
- G01R33/4625—Processing of acquired signals, e.g. elimination of phase errors, baseline fitting, chemometric analysis
-
- G—PHYSICS
- G01—MEASURING; TESTING
- G01R—MEASURING ELECTRIC VARIABLES; MEASURING MAGNETIC VARIABLES
- G01R33/00—Arrangements or instruments for measuring magnetic variables
- G01R33/20—Arrangements or instruments for measuring magnetic variables involving magnetic resonance
- G01R33/44—Arrangements or instruments for measuring magnetic variables involving magnetic resonance using nuclear magnetic resonance [NMR]
- G01R33/48—NMR imaging systems
- G01R33/54—Signal processing systems, e.g. using pulse sequences ; Generation or control of pulse sequences; Operator console
- G01R33/543—Control of the operation of the MR system, e.g. setting of acquisition parameters prior to or during MR data acquisition, dynamic shimming, use of one or more scout images for scan plane prescription
Definitions
- the present invention generally relates to signal detection in NMR spectroscopy and more particularly to improved signal detection based on systematic variation of signal properties.
- Nuclear magnetic resonance (NMR) spectroscopy is a spectroscopic technique to observe local magnetic fields around atomic nuclei.
- a sample is placed in a magnetic field and the NMR signal is produced by excitation of the nuclei sample with radio frequency (RF) pulses into nuclear magnetic resonance, which is detected with sensitive RF receivers.
- RF radio frequency
- the intramolecular magnetic field around an atom in a molecule changes the resonance frequency, thus giving access to details of the electronic structure of a molecule and its individual functional groups.
- RF radio frequency
- NMR spectroscopy is used to identify monomolecular organic compounds, proteins and other complex molecules. Besides identification, NMR spectroscopy provides detailed information about the structure, dynamics, reaction state, and chemical environment of molecules. Common types of NMR are proton and carbon-13 NMR spectroscopy, but it is applicable to any kind of sample that contains nuclei possessing spin.
- FID free induction decay
- the FID is a very weak signal and requires sensitive RF receivers to pick up.
- a Fourier transform can be applied to extract the frequency-domain spectrum from the raw time-domain FID.
- a spectrum from a single FID typically has a low signal-to-noise ratio. Decay times of the excitation, typically measured in seconds, depend on the effectiveness of relaxation, which is faster for lighter nuclei and in solids, and slower for heavier nuclei and in solutions whereas they can be very long in gases.
- Some existing NMR signal detection methods are based on computing the derivation of the frequency spectrum in a first step.
- broad signals i.e. signals extending over a relatively large frequency interval in the frequency domain
- narrow signals are preserved.
- the derivation generates artefacts which can lead to false positives and false negatives.
- Such disadvantages can be remedied only partially with the Continuous Wavelet Transformation.
- a prior art solution is disclosed in the paper " Salient space detection algorithm for signal extraction from contaminated and distorted spectrum” by Y. W. Jia et al. (THE ANALYST, vol. 143, no. 11, 14. May 2018 ).
- An algorithm for signal extraction from a contaminated and distorted spectrum is proposed.
- this algorithm combines the salient space of the spectrum and the statistical characteristics of the noise to detect signal regions at different scales.
- Another prior art solution is disclosed in the paper " An Automatic Baseline Extraction Algorithm for Intensity Absorption Type Gas Sensing” by Yunwei Jia et al. (Journal of Lightwave Technology 2013, vol. 31, no. 22, 15. Nov. 2013 ).
- An algorithm for automatic baseline extraction of gas absorption spectrum is proposed. It is based on an automatic signal-free regions recognition that uses a difference of Gaussians function, followed by a baseline fitting procedure based on segmented polynomial fitting and segmented kernel smoothing.
- Embodiments of the invention as claimed in the independent claims 1, 9 and 10 in the form of a computer-implemented method, computer system and computer program product solve this technical problem using the claimed features.
- a computer-implemented spectroscopic method for improved NMR signal detection is provided.
- the computer-implemented method can be executed by a computer system which can process a respective computer program product.
- the computer system has an interface to receive NMR signal data produced by a sample over time in response to an excitation pulse.
- the excitation pulse is an RF-pulse and the response of the sample, the free induction decay FID, is an exponentially falling, weak radio signal which typically ceases within about two seconds after the excitation pulse.
- the resulting frequency spectrum shows multiple signal peaks at different frequencies which are indicative of certain nuclear cores (e.g., 1 H, 13 C, 15 N, etc.).
- the amplitude of such peaks can be very small and difficult to distinguish from noise components of the signal.
- the width of some peaks can be quite broad (extending over a relatively large frequency range).
- the claimed approach uses a predefined system function and applies the system function to the NMR signal data for systematic variation of signal properties.
- the NMR signal data may be the originally sampled data in the time-domain or the data may already be transformed into the frequency-domain.
- the system function can be selected from a group of possible system functions suitable for the respective domain. For example, there are system functions which are applicable to the raw time-domain data (the data directly obtained from the measurement) whereas other system functions can be applied to the corresponding frequency spectrum.
- Appropriate system functions include but are not limited to: convolution in the Frequency domain using a Lorentz function, Gaussian function or Trapezium function, and multiplication in the time domain using an exponential decay function, exponential slope function or trigonometric function.
- convolution in the Frequency domain using a Lorentz function, Gaussian function or Trapezium function and multiplication in the time domain using an exponential decay function, exponential slope function or trigonometric function.
- an exponential decay function is advantageous with regards to the computational efficiency of the system.
- the noise components dominate at a later delay than the signal components. So multiplication of the raw data in the time domain with an exponential decay function results in a higher amplification of the signal components than of the noise components.
- the system function is applied in the time-domain or in the frequency-domain as long as an appropriate system function is selected for the respective domain.
- the selected system function is adapted to have a different influence on NMR signal components than on noise components of the sampled signal.
- the system function has a variation parameter which allows to control the systematic variation of the signal properties.
- applying the system function with multiple different variation parameter values to the NMR signal data allows to produce multiple variation versions of the NMR signal data.
- a corresponding intermediate data set is generated for each variation parameter value.
- 3 to 20 variation parameters can be used.
- 5 to 10 variations parameter values are used.
- the variation parameter values may be provided as predefined parameters which are of the order of the half-width of signal peaks in the frequency-domain of the received NMR data set. That is, the parameter values are defined in such a way that each relevant peak of the spectrum (in the frequency-domain) is influenced by at least one of the variation parameter values.
- the variation parameter values may be predefined based on the experience gained from previous measurements.
- the differing values of the variation parameter values can be selected to influence, in the frequency-domain, NMR signals with a signal intensity within a given interval around the mean signal intensity of the sampled signal, and NMR signals with a signal width within a given interval around the mean signal width.
- variation parameter values ensure that sharp signals with low signal intensity as well as broad signals will be substantially affected by the application of the system function which will finally allow to detect such signals with high certainty. Affecting a signal substantially when applying the system function means that the different variation parameter values lead to a significant variation (e.g., variance) of the processed signal values in the respective intermediate data sets.
- the system can automatically analyze the peaks in the frequency spectrum of the received NMR data set. The system can then automatically determine appropriate parameter values based on the height and width of the observed peaks in accordance with the above selection criteria.
- system functions are adapted to be applied in the time-domain, whereas other system functions are adapted to be applied in the frequency domain.
- system functions such as, for example, the exponential decay function
- the application of the system function in the time-domain leads to a computationally efficient embodiment.
- the computer system then generates from each intermediate data set a respective base value centered spectrum in the frequency-domain.
- a Fourier transformation can be used to transform the intermediated data sets into the frequency domain.
- no such transformation is necessary at this stage.
- the computer system computes for each frequency point of the intermediate data sets in the frequency-domain an ensemble base value based on the respective values of all intermediate data sets. That is, the ensemble base value at a particular frequency point may be formed, for example, as the arithmetic mean of the respective intermediate data set values at the particular frequency point.
- the system distinguishes the NMR signal components from the noise components which are included in the received raw signal data. This is achieved by extracting from the base value centered spectra for each frequency point variations induced by the system function and identifying frequency intervals with significant variation as signal intervals.
- the system generates a (single) deviation spectrum (e.g., a standard deviation spectrum) from the plurality of generated base value centered spectra.
- the deviation spectrum includes frequency intervals which include peaks resulting from variations induced by the system function, and further includes frequency intervals with noise components only.
- the system selects a non-signal (frequency) interval in the deviation spectrum.
- a non-signal interval can easily be determined by looking at a particular frequency interval which does not show any peaks and analyzing whether the signal in the particular frequency interval shows a normal distribution and therefore qualifies as a mere noise signal with no NMR signal components included.
- a weighted noise value is now determined for non-signal intervals in the deviation spectrum.
- a noise value can then be determined by computing the mean value and the standard deviation for the selected non-signal frequency interval in the deviation spectrum.
- the computed standard deviation can then be multiplied with a predefined weighting factor resulting in a weighted noise value.
- the weighting factor is selected so that a threshold probability is determined for values in the deviation spectrum which ensures that values being lower than or equal to the weighted noise value to qualify as noise values with said threshold probability. For example, multiplying the computed standard deviation with a weighting factor of 3.5 implies a 99% probability that all values beneath the weighted noise value are mere noise components of the signal and do not include any NMR signal components.
- iterative thresholding may be used to determine the weighted noise values. Iterative thresholding algorithms are well-known by the skilled person as technique for determining noise values.
- this is achieved by determining values in the deviation spectrum which are higher than the weighted noise value as NMR signal components.
- those parts of the base value centered spectra significant variations induced by the system function for different variation parameter values indicate frequency intervals with NMR signal components. They can be easily extracted as the peaks exceeding the weighted noise level in the deviation spectrum. In other words, a significant variation is present when a peak in the deviation spectrum exceeds the weighted noise level.
- the system instead of using the deviation spectrum, the system generates an eigenspace matrix from the plurality of generated base value centered spectra to extract the induced variations.
- the eigenspace matrix can include a row for each base value centered spectrum where each column includes the spectrum values for the respective frequency points.
- the absolute values represent the variations induced by the system function. If more than one eigenvector result is used, the resulting eigenvectors are summed up. In some cases, the absolute values of the first eigenvector of the matrix may already be sufficient and no summation is required.
- the eigenvector result is similar to the deviation spectrum where the absolute values of the at least first eigenvector (or the respective sum of eigenvectors) represent the system function induced variations.
- weighted noise values can be determined by using the same methodologies as disclosed in the deviation spectrum embodiment.
- the absolute values of the eigenvector result are then compared with the respective weighted noise values and NMR signal components are identified for such frequency points where the absolute values are greater than the weighted noise values.
- a computer program product when loaded into a memory of a computer system and executed by at least one processor of the computer system causes the computer system to execute the steps of the herein disclosed computer implemented method for functions of the computer system as disclosed herein.
- the computer system for improved NMR signal detection in NMR spectroscopy can be summarized as a system having an interface module to receive NMR signal data produced by a sample over time in response to an excitation pulse.
- An intermediate data set generator of the system selects a predefined system function for application to the sampled NMR signal data for systematic variation of signal properties.
- the system function has a different influence on NMR signal components than on noise components of the sampled signal. Further, the system function has a variation parameter to control the systematic variation. Thereby, different variation parameter values result in different variations when applying the system function to sampled NMR signal data.
- a plurality of variation parameter values is provided to the system (either predefined or determined by the system) wherein the selected parameter values have differing values which are adapted for influencing the sampled NMR signals in the frequency-domain.
- the influence extends to NMR signals with a signal intensity within a given interval around the mean signal intensity of the sampled signal, and NMR signals with a signal width within a given interval around the mean signal width.
- the variation parameter values are selected in a way that the system function affects every signal component in the sampled NMR signal data in at least one variation parameter setting.
- the intermediate data set generator (IDSG) then generates for each variation parameter value a corresponding intermediate data set by applying the system function with the respective variation parameter value to the sampled NMR signal data.
- the system further has a base value centered spectrum (BVCS) generator to generate from each intermediate data set, in the frequency-domain, a respective base value centered spectrum.
- BVCS base value centered spectrum
- the BVCS generator may include a time-domain-to-frequency-domain transformer. This may be implemented as a Fourier-Transformation to convert time-domain data into frequency-domain data before BVCS generation.
- the resulting base valued spectra have reduced offsets and include peaks and noise around a zero base line.
- the system further has a signal detector to generate a deviation spectrum from the plurality of generated base value centered spectra.
- the deviation spectrum shows significant variations for frequency points where NMR signal components were affected by the system function. For frequency points without NMR signal components only the noise components are present.
- the signal detector determines a weighted noise value for the deviation spectrum. Any peak of the deviation spectrum exceeding the weighted signal noise value corresponds to a sampled NMR signal component with a probability associated with the weighted noise value.
- a signal-noise comparator of the signal detector detects signal intervals by extracting from the base value centered spectra for each frequency point variations induced by the system function. The frequency intervals with significant variations are identified identify as signal intervals.
- the signal-noise comparator may work on the basis of the deviation spectrum or it may use the eigenvector determination method as disclosed herein.
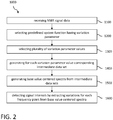
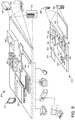
- FIG. 1 is a block diagram of a computer system 100 for improved NMR signal detection in NMR spectroscopy according to an embodiment.
- the system 100 of FIG.1 is described in the context of the simplified flow chart of a computer-implemented spectroscopic method 1000 for improved NMR signal detection as illustrated in FIG. 2 . Therefore, the following description refers to reference numbers used in FIG. 1 and FIG. 2 .
- the system 100 is thereby configured to execute the method 1000 when loading a respective computer program into a memory of the system and executing said program with processing means of the system.
- the computer system 100 includes an interface module 110 for communicative coupling of the system 100 to a NMR system 200 for performing NMR measurements on a sample 201. Further, the interface 110 may be coupled with an Input/Output (I/O) unit 300 which allows a human user to interact with the computer system 100. Via the interface 110, the system receives 1100 NMR signal data 202 produced by the sample 201 over time in response to an excitation pulse. Such measurements techniques are well known in the art.
- the received signal data 202 may be in the time-domain or in the frequency-domain dependent on the data pre-processing functions of the NMR system 200.
- the original raw data captured by the NMR system 200 are in the time-domain measuring the signal decay over time.
- appropriate data pre-processing means of the NMR system 200 may already provide a frequency spectrum based on the captured data. It is to be noted that, form a conceptual perspective, it is irrelevant whether the received signal data 202 is in the time- or frequency-domain as data in each domain can be transformed into data of the other domain without any information loss.
- the received NMR signal data 202 forms input to an intermediate data set generator (IDSG) 120.
- the IDSG 120 can access one or more predefined system functions 121.
- the system function(s) may be stored by the computer system or can be at least accessed by the system on a remote storage.
- a particular predefined system function 121 can be applied to the sampled NMR signal data 202 for systematic variation of signal properties. Thereby, the system function 121 has a different influence on NMR signal components than on noise components of the sampled signal.
- the system function has a variation parameter (VP) 122 to control the systematic variation.
- VP variation parameter
- the IDSG 120 selects 1200 a system function which is appropriate for the domain in which the NMR signal data 202 is received.
- the system function can be advantageously selected from the following group of functions: exponential decay function, exponential slope function, or a trigonometric function (e.g., sinus or cosine function). However, other system functions may also be used which are appropriate for signal data in the time-domain.
- This signal function is applied to the received signal data by multiplying the system function with the NMR signal data 202.
- the system function can be advantageously selected from the following group of functions: Lorentz function, Gaussian function, or Trapezium Function. The system function is then used in a convolution with the NMR signal data 202.
- a VP provisioning module 122 provides a plurality of variation parameter values.
- the parameter values selected for the variation have differing values covering an appropriate value range.
- the selected VP values are adapted for influencing the signal data 202 when represented in the frequency-domain so that NMR signals are affected which have a signal intensity within a given interval around the mean signal intensity of the sampled signal data 202, and which have signal width within a given interval around the mean signal width. That is, the VP values are selected 1300 to ensure that narrow signals with lower intensity may similarly be affected as broad signals with higher intensity. This is achieved by using a range of VP values so that each NMR signal component is affected by at least one of the selected VP values when applying the system function accordingly.
- the VP values may be automatically determined by the computer system based on such criteria or they may be provided by user of the computer system via the I/O unit 300.
- the variation parameter of the system function has Hertz as the unit of measurement and the number of variation parameter values is in the range from 3 to 20.
- the number of VP values is in the range from 5 to 10.
- the IDSG 120 then generates 1400 for each selected variation parameter value a corresponding intermediate data set 102-1 to 102-n by applying the system function 121 with the respective variation parameter value to the sampled NMR signal data 202. If the number of selected VP values is n this results in n intermediate data sets 102-1 to 102-n. Each intermediate data set shows different values for such sampled data points where NMR signal components are present.
- a base value centered spectrum (BVCS) generator 130 of the computer system 100 generates 1500 from each intermediate data set 102-1 to 102-n, in the frequency-domain, a respective mean base value centered spectrum 103-1 to 103-n. As this step is performed in the frequency domain, a transformation of the intermediate data sets into the frequency-domain occurs in case the system function was applied in the time-domain, for example by using Fourier Transformation.
- the respective base value centered spectra eliminate offsets from the intermediate data sets. This is achieved by approximating corresponding base values representing the actual offsets and deducting the approximated offsets from the intermediate data set values.
- the BVCS generator 130 For generating the base value centered spectra the BVCS generator 130 computes for each frequency point of the intermediate data sets in the frequency-domain an ensemble base value based on the respective values of all intermediate data sets. That is, the ensemble base value at a particular frequency point may be formed, for example, as the arithmetic mean of the respective intermediate data sets values at the particular frequency point. Other mean values or statistical methods may be used to compute an appropriate base value, including but not limited to geometric mean, harmonic mean, quadratic mean, median value, etc. For each frequency the respective computed ensemble base value is then subtracted from the respective values of the intermediate data sets resulting in the corresponding base value centered spectrum for each intermediate data set. If n variation parameter values were used for signal variation through the system function n base value centered spectra result from this step.
- the generated base value centered spectra serve as input to a signal detector 140 of the computer system 100.
- the signal detector 140 detects 1600 signal intervals 109 by extracting from the base value centered spectra 103-1 to 103-n for each frequency point variations induced by the system function.
- the detector 140 finally identifies frequency intervals showing significant variations as signal intervals.
- the signal detector may be implemented by various embodiments.
- the signal detector 140 extracts the variations from the base value centered spectra 103-1 to 103-n by firstly generating a deviation spectrum from the plurality of generated base value centered spectra 103-1 to 103-n. That is, for each frequency point the standard deviation is computed taking into account the respective values of all generated base value centered spectra.
- the noise signal corresponds to a normal distribution and can be determined by computing the mean value and the standard deviation for a non-signal interval in the deviation spectrum.
- the non-signal interval may be any frequency interval in the deviation spectrum corresponding to a frequency interval having a normal distribution.
- the system may first select an interval where no signal peaks appear, and may then analyze whether the selected interval complies with the normal distribution criterion. If so, the noise value is computed. If not, another interval is selected and the same tests are performed until a mere noise interval (i.e., an interval without NMR signal components) is finally determined.
- the computed noise value may then be multiplied with a predefined weighting factor.
- the weighting factor determines a threshold probability for values in the deviation spectrum which are lower than or equal to the weighted noise value to qualify as noise values with said threshold probability. For example, when using the standard deviation multiplied with a factor of 3,5 to compute the weighted noise value there is a 99% probability that all values below the weighted noise value actually represent noise components of the signal.
- the values in the deviation spectrum which are higher than the weighted noise value qualify as NMR signal components. Once the signal components are identified the respective signal intervals correspond to the frequency intervals in the deviation spectrum including the detected NMR signal components.
- the computer system may include a smoothening and phase correction module 150 to smoothen the basis line in the deviation spectrum and to perform a phase correction on the detected NMR signal intervals.
- a smoothening and phase correction module 150 to smoothen the basis line in the deviation spectrum and to perform a phase correction on the detected NMR signal intervals.
- the signal detector 140 generates an eigenspace matrix from the plurality of generated base value centered spectra 103-1 to 103-n and determines the absolute values of at least the first eigenvector of the matrix.
- Such absolute values represent the system function induced variations.
- the eigenspace matrix can be constructed by including a row for each base value centered spectrum where each column includes the spectrum values for the respective frequency points.
- the relevant eigenvalues are determined by a threshold. For example, a relative threshold of a value of 10 -5 may be used, i.e. all eigenvalues above maximum eigenvalue times the relative threshold are used. Then the absolute values of the corresponding eigenvectors, multiplied with their eigenvalues are used.
- the resulting eigenvectors are summed up.
- the absolute values of the first eigenvector of the matrix may already be sufficient and no summation is required.
- the eigenvector result is similar to the deviation spectrum where the absolute values of the at least first eigenvector (or the respective sum of eigenvectors) represent the system function induced variations.
- weighted noise values can be determined by using the same methodologies as disclosed in the deviation spectrum embodiment.
- the absolute values of the eigenvector result are then compared with the respective weighted noise values and NMR signal components are identified for such frequency points where the absolute values are greater than the weighted noise values.
- the signal detector 140 uses iterative thresholding when extracting the variation for each frequency point from the base value centered spectra 103-1 to 103-n to detect the NMR signal intervals.
- Iterative Thresholding is a method to detect signals in spectra which is described, for example, in Bao Q., et. al., A robust automatic phase correction method for signal dense spectra, J. Mag. Res. 234 (2013) 82-89 .
- An initial threshold value is determined by computing the standard deviation of the respective spectrum and multiplying the standard deviation with a predefined factor.
- the predefined factor is called noise factor. Again, the basic assumption here is that noise follows a Gaussian normal distribution.
- the noise factor represents the confidence interval.
- a new standard deviation is determined based on all points of the spectrum which are smaller than the initial threshold.
- a new threshold is then computed based on the new standard deviation and the noise factor. This process is then iterated until the new standard deviation differs from the previously calculated standard deviation in less than a predefined delta value. Based on the last determined standard deviation the remaining steps of the first signal detector embodiment can be applied to finally detect the signal intervals.
- FIG. 3A illustrates received NMR signal data 311 in the time-domain.
- the time scale 310- x of the signal graph 310 is in multiples of Dwell time (in this example 14 microseconds).
- the signal intensity is given in arbitrary units of the measurement.
- the Dwell Time is defined as the number of seconds between points during data acquisition in the FID, which is the same as seconds/point.
- the figure shows a quick signal decay which occurs after the excitation of the sample with the excitation pulse.
- FIG. 3B shows the real part 321 of the NMR signal data 311 when transformed into a frequency spectrum 320 after a Fourier Transformation of the time signal 311.
- the imaginary part of the frequency spectrum is not shown here but would also be needed to transform the NMR signal data in the frequency-domain back into the time domain using inverse Fourier Transformation. Both domain representations of the received NMR signal data may be used as an input for the IDS generator.
- the IDS generator then applies a predefined system function to the received NMR signal data in accordance with the respective domain.
- a predefined system function e -LB ⁇ Dw ⁇ t is used.
- Such an exponential function has proven to be computationally efficient for application in the time-domain.
- DW corresponds to the Dwell time (the distance between two data points in the time-domain).
- the parameter LB corresponds to the variation parameter of the system function and has Hz as the unit of measurement with the advantage that it can easily be adjusted for different Larmor frequencies (e.g., 1 H, 13 C, 15 N).
- FIG. 4A illustrates the system function f(t) in the time-domain 410 (time axis 410-x) for three different VP values (in the example: 1 Hz, 10 Hz, and 20 Hz) resulting in three instances 411,412, 413 of the system function f(t).
- the unit of the x-axis of a graph nnn is referred to as nnn-x and the unit of the y-axis of said graph is referred to as nnn-y.
- FIG. 4B illustrates an example of a system function 420 in the frequency-domain (x-axis 420-x in Hz) which can be used for a convolution with received NMR signal data in the frequency domain.
- three different VP values lead to three different instances 421, 422, 423 of the system function.
- FIG. 5A shows three intermediate data sets 501, 502, 503 as the result of the application of said system function to the NMR signal data with three different VP values.
- the example graph 510 shows the intermediate data sets in the frequency-domain with the unit 510-x (Points, distance between points is dwell time DW).
- the intensity 510-y has arbitrary units from the measurement.
- the influence of the applied system function on the signal height is increasing from intermediate data set 501 to intermediate data set 503 (i.e., the respective peak heights are increasing).
- This example shows how the application of the system functions with different VP values generates a plurality of intermediate data sets with a substantial variation in such parts of the NMR signal spectrum which includes NMR signal components whereas such parts including only noise components are hardly affected by the variation.
- FIG. 5B shows a more detailed view 520 of intermediate data sets 521 to 523 focusing on only a small portion in the frequency dimension 520-x where only a single NMR signal peak was included.
- the shape of the signal peak is substantially affected by the system function for three different VP values leading to substantial differing variations of the original NMR signal for differing VP values.
- FIG. 5C shows an overlay graph 530 where the intermediate data sets of FIG. 5B are printed as overlays at substantially the same y values in the 530-y dimension.
- the overlay graph clearly visualizes the variations of the respective signal peak in the intermediate data sets 531 to 533.
- the position of the peak in the frequency dimension 530-x corresponds to the position in FIG. 5B .
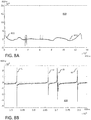
- the intermediate data sets serve as input to the BVCS generator for generating respective base value centered spectra 611 to 613.
- the base value centered spectra in the BVCS graph 610 of FIG. 6A show the result of processing the intermediate data sets for eliminating offsets in such a way that the result leads to curves which are horizontally aligned around zero, removing the local base values. Thereby, the base values are an approximation of the actual offsets of the respective curve.
- the BVCS spectra are always determined in the frequency-domain. For example, the BVCS generator can compute the BVCS spectra by determining a mean value for each frequency point based on all intermediated data sets.
- FIG. 6B shows another BVCS graph 620 with a more detailed view on a frequency interval of the spectra including a single peak located close to the frequency 36650 620-x.
- FIG. 6C shows the base value centered spectra 631 to 633 as an overlay graph 630 corrected by the offsets approximated by the determined base values.
- FIG. 6D again shows a detailed overlay view 640 of a frequency range including a single peak for three BVCS 641, 642, 643 associated with three different VP values.
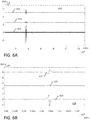
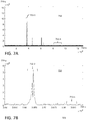
- FIGs. 7A and 7B relate to the embodiment using a deviation spectrum 710, 720 for extracting variations induced by the system function from the base value centered spectra for each frequency point.
- the deviation spectrum 710 is shown for the entire frequency range of the respective base value centered spectra.
- the peak 711-1 indicates a first frequency interval with a high variation (significant variation peak) which is an indicator for the presence on NMR signal components in the first frequency interval.
- a second frequency range at 711-n shows substantially no variation at all which is an indicator that within the second frequency interval only noise components are present but no NMR signal components.
- FIG. 7B shows a detailed view of the deviation spectrum 720 over a portion of the frequency range with a variation double peak in frequency interval 712-2 and substantially no variation in frequency interval 712-n.
- the system can determine a noise value.
- a noise signal follows a Gaussian normal distribution.
- the system can select any of the frequency intervals showing substantially no variation (e.g., frequency intervals 711-n, 712-n) and computing the mean value and the standard deviation for this (non-signal) interval in the deviation spectrum. If the standard deviation follows a normal distribution a frequency interval is identified which has no NMR signal components but only noise components.
- the computed noise value can then be multiplied with a predefined weighting factor.
- the weighting factor determines a threshold probability for values in the deviation spectrum which are lower than or equal to the weighted noise value to qualify as noise values with said threshold probability.
- the noise factor can be chosen in the range of the half width of the Gaussian curve.
- the factor is 3.5 covering 99% of the peak integral. In other words, multiplying the standard deviation with a factor of 3.5 can be used to achieve a probability of 0.99 that all values of the deviation spectrum which have a value lower than then weighted noise value actually represent noise.
- FIG. 8A shows a signal interval graph 810 with the original NMR signal data 811 and an overlay curve 812 (dotted line) indicating the signal intervals.
- FIG. 8B again shows a detailed view 820 for a part of the frequency range including the four signal intervals 11, 12, 13 and 14.
- the identified signal intervals (e.g, 11, 12, 13 and 14) allow robust NMR signal detection with higher accuracy than prior art solutions for signal detection. On the basis of the identified signals highly precise NMR analysis becomes possible.
- FIG. 9 is a diagram that shows an example of a generic computer device 900 and a generic mobile computer device 950, which may be used with the techniques described here.
- computing device 900 may relate to the system 100 (cf. FIG. 1 ).
- Computing device 950 is intended to represent various forms of mobile devices, such as personal digital assistants, cellular telephones, smart phones, and other similar computing devices. In the context of this disclosure the computing device 950 may provide the I/O means of FIG. 1 . In other embodiments, the entire system 100 may be implemented on the mobile device 950.
- the components shown here, their connections and relationships, and their functions, are meant to be exemplary only, and are not meant to limit implementations of the inventions described and/or claimed in this document.
- Computing device 900 includes a processor 902, memory 904, a storage device 906, a high-speed interface 908 connecting to memory 904 and high-speed expansion ports 910, and a low speed interface 912 connecting to low speed bus 914 and storage device 906.
- Each of the components 902, 904, 906, 908, 910, and 912 are interconnected using various busses, and may be mounted on a common motherboard or in other manners as appropriate.
- the processor 902 can process instructions for execution within the computing device 900, including instructions stored in the memory 904 or on the storage device 906 to display graphical information for a GUI on an external input/output device, such as display 916 coupled to high speed interface 908.
- multiple processors and/or multiple buses may be used, as appropriate, along with multiple memories and types of memory.
- multiple computing devices 900 may be connected, with each device providing portions of the necessary operations (e.g., as a server bank, a group of blade servers, or a multi-processor system).
- the memory 904 stores information within the computing device 900.
- the memory 904 is a volatile memory unit or units.
- the memory 904 is a non-volatile memory unit or units.
- the memory 904 may also be another form of computer-readable medium, such as a magnetic or optical disk.
- the storage device 906 is capable of providing mass storage for the computing device 900.
- the storage device 906 may be or contain a computer-readable medium, such as a floppy disk device, a hard disk device, an optical disk device, or a tape device, a flash memory or other similar solid state memory device, or an array of devices, including devices in a storage area network or other configurations.
- a computer program product can be tangibly embodied in an information carrier.
- the computer program product may also contain instructions that, when executed, perform one or more methods, such as those described above.
- the information carrier is a computer- or machine-readable medium, such as the memory 904, the storage device 906, or memory on processor 902.
- the high speed controller 908 manages bandwidth-intensive operations for the computing device 900, while the low speed controller 912 manages lower bandwidth-intensive operations.
- the high-speed controller 908 is coupled to memory 904, display 916 (e.g., through a graphics processor or accelerator), and to high-speed expansion ports 910, which may accept various expansion cards (not shown).
- low-speed controller 912 is coupled to storage device 906 and low-speed expansion port 914.
- the low-speed expansion port which may include various communication ports (e.g., USB, Bluetooth, Ethernet, wireless Ethernet) may be coupled to one or more input/output devices, such as a keyboard, a pointing device, a scanner, or a networking device such as a switch or router, e.g., through a network adapter.
- input/output devices such as a keyboard, a pointing device, a scanner, or a networking device such as a switch or router, e.g., through a network adapter.
- the computing device 900 may be implemented in a number of different forms, as shown in the figure. For example, it may be implemented as a standard server 920, or multiple times in a group of such servers. It may also be implemented as part of a rack server system 924. In addition, it may be implemented in a personal computer such as a laptop computer 922. Alternatively, components from computing device 900 may be combined with other components in a mobile device (not shown), such as device 950. Each of such devices may contain one or more of computing device 900, 950, and an entire system may be made up of multiple computing devices 900, 950 communicating with each other.
- Computing device 950 includes a processor 952, memory 964, an input/output device such as a display 954, a communication interface 966, and a transceiver 968, among other components.
- the device 950 may also be provided with a storage device, such as a microdrive or other device, to provide additional storage.
- a storage device such as a microdrive or other device, to provide additional storage.
- Each of the components 950, 952, 964, 954, 966, and 968 are interconnected using various buses, and several of the components may be mounted on a common motherboard or in other manners as appropriate.
- the processor 952 can execute instructions within the computing device 950, including instructions stored in the memory 964.
- the processor may be implemented as a chipset of chips that include separate and multiple analog and digital processors.
- the processor may provide, for example, for coordination of the other components of the device 950, such as control of user interfaces, applications run by device 950, and wireless communication by device 950.
- Processor 952 may communicate with a user through control interface 958 and display interface 956 coupled to a display 954.
- the display 954 may be, for example, a TFT LCD (Thin-Film-Transistor Liquid Crystal Display) or an OLED (Organic Light Emitting Diode) display, or other appropriate display technology.
- the display interface 956 may comprise appropriate circuitry for driving the display 954 to present graphical and other information to a user.
- the control interface 958 may receive commands from a user and convert them for submission to the processor 952.
- an external interface 962 may be provide in communication with processor 952, so as to enable near area communication of device 950 with other devices.
- External interface 962 may provide, for example, for wired communication in some implementations, or for wireless communication in other implementations, and multiple interfaces may also be used.
- the memory 964 stores information within the computing device 950.
- the memory 964 can be implemented as one or more of a computer-readable medium or media, a volatile memory unit or units, or a non-volatile memory unit or units.
- Expansion memory 984 may also be provided and connected to device 950 through expansion interface 982, which may include, for example, a SIMM (Single In Line Memory Module) card interface.
- SIMM Single In Line Memory Module
- expansion memory 984 may provide extra storage space for device 950, or may also store applications or other information for device 950.
- expansion memory 984 may include instructions to carry out or supplement the processes described above, and may include secure information also.
- expansion memory 984 may act as a security module for device 950, and may be programmed with instructions that permit secure use of device 950.
- secure applications may be provided via the SIMM cards, along with additional information, such as placing the identifying information on the SIMM card in a non-hackable manner.
- the memory may include, for example, flash memory and/or NVRAM memory, as discussed below.
- a computer program product is tangibly embodied in an information carrier.
- the computer program product contains instructions that, when executed, perform one or more methods, such as those described above.
- the information carrier is a computer- or machine-readable medium, such as the memory 964, expansion memory 984, or memory on processor 952, that may be received, for example, over transceiver 968 or external interface 962.
- Device 950 may communicate wirelessly through communication interface 966, which may include digital signal processing circuitry where necessary. Communication interface 966 may provide for communications under various modes or protocols, such as GSM voice calls, SMS, EMS, or MMS messaging, CDMA, TDMA, PDC, WCDMA, CDMA2000, or GPRS, among others. Such communication may occur, for example, through radio-frequency transceiver 968. In addition, short-range communication may occur, such as using a Bluetooth, WiFi, or other such transceiver (not shown). In addition, GPS (Global Positioning System) receiver module 980 may provide additional navigation- and location-related wireless data to device 950, which may be used as appropriate by applications running on device 950.
- GPS Global Positioning System
- Device 950 may also communicate audibly using audio codec 960, which may receive spoken information from a user and convert it to usable digital information. Audio codec 960 may likewise generate audible sound for a user, such as through a speaker, e.g., in a handset of device 950. Such sound may include sound from voice telephone calls, may include recorded sound (e.g., voice messages, music files, etc.) and may also include sound generated by applications operating on device 950.
- Audio codec 960 may receive spoken information from a user and convert it to usable digital information. Audio codec 960 may likewise generate audible sound for a user, such as through a speaker, e.g., in a handset of device 950. Such sound may include sound from voice telephone calls, may include recorded sound (e.g., voice messages, music files, etc.) and may also include sound generated by applications operating on device 950.
- the computing device 950 may be implemented in a number of different forms, as shown in the figure. For example, it may be implemented as a cellular telephone 980. It may also be implemented as part of a smart phone 982, personal digital assistant, or other similar mobile device.
- implementations of the systems and techniques described here can be realized in digital electronic circuitry, integrated circuitry, specially designed ASICs (application specific integrated circuits), computer hardware, firmware, software, and/or combinations thereof.
- ASICs application specific integrated circuits
- These various implementations can include implementation in one or more computer programs that are executable and/or interpretable on a programmable system including at least one programmable processor, which may be special or general purpose, coupled to receive data and instructions from, and to transmit data and instructions to, a storage system, at least one input device, and at least one output device.
- the systems and techniques described here can be implemented on a computer having a display device (e.g., a CRT (cathode ray tube) or LCD (liquid crystal display) monitor) for displaying information to the user and a keyboard and a pointing device (e.g., a mouse or a trackball) by which the user can provide input to the computer.
- a display device e.g., a CRT (cathode ray tube) or LCD (liquid crystal display) monitor
- a keyboard and a pointing device e.g., a mouse or a trackball
- Other kinds of devices can be used to provide for interaction with a user as well; for example, feedback provided to the user can be any form of sensory feedback (e.g., visual feedback, auditory feedback, or tactile feedback); and input from the user can be received in any form, including acoustic, speech, or tactile input.
- the systems and techniques described here can be implemented in a computing device that includes a back end component (e.g., as a data server), or that includes a middleware component (e.g., an application server), or that includes a front end component (e.g., a client computer having a graphical user interface or a Web browser through which a user can interact with an implementation of the systems and techniques described here), or any combination of such back end, middleware, or front end components.
- the components of the system can be interconnected by any form or medium of digital data communication (e.g., a communication network). Examples of communication networks include a local area network ("LAN”), a wide area network (“WAN”), and the Internet.
- LAN local area network
- WAN wide area network
- the Internet the global information network
- the computing device can include clients and servers.
- a client and server are generally remote from each other and typically interact through a communication network.
- the relationship of client and server arises by virtue of computer programs running on the respective computers and having a client-server relationship to each other.
Landscapes
- Physics & Mathematics (AREA)
- Engineering & Computer Science (AREA)
- Signal Processing (AREA)
- High Energy & Nuclear Physics (AREA)
- Condensed Matter Physics & Semiconductors (AREA)
- General Physics & Mathematics (AREA)
- Spectroscopy & Molecular Physics (AREA)
- Investigating Or Analysing Materials By Optical Means (AREA)
Claims (14)
- Computerimplementiertes spektroskopisches Verfahren (1000) für eine verbesserte NMR-Signaldetektion, das Folgendes umfasst:Empfangen (1100) von NMR-Signaldaten (202), die durch eine Probe (201) im Laufe der Zeit als Reaktion auf einen Anregungsimpuls erzeugt werden;Auswählen (1200) einer vordefinierten Systemfunktion (S, 121) für eine Anwendung auf die NMR-Signaldaten (202) für eine systematische Variation von Signaleigenschaften, wobei die Systemfunktion einen anderen Einfluss auf NMR-Signalkomponenten als auf Rauschkomponenten der NMR-Signaldaten aufweist, wobei die Systemfunktion einen Variationsparameter (VP) aufweist, um die systematische Variation zu steuern;Bereitstellen (1300) mehrerer unterschiedlicher Variationsparameterwerte, wobei die bereitgestellten Variationsparameterwerte geeignet sind, in dem Frequenzbereich NMR-Signale mit einer Signalintensität innerhalb eines gegebenen Intervalls um die mittlere Signalintensität der NMR-Signaldaten (202) und NMR-Signale mit einer Signalbreite innerhalb eines gegebenen Intervalls um die mittlere Signalbreite der NMR-Signaldaten zu beeinflussen;Generieren (1400) eines entsprechenden Zwischendatensatzes (102-1 bis 102-n) für jeden Variationsparameterwert (VP-1 bis VP-n) durch Anwenden der Systemfunktion (121) mit dem jeweiligen Variationsparameterwert (VP-1 bis VP-n) auf die NMR-Signaldaten (202);Generieren (1500) eines jeweiligen basiswertzentrierten Spektrums (103-1 bis 103-n) in dem Frequenzbereich aus jedem Zwischendatensatz (102-1 bis 102-n), wobei die jeweiligen basiswertzentrierten Spektren Verschiebungen aus den Zwischendatensätzen eliminieren;Erfassen (1600) von Signalintervallen (109) durch Extrahieren aus den basiswertzentrierten Spektren (103-1 bis 103-n) für jeden Frequenzpunkt von Variationen, die durch die Systemfunktion herbeigeführt werden, und Identifizieren von Frequenzintervallen mit herbeigeführten Variationen, die jeweilige gewichtete Rauschwerte überschreiten, als Signalintervalle;dadurch gekennzeichnet, dass das Generieren von (1500) basiswertzentrierten Spektren ferner umfasst:Berechnen eines Ensemblebasiswertes für jeden Frequenzpunkt der Zwischendatensätze (102-1 bis 102-n) in dem Frequenzbereich basierend auf den jeweiligen Werten an diesem Frequenzpunkt aller Zwischendatensätze;Subtrahieren der berechneten Ensemblebasiswerte für jede Frequenz von den jeweiligen Werten der Zwischendatensätze, das zu einem entsprechenden basiswertzentrierten Spektrum (103-1 bis 103-n) für jeden Zwischendatensatz (102-1 bis 102-n) führt.
- Verfahren nach Anspruch 1, wobei der Variationsparameter Hertz als die Maßeinheit aufweist und die Anzahl der Variationsparameterwerte in dem Bereich von 3 bis 20 liegt.
- Verfahren nach Anspruch 1 oder 2, wobei die ausgewählte Systemfunktion aus der folgenden Gruppe ausgewählt wird:
exponentielle Abklingfunktion, exponentielle Steigungsfunktion oder trigonometrische Funktion, die mit den NMR-Signaldaten (202) multipliziert werden, wenn die Signaldaten in dem Zeitbereich liegen, und Lorentz-Funktion, Gauß-Funktion oder Trapez-Funktion, die in einer Faltung mit den NMR-Signaldaten (202) verwendet werden, wenn die Signaldaten in dem Frequenzbereich liegen. - Verfahren nach einem der vorhergehenden Ansprüche, wobei das Erfassen (1800) von Signalintervallen (109) Folgendes umfasst:Generieren eines Abweichungsspektrums aus den mehreren generierten basiswertzentrierten Spektren (103-1 bis 103-n) durch Berechnen der Standardabweichung für jeden Frequenzpunkt unter Berücksichtigung der jeweiligen Werte aller generierten basiswertzentrierten Spektren;Bestimmen eines Rauschwertes mit dem Rauschsignal, das einer Normalverteilung entspricht, durch Berechnen des Mittelwertes und der Standardabweichung für ein Nicht-Signalintervall in dem Abweichungsspektrum, wobei das Nicht-Signalintervall einem Frequenzintervall, das eine Normalverteilung aufweist, entspricht;Multiplizieren der berechneten Standardabweichung mit einem vordefinierten Gewichtungsfaktor, wobei der Gewichtungsfaktor eine Schwellenwahrscheinlichkeit für Werte in dem Abweichungsspektrum bestimmt, die kleiner als der oder gleich dem gewichtete/n Rauschwert sind, um sich als Rauschwerte mit der Schwellenwahrscheinlichkeit zu qualifizieren; undBestimmen von Werten in dem Abweichungsspektrum, die höher als der gewichtete Rauschwert sind, als NMR-Signalkomponenten.
- Verfahren nach einem der Ansprüche 1 bis 3, wobei das Erfassen von Signalintervallen Folgendes umfasst:Generieren einer Eigenraummatrix aus den mehreren generierten basiswertzentrierten Spektren (103-1 bis 103-n) durch Einschließen einer Zeile für jedes basiswertzentrierte Spektrum, bei dem jede Spalte die Spektrumwerte für die jeweiligen Frequenzpunkte einschließt;Bestimmen der Absolutwerte von wenigstens dem ersten Eigenvektor der Matrix, wobei die Absolutwerte die durch die Systemfunktion herbeigeführten Variationen darstellen; undIdentifizieren der Absolutwerte, die größer als die jeweiligen gewichteten Rauschwerte sind, als NMR-Signalkomponenten.
- Verfahren nach einem der Ansprüche 1 bis 3, wobei das Erfassen (1800) von Signalintervallen (109) durch Verwenden einer iterativen Schwellenwertbildung durchgeführt wird, wenn die durch die Systemfunktion herbeigeführte Variation für jeden Frequenzpunkt aus den basiswertzentrierten Spektren (103-1 bis 103-n) extrahiert wird.
- Verfahren nach Anspruch 4, das ferner Folgendes umfasst:
Glätten der Basislinie in dem Abweichungsspektrum und Durchführen einer Phasenkorrektur. - Verfahren nach einem der vorhergehenden Ansprüche, wobei die bereitgestellten Variationsparameterwerte in der Größenordnung der halben Breite von Signalspitzen in dem Frequenzbereich der abgetasteten NMR-Signaldaten (202) liegen.
- Computerprogrammprodukt, das Anweisungen umfasst, die, wenn sie in einen Speicher eines Computersystems geladen und durch wenigstens einen Prozessor des Computersystems ausgeführt werden, das Computersystem veranlassen, die Verfahrensschritte nach einem der vorhergehenden Ansprüche durchzuführen.
- Computersystem (100) für eine verbesserte NMR-Signalerfassung in der NMR-Spektroskopie, wobei das System Folgendes umfasst:ein Schnittstellenmodul (110), das konfiguriert ist, um NMR-Signaldaten (202) zu empfangen, die durch eine Probe (201) im Laufe der Zeit als Reaktion auf einen Anregungsimpuls erzeugt werden;einen Zwischendatensatzgenerator (120), der zu Folgendem konfiguriert ist:Auswählen einer vordefinierten Systemfunktion (S, 121) für eine Anwendung auf die NMR-Signaldaten (202) für eine systematische Variation von Signaleigenschaften, wobei die Systemfunktion einen unterschiedlichen Einfluss auf NMR-Signalkomponenten als auf Rauschkomponenten der NMR-Signaldaten aufweist, wobei die Systemfunktion einen Variationsparameter (VP) aufweist, um die systematische Variation zu steuern;Bereitstellen mehrerer unterschiedlicher Variationsparameterwerte, wobei die bereitgestellten Variationsparameterwerte geeignet sind, um in dem Frequenzbereich NMR-Signale mit einer Signalintensität innerhalb eines vorgegebenen Intervalls um die mittlere Signalintensität der NMR-Signaldaten (202) und NMR-Signale mit einer Signalbreite innerhalb eines vorgegebenen Intervalls um die mittlere Signalbreite der NMR-Signaldaten zu beeinflussen;Generieren für jeden Variationsparameterwert (VP-1 bis VP-n) einen entsprechenden Zwischendatensatz (102-1 bis 102-n) durch Anwenden der Systemfunktion (121) mit dem jeweiligen Variationsparameterwert (VP-1 bis VP-n) auf die abgetasteten NMR-Signaldaten (202);einen basiswertzentrierten Spektrumgenerator (130), der zu Folgendem konfiguriert ist:Generieren eines jeweiligen basiswertzentrierten Spektrums (103-1 bis 103-n) aus jedem Zwischendatensatz (102-1 bis 102-n) in dem Frequenzbereich, wobei die jeweiligen basiswertzentrierten Spektren Verschiebungen aus den Zwischendatensätzen eliminieren; undeinen Signaldetektor (140), der zu Folgendem konfiguriert ist:Erfassen von Signalintervallen (109) durch Extrahieren von durch die Systemfunktion herbeigeführten Variationen aus den basiswertzentrierten Spektren (103-1 bis 103-n) für jeden Frequenzpunkt und Identifizieren von Frequenzintervallen mit herbeigeführten Variationen, die entsprechende gewichtete Rauschwerte überschreiten, als Signalintervalle;dadurch gekennzeichnet, dass der basiswertzentrierte Spektrumgenerator ferner konfiguriert ist, um basiswertzentrierte Spektren durch Folgendes zu generieren:Berechnen eines Ensemblebasiswertes für jeden Frequenzpunkt der Zwischendatensätze (102-1 bis 102-n) in dem Frequenzbereich basierend auf den jeweiligen Werten an diesem Frequenzpunkt aller Zwischendatensätze;Subtrahieren der berechneten Ensemblebasiswerte für jede Frequenz von den jeweiligen Werten der Zwischendatensätze, das zu einem entsprechenden basiswertzentrierten Spektrum (103-1 bis 103-n) für jeden Zwischendatensatz (102-1 bis 102-n) führt.
- System (100) nach Anspruch 10, wobei der Signaldetektor (140) zu Folgendem konfiguriert ist:Generieren eines Abweichungsspektrums aus den mehreren generierten basiswertzentrierten Spektren (103-1 bis 103-n) durch Berechnen der Standardabweichung für jeden Frequenzpunkt unter Berücksichtigung der jeweiligen Werte aller generierten basiswertzentrierten Spektren;Bestimmen eines Rauschwertes mit dem Rauschsignal, das einer Normalverteilung entspricht, durch Berechnen des Mittelwertes und der Standardabweichung für ein Nicht-Signalintervall in dem Abweichungsspektrum, wobei das Nicht-Signalintervall einem Frequenzintervall mit einer Normalverteilung entspricht;Multiplizieren des berechneten Rauschwertes mit einem vordefinierten Gewichtungsfaktor, wobei der Gewichtungsfaktor eine Schwellenwahrscheinlichkeit für Werte in dem Abweichungsspektrum bestimmt, die kleiner oder gleich dem gewichteten Rauschwert sind, um sich als Rauschwerte mit der Schwellenwahrscheinlichkeit zu qualifizieren; undBestimmen von Werten in dem Abweichungsspektrum, die höher als der gewichtete Rauschwert sind, als NMR-Signalkomponenten.
- System (100) nach Anspruch 10, wobei der Signaldetektor (140) zu Folgendem konfiguriert ist:Generieren einer Eigenraummatrix aus den mehreren generierten basiswertzentrierten Spektren (103-1 bis 103-n) durch Einschließen einer Zeile für jedes basiswertzentrierte Spektrum, wobei jede Spalte die Spektrumwerte für die jeweiligen Frequenzpunkte einschließt;Bestimmen der Absolutwerte des Produkts der ersten m Eigenvektoren und Eigenwerte der Matrix, wobei die Absolutwerte die durch die Systemfunktion herbeigeführten Variationen darstellen; undIdentifizieren der Absolutwerte, die größer als die jeweiligen gewichteten Rauschwerte sind, als NMR-Signalkomponenten.
- System (100) nach Anspruch 10, wobei der Signaldetektor (140) zu Folgendem konfiguriert ist:
Erfassen von Signalintervallen durch Verwenden einer iterativen Schwellenwertbildung, wenn die durch die Systemfunktion herbeigeführte Variation für jeden Frequenzpunkt aus den basiswertzentrierten Spektren (103-1 bis 103-n) extrahiert wird. - NMR-Spektrometer, das das System (100) nach einem der Ansprüche 10 bis 13 umfasst.
Priority Applications (3)
| Application Number | Priority Date | Filing Date | Title |
|---|---|---|---|
| EP18179985.9A EP3588120B1 (de) | 2018-06-26 | 2018-06-26 | System und verfahren zur verbesserten signaldetektion in der nmr-spektroskopie |
| US16/444,519 US10578694B2 (en) | 2018-06-26 | 2019-06-18 | System and method for improved signal detection in NMR spectroscopy |
| CN201910564525.0A CN110646757B (zh) | 2018-06-26 | 2019-06-26 | 用于nmr光谱学中的改进的信号检测的系统和方法 |
Applications Claiming Priority (1)
| Application Number | Priority Date | Filing Date | Title |
|---|---|---|---|
| EP18179985.9A EP3588120B1 (de) | 2018-06-26 | 2018-06-26 | System und verfahren zur verbesserten signaldetektion in der nmr-spektroskopie |
Publications (2)
| Publication Number | Publication Date |
|---|---|
| EP3588120A1 EP3588120A1 (de) | 2020-01-01 |
| EP3588120B1 true EP3588120B1 (de) | 2021-02-24 |
Family
ID=62791663
Family Applications (1)
| Application Number | Title | Priority Date | Filing Date |
|---|---|---|---|
| EP18179985.9A Active EP3588120B1 (de) | 2018-06-26 | 2018-06-26 | System und verfahren zur verbesserten signaldetektion in der nmr-spektroskopie |
Country Status (3)
| Country | Link |
|---|---|
| US (1) | US10578694B2 (de) |
| EP (1) | EP3588120B1 (de) |
| CN (1) | CN110646757B (de) |
Cited By (1)
| Publication number | Priority date | Publication date | Assignee | Title |
|---|---|---|---|---|
| DE102023110285B3 (de) | 2023-04-21 | 2024-05-08 | Universität zu Lübeck, Körperschaft des öffentlichen Rechts | Nmr-messung von glykoproteinen |
Families Citing this family (3)
| Publication number | Priority date | Publication date | Assignee | Title |
|---|---|---|---|---|
| EP3839546B1 (de) * | 2019-12-20 | 2025-01-29 | Bruker Switzerland AG | System und verfahren zur bereitstellung von trainingsdaten zur befähigung eines neuronalen netzwerks, signale in nmr-messungen zu identifizieren |
| CN116660198B (zh) * | 2023-08-02 | 2023-09-29 | 中珀(北京)新材料科技有限公司 | 基于光谱分析的碳纳米材料浆料性能测试方法 |
| CN119688617B (zh) * | 2025-02-27 | 2025-05-16 | 山西晋临检测科技股份有限公司 | 基于数据分析的水质智能监测方法、系统及装置 |
Family Cites Families (18)
| Publication number | Priority date | Publication date | Assignee | Title |
|---|---|---|---|---|
| US5121337A (en) * | 1990-10-15 | 1992-06-09 | Exxon Research And Engineering Company | Method for correcting spectral data for data due to the spectral measurement process itself and estimating unknown property and/or composition data of a sample using such method |
| JP3246130B2 (ja) * | 1993-09-30 | 2002-01-15 | 株式会社島津製作所 | Mrイメージング装置 |
| US6027941A (en) * | 1996-05-15 | 2000-02-22 | Curagen Corporation | Method for distance measurements with solid-state NMR |
| US7042214B2 (en) * | 2004-04-13 | 2006-05-09 | The Board Of Trustees Of The Leland Stanford Junior University | Non-linear symmetric sweep spectral-spatial RF pulses for MR spectroscopy |
| DE102005015069B4 (de) * | 2005-04-01 | 2008-03-27 | Siemens Ag | Verfahren zur Vermeidung linearer Phasenfehler in der Magnetresonanz-Spektroskopie |
| WO2008051857A2 (en) * | 2006-10-20 | 2008-05-02 | The Board Of Trustees Of The University Of Illinois | Nuclear magnetic resonance method for quantitative and qualitative measurement of natural products |
| WO2009102874A2 (en) * | 2008-02-12 | 2009-08-20 | The Research Foundation Of State University Of New York | Methods of using combined forward and backward sampling of nuclear magnetic resonance time domain for measurement of secondary phase shifts, detection of absorption mode signals devoid of dispersive components, and/or optimization of nuclear magnetic resonance experiments |
| US8761860B2 (en) * | 2009-10-14 | 2014-06-24 | Nocimed, Llc | MR spectroscopy system and method for diagnosing painful and non-painful intervertebral discs |
| JP5858716B2 (ja) * | 2010-10-19 | 2016-02-10 | 株式会社東芝 | 磁気共鳴イメージング装置 |
| JP5971677B2 (ja) * | 2010-11-26 | 2016-08-17 | 東芝メディカルシステムズ株式会社 | 磁気共鳴診断装置、および、磁気共鳴スペクトロスコピーのデータ収集方法 |
| US9880243B2 (en) * | 2011-06-20 | 2018-01-30 | Regents Of The University Of Minnesota | Sideband processing for magnetic resonance |
| US8965094B2 (en) * | 2012-04-14 | 2015-02-24 | Nocimed, Llc | Magnetic resonance spectroscopy pulse sequence, acquisition, and processing system and method |
| FR3000556B1 (fr) * | 2012-12-28 | 2016-03-25 | Univ Aix Marseille | Procede de correction de phase et/ou de frequence d’au moins un signal de decroissance libre d’induction (fid) |
| FR3015692B1 (fr) * | 2013-12-24 | 2017-03-03 | Univ Aix Marseille | Procede d'analyse par resonance magnetique nucleaire |
| JP5897227B1 (ja) * | 2014-06-11 | 2016-03-30 | オリンパス株式会社 | 医用診断装置、医用診断装置の作動方法および医用診断装置の作動プログラム |
| DE102014218560B4 (de) * | 2014-09-16 | 2016-04-07 | Siemens Aktiengesellschaft | Planung einer verzeichnungskorrigierten Magnetresonanz-Spektroskopiemessung |
| DE102015220322B4 (de) * | 2015-10-19 | 2020-02-13 | Bruker Biospin Gmbh | Verfahren und Vorrichtung zur automatisierbaren Ermittlung der Bestimmungsgrenze und des relativen Fehlers bei der Quantifizierung der Konzentration einer zu untersuchenden Substanz in einer Messprobe |
| EP3471608B1 (de) * | 2016-06-19 | 2023-08-23 | Aclarion, Inc. | Magnetresonanz-spektroskopiesystem und verfahren zur diagnose von schmerz oder infektionen im zusammenhang mit propionsäure |
-
2018
- 2018-06-26 EP EP18179985.9A patent/EP3588120B1/de active Active
-
2019
- 2019-06-18 US US16/444,519 patent/US10578694B2/en active Active
- 2019-06-26 CN CN201910564525.0A patent/CN110646757B/zh active Active
Non-Patent Citations (1)
| Title |
|---|
| BAZGIR OMID ET AL: "Fully Automatic Baseline Correction in Magnetic Resonance Spectroscopy", 2018 IEEE SOUTHWEST SYMPOSIUM ON IMAGE ANALYSIS AND INTERPRETATION (SSIAI), IEEE, 8 April 2018 (2018-04-08), pages 97 - 100, XP033406131, DOI: 10.1109/SSIAI.2018.8470319 * |
Cited By (2)
| Publication number | Priority date | Publication date | Assignee | Title |
|---|---|---|---|---|
| DE102023110285B3 (de) | 2023-04-21 | 2024-05-08 | Universität zu Lübeck, Körperschaft des öffentlichen Rechts | Nmr-messung von glykoproteinen |
| WO2024217637A1 (de) | 2023-04-21 | 2024-10-24 | Universität Zu Lübeck | Nmr-messung von glykoproteinen |
Also Published As
| Publication number | Publication date |
|---|---|
| US10578694B2 (en) | 2020-03-03 |
| US20190391219A1 (en) | 2019-12-26 |
| EP3588120A1 (de) | 2020-01-01 |
| CN110646757A (zh) | 2020-01-03 |
| CN110646757B (zh) | 2022-02-22 |
Similar Documents
| Publication | Publication Date | Title |
|---|---|---|
| US10578694B2 (en) | System and method for improved signal detection in NMR spectroscopy | |
| CN113009397B (zh) | 预配训练数据使神经网络识别nmr测量中信号的系统和方法 | |
| US9892600B2 (en) | ATM skimmer detection based upon incidental RF emissions | |
| Liu et al. | A fusion of principal component analysis and singular value decomposition based multivariate denoising algorithm for free induction decay transversal data | |
| KR101944429B1 (ko) | 주파수 분석 방법 및 이를 지원하는 장치 | |
| US20240151793A1 (en) | Systems and methods for provisioning training data to enable neural networks to analyze signals in nmr measurements | |
| CN104391325B (zh) | 不连续非均质地质体检测方法和装置 | |
| JP5394060B2 (ja) | 確率密度関数分離装置、確率密度関数分離方法、ノイズ分離装置、ノイズ分離方法、試験装置、試験方法、プログラム、及び記録媒体 | |
| US7865322B2 (en) | Relative noise | |
| Hayama et al. | Coherent network analysis for triggered gravitational wave burst searches | |
| CN111353526A (zh) | 一种图像匹配方法、装置以及相关设备 | |
| JP7018321B2 (ja) | スペクトル処理装置及び方法 | |
| Ye et al. | Localised high resolution spectral estimator for resolving superimposed peaks in NMR signals | |
| CN115859044B (zh) | 奇异谱分析和正交基方法结合的磁异常目标检测方法 | |
| CN116359201A (zh) | 一种药品鉴定方法、系统、存储介质和电子设备 | |
| Li et al. | SNR enhancement for downhole microseismic data based on scale classification shearlet transform | |
| Aouada et al. | Application of the bootstrap to source detection in nonuniform noise | |
| EP3869216B1 (de) | System und verfahren zur detektion einer strukturänderung eines moleküls oder seiner umgebung mit nmr-spektroskopie | |
| Glinchenko et al. | Increasing the reliability of spectral measurements of signal parameters at low signal-to-noise ratios | |
| Kocharovsky et al. | The Method of Periodic Principal Components for the Dynamic Spectrum of Radio Pulsars and Faraday Rotation of Nine Pulse Components of PSR B0329+ 54 | |
| CN118707290B (zh) | 芯片检测方法、装置、电子设备及存储介质 | |
| Bernardi | An automated data processing tool for Hyperpolarized Nuclear Magnetic Resonance: advancing precision medicine research. | |
| EP4375691A1 (de) | Gerät zur rekonstruktion eines magnetresonanzbildes basierend auf einem unterraum-abtastoperator | |
| Kronvall et al. | Detection of illegal narcotics using NQR | |
| CN118465425A (zh) | 一种电缆故障位置的估计方法 |
Legal Events
| Date | Code | Title | Description |
|---|---|---|---|
| PUAI | Public reference made under article 153(3) epc to a published international application that has entered the european phase |
Free format text: ORIGINAL CODE: 0009012 |
|
| STAA | Information on the status of an ep patent application or granted ep patent |
Free format text: STATUS: REQUEST FOR EXAMINATION WAS MADE |
|
| 17P | Request for examination filed |
Effective date: 20190430 |
|
| AK | Designated contracting states |
Kind code of ref document: A1 Designated state(s): AL AT BE BG CH CY CZ DE DK EE ES FI FR GB GR HR HU IE IS IT LI LT LU LV MC MK MT NL NO PL PT RO RS SE SI SK SM TR |
|
| AX | Request for extension of the european patent |
Extension state: BA ME |
|
| RBV | Designated contracting states (corrected) |
Designated state(s): AL AT BE BG CH CY CZ DE DK EE ES FI FR GB GR HR HU IE IS IT LI LT LU LV MC MK MT NL NO PL PT RO RS SE SI SK SM TR |
|
| GRAP | Despatch of communication of intention to grant a patent |
Free format text: ORIGINAL CODE: EPIDOSNIGR1 |
|
| STAA | Information on the status of an ep patent application or granted ep patent |
Free format text: STATUS: GRANT OF PATENT IS INTENDED |
|
| INTG | Intention to grant announced |
Effective date: 20201123 |
|
| GRAS | Grant fee paid |
Free format text: ORIGINAL CODE: EPIDOSNIGR3 |
|
| GRAA | (expected) grant |
Free format text: ORIGINAL CODE: 0009210 |
|
| STAA | Information on the status of an ep patent application or granted ep patent |
Free format text: STATUS: THE PATENT HAS BEEN GRANTED |
|
| AK | Designated contracting states |
Kind code of ref document: B1 Designated state(s): AL AT BE BG CH CY CZ DE DK EE ES FI FR GB GR HR HU IE IS IT LI LT LU LV MC MK MT NL NO PL PT RO RS SE SI SK SM TR |
|
| REG | Reference to a national code |
Ref country code: CH Ref legal event code: EP |
|
| REG | Reference to a national code |
Ref country code: DE Ref legal event code: R096 Ref document number: 602018012906 Country of ref document: DE |
|
| REG | Reference to a national code |
Ref country code: AT Ref legal event code: REF Ref document number: 1365164 Country of ref document: AT Kind code of ref document: T Effective date: 20210315 |
|
| REG | Reference to a national code |
Ref country code: IE Ref legal event code: FG4D |
|
| REG | Reference to a national code |
Ref country code: LT Ref legal event code: MG9D |
|
| REG | Reference to a national code |
Ref country code: NL Ref legal event code: MP Effective date: 20210224 |
|
| PG25 | Lapsed in a contracting state [announced via postgrant information from national office to epo] |
Ref country code: NO Free format text: LAPSE BECAUSE OF FAILURE TO SUBMIT A TRANSLATION OF THE DESCRIPTION OR TO PAY THE FEE WITHIN THE PRESCRIBED TIME-LIMIT Effective date: 20210524 Ref country code: PT Free format text: LAPSE BECAUSE OF FAILURE TO SUBMIT A TRANSLATION OF THE DESCRIPTION OR TO PAY THE FEE WITHIN THE PRESCRIBED TIME-LIMIT Effective date: 20210624 Ref country code: LT Free format text: LAPSE BECAUSE OF FAILURE TO SUBMIT A TRANSLATION OF THE DESCRIPTION OR TO PAY THE FEE WITHIN THE PRESCRIBED TIME-LIMIT Effective date: 20210224 Ref country code: HR Free format text: LAPSE BECAUSE OF FAILURE TO SUBMIT A TRANSLATION OF THE DESCRIPTION OR TO PAY THE FEE WITHIN THE PRESCRIBED TIME-LIMIT Effective date: 20210224 Ref country code: GR Free format text: LAPSE BECAUSE OF FAILURE TO SUBMIT A TRANSLATION OF THE DESCRIPTION OR TO PAY THE FEE WITHIN THE PRESCRIBED TIME-LIMIT Effective date: 20210525 Ref country code: FI Free format text: LAPSE BECAUSE OF FAILURE TO SUBMIT A TRANSLATION OF THE DESCRIPTION OR TO PAY THE FEE WITHIN THE PRESCRIBED TIME-LIMIT Effective date: 20210224 Ref country code: BG Free format text: LAPSE BECAUSE OF FAILURE TO SUBMIT A TRANSLATION OF THE DESCRIPTION OR TO PAY THE FEE WITHIN THE PRESCRIBED TIME-LIMIT Effective date: 20210524 |
|
| REG | Reference to a national code |
Ref country code: AT Ref legal event code: MK05 Ref document number: 1365164 Country of ref document: AT Kind code of ref document: T Effective date: 20210224 |
|
| PG25 | Lapsed in a contracting state [announced via postgrant information from national office to epo] |
Ref country code: RS Free format text: LAPSE BECAUSE OF FAILURE TO SUBMIT A TRANSLATION OF THE DESCRIPTION OR TO PAY THE FEE WITHIN THE PRESCRIBED TIME-LIMIT Effective date: 20210224 Ref country code: NL Free format text: LAPSE BECAUSE OF FAILURE TO SUBMIT A TRANSLATION OF THE DESCRIPTION OR TO PAY THE FEE WITHIN THE PRESCRIBED TIME-LIMIT Effective date: 20210224 Ref country code: LV Free format text: LAPSE BECAUSE OF FAILURE TO SUBMIT A TRANSLATION OF THE DESCRIPTION OR TO PAY THE FEE WITHIN THE PRESCRIBED TIME-LIMIT Effective date: 20210224 Ref country code: PL Free format text: LAPSE BECAUSE OF FAILURE TO SUBMIT A TRANSLATION OF THE DESCRIPTION OR TO PAY THE FEE WITHIN THE PRESCRIBED TIME-LIMIT Effective date: 20210224 Ref country code: SE Free format text: LAPSE BECAUSE OF FAILURE TO SUBMIT A TRANSLATION OF THE DESCRIPTION OR TO PAY THE FEE WITHIN THE PRESCRIBED TIME-LIMIT Effective date: 20210224 |
|
| PG25 | Lapsed in a contracting state [announced via postgrant information from national office to epo] |
Ref country code: IS Free format text: LAPSE BECAUSE OF FAILURE TO SUBMIT A TRANSLATION OF THE DESCRIPTION OR TO PAY THE FEE WITHIN THE PRESCRIBED TIME-LIMIT Effective date: 20210624 |
|
| PG25 | Lapsed in a contracting state [announced via postgrant information from national office to epo] |
Ref country code: CZ Free format text: LAPSE BECAUSE OF FAILURE TO SUBMIT A TRANSLATION OF THE DESCRIPTION OR TO PAY THE FEE WITHIN THE PRESCRIBED TIME-LIMIT Effective date: 20210224 Ref country code: EE Free format text: LAPSE BECAUSE OF FAILURE TO SUBMIT A TRANSLATION OF THE DESCRIPTION OR TO PAY THE FEE WITHIN THE PRESCRIBED TIME-LIMIT Effective date: 20210224 Ref country code: SM Free format text: LAPSE BECAUSE OF FAILURE TO SUBMIT A TRANSLATION OF THE DESCRIPTION OR TO PAY THE FEE WITHIN THE PRESCRIBED TIME-LIMIT Effective date: 20210224 Ref country code: AT Free format text: LAPSE BECAUSE OF FAILURE TO SUBMIT A TRANSLATION OF THE DESCRIPTION OR TO PAY THE FEE WITHIN THE PRESCRIBED TIME-LIMIT Effective date: 20210224 |
|
| REG | Reference to a national code |
Ref country code: DE Ref legal event code: R097 Ref document number: 602018012906 Country of ref document: DE |
|
| PG25 | Lapsed in a contracting state [announced via postgrant information from national office to epo] |
Ref country code: DK Free format text: LAPSE BECAUSE OF FAILURE TO SUBMIT A TRANSLATION OF THE DESCRIPTION OR TO PAY THE FEE WITHIN THE PRESCRIBED TIME-LIMIT Effective date: 20210224 Ref country code: SK Free format text: LAPSE BECAUSE OF FAILURE TO SUBMIT A TRANSLATION OF THE DESCRIPTION OR TO PAY THE FEE WITHIN THE PRESCRIBED TIME-LIMIT Effective date: 20210224 Ref country code: RO Free format text: LAPSE BECAUSE OF FAILURE TO SUBMIT A TRANSLATION OF THE DESCRIPTION OR TO PAY THE FEE WITHIN THE PRESCRIBED TIME-LIMIT Effective date: 20210224 |
|
| PLBE | No opposition filed within time limit |
Free format text: ORIGINAL CODE: 0009261 |
|
| STAA | Information on the status of an ep patent application or granted ep patent |
Free format text: STATUS: NO OPPOSITION FILED WITHIN TIME LIMIT |
|
| PG25 | Lapsed in a contracting state [announced via postgrant information from national office to epo] |
Ref country code: MC Free format text: LAPSE BECAUSE OF FAILURE TO SUBMIT A TRANSLATION OF THE DESCRIPTION OR TO PAY THE FEE WITHIN THE PRESCRIBED TIME-LIMIT Effective date: 20210224 Ref country code: AL Free format text: LAPSE BECAUSE OF FAILURE TO SUBMIT A TRANSLATION OF THE DESCRIPTION OR TO PAY THE FEE WITHIN THE PRESCRIBED TIME-LIMIT Effective date: 20210224 Ref country code: ES Free format text: LAPSE BECAUSE OF FAILURE TO SUBMIT A TRANSLATION OF THE DESCRIPTION OR TO PAY THE FEE WITHIN THE PRESCRIBED TIME-LIMIT Effective date: 20210224 |
|
| REG | Reference to a national code |
Ref country code: CH Ref legal event code: PL |
|
| 26N | No opposition filed |
Effective date: 20211125 |
|
| PG25 | Lapsed in a contracting state [announced via postgrant information from national office to epo] |
Ref country code: SI Free format text: LAPSE BECAUSE OF FAILURE TO SUBMIT A TRANSLATION OF THE DESCRIPTION OR TO PAY THE FEE WITHIN THE PRESCRIBED TIME-LIMIT Effective date: 20210224 |
|
| REG | Reference to a national code |
Ref country code: BE Ref legal event code: MM Effective date: 20210630 |
|
| PG25 | Lapsed in a contracting state [announced via postgrant information from national office to epo] |
Ref country code: LU Free format text: LAPSE BECAUSE OF NON-PAYMENT OF DUE FEES Effective date: 20210626 |
|
| PG25 | Lapsed in a contracting state [announced via postgrant information from national office to epo] |
Ref country code: LI Free format text: LAPSE BECAUSE OF NON-PAYMENT OF DUE FEES Effective date: 20210630 Ref country code: IT Free format text: LAPSE BECAUSE OF FAILURE TO SUBMIT A TRANSLATION OF THE DESCRIPTION OR TO PAY THE FEE WITHIN THE PRESCRIBED TIME-LIMIT Effective date: 20210224 Ref country code: IE Free format text: LAPSE BECAUSE OF NON-PAYMENT OF DUE FEES Effective date: 20210626 Ref country code: CH Free format text: LAPSE BECAUSE OF NON-PAYMENT OF DUE FEES Effective date: 20210630 |
|
| PG25 | Lapsed in a contracting state [announced via postgrant information from national office to epo] |
Ref country code: IS Free format text: LAPSE BECAUSE OF FAILURE TO SUBMIT A TRANSLATION OF THE DESCRIPTION OR TO PAY THE FEE WITHIN THE PRESCRIBED TIME-LIMIT Effective date: 20210624 |
|
| PG25 | Lapsed in a contracting state [announced via postgrant information from national office to epo] |
Ref country code: BE Free format text: LAPSE BECAUSE OF NON-PAYMENT OF DUE FEES Effective date: 20210630 |
|
| PG25 | Lapsed in a contracting state [announced via postgrant information from national office to epo] |
Ref country code: CY Free format text: LAPSE BECAUSE OF FAILURE TO SUBMIT A TRANSLATION OF THE DESCRIPTION OR TO PAY THE FEE WITHIN THE PRESCRIBED TIME-LIMIT Effective date: 20210224 |
|
| PG25 | Lapsed in a contracting state [announced via postgrant information from national office to epo] |
Ref country code: HU Free format text: LAPSE BECAUSE OF FAILURE TO SUBMIT A TRANSLATION OF THE DESCRIPTION OR TO PAY THE FEE WITHIN THE PRESCRIBED TIME-LIMIT; INVALID AB INITIO Effective date: 20180626 |
|
| P01 | Opt-out of the competence of the unified patent court (upc) registered |
Effective date: 20231030 |
|
| PG25 | Lapsed in a contracting state [announced via postgrant information from national office to epo] |
Ref country code: MK Free format text: LAPSE BECAUSE OF FAILURE TO SUBMIT A TRANSLATION OF THE DESCRIPTION OR TO PAY THE FEE WITHIN THE PRESCRIBED TIME-LIMIT Effective date: 20210224 |
|
| PG25 | Lapsed in a contracting state [announced via postgrant information from national office to epo] |
Ref country code: TR Free format text: LAPSE BECAUSE OF FAILURE TO SUBMIT A TRANSLATION OF THE DESCRIPTION OR TO PAY THE FEE WITHIN THE PRESCRIBED TIME-LIMIT Effective date: 20210224 |
|
| REG | Reference to a national code |
Ref country code: GB Ref legal event code: 732E Free format text: REGISTERED BETWEEN 20240829 AND 20240904 |
|
| PG25 | Lapsed in a contracting state [announced via postgrant information from national office to epo] |
Ref country code: MT Free format text: LAPSE BECAUSE OF FAILURE TO SUBMIT A TRANSLATION OF THE DESCRIPTION OR TO PAY THE FEE WITHIN THE PRESCRIBED TIME-LIMIT Effective date: 20210224 |
|
| REG | Reference to a national code |
Ref country code: DE Ref legal event code: R081 Ref document number: 602018012906 Country of ref document: DE Owner name: BRUKER BIOSPIN GMBH & CO. KG, DE Free format text: FORMER OWNER: BRUKER BIOSPIN GMBH, 76287 RHEINSTETTEN, DE |
|
| PGFP | Annual fee paid to national office [announced via postgrant information from national office to epo] |
Ref country code: DE Payment date: 20250618 Year of fee payment: 8 |
|
| PGFP | Annual fee paid to national office [announced via postgrant information from national office to epo] |
Ref country code: GB Payment date: 20250620 Year of fee payment: 8 |
|
| PGFP | Annual fee paid to national office [announced via postgrant information from national office to epo] |
Ref country code: FR Payment date: 20250618 Year of fee payment: 8 |