This application claims priority to singapore application No. 10201811546W filed on 21/12/2018, the contents of which are incorporated herein by reference in their entirety for all purposes.
Detailed Description
In a first aspect, the present invention relates to a method of identifying whether a patient suffering from cancer benefits from Immune Checkpoint Inhibition (ICI) therapy, comprising the steps of:
a) measuring the expression level of one or more preselected markers in a cancerous biological sample obtained from a patient;
b) identifying an alternative promoter for differential expression based on the expression level of the one or more preselected markers measured in step (a);
c) calculating a surrogate promoter utilization score;
d) the alternative promoters are used to identify whether a patient benefits from ICI therapy using a score.
One skilled in the art will generally appreciate that a cancerous biological sample may be a fresh, frozen, fixed, or preserved sample.
In one embodiment, a patient having cancer has received or is receiving ICI therapy. In a preferred embodiment, a patient with cancer has not received ICI therapy.
A cancerous biological sample may be taken from a patient diagnosed as having one or more cancers, which may include, but are not limited to, carcinomas, sarcomas, and melanomas. The biological sample may be a cell, tissue or fluid sample.
In some embodiments, a cancerous biological sample may be collected from a patient having one or more cancers including, but not limited to, adrenocortical carcinoma, urothelial carcinoma, breast invasive carcinoma, cervical squamous cell carcinoma and endocervical adenocarcinoma (endocervical adenocarinoccinoma), cholangiocarcinoma, colon adenocarcinoma, diffuse large B-cell lymphoma, esophageal carcinoma, glioblastoma multiforme, squamous cell carcinoma of the head and neck, renal chromophobe, renal clear cell carcinoma, renal papillary cell carcinoma, acute myeloid leukemia, brain low-grade glioma, hepatic hepatocellular carcinoma, lung adenocarcinoma, lung squamous cell carcinoma, mesothelioma, ovarian serous cystadenocarcinoma, pancreatic carcinoma, pheochromocytoma and paraganglioma, prostate carcinoma, rectal adenocarcinoma, sarcoma, cutaneous melanoma, gastric adenocarcinoma, testicular germ cell tumor, thyroid carcinoma, thymus carcinoma, endometrial carcinoma of the uterine body, uterine corpus carcinoma, uterine fibroid carcinoma, pancreatic carcinoma, squamous cell carcinoma of the head and neck, renal carcinoma, renal clear cell carcinoma, renal papillary cell carcinoma, acute myeloid leukemia, and thyroid carcinoma, Uterine carcinosarcoma, uveal melanoma, anal carcinoma, and combinations thereof.
In one embodiment, the cancer is a solid cancer. In another embodiment, the solid cancer is a gastrointestinal cancer. In yet another embodiment, the gastrointestinal cancer is gastric cancer. In yet another embodiment, the gastric cancer belongs to the Chromosome Instability (CIN) subtype and/or the Genome Stability (GS) subtype. In yet another embodiment, the gastric cancer is metastatic gastric cancer.
In some embodiments, the preselected marker is one or more nucleic acid molecules. The nucleic acid molecule may be DNA or RNA. In some embodiments, the nucleic acid molecule is selected from the group consisting of mRNA, cDNA, microrna, and genomic DNA. The preselected marker may be one or more genes or one or more transcripts. In some embodiments, the preselected marker is one or more peptides. In another embodiment, the peptide is a post-translationally modified peptide.
In one embodiment, the preselected marker is a marker associated with a somatic promoter region in a cancerous biological sample. In a preferred embodiment, the cancerous biological sample is a gastric cancer sample.
The expression level of one or more preselected markers in a cancerous biological sample described herein can be measured using a method selected from the group consisting of Whole Transcriptome Sequencing (WTS), Nanostring analysis, RNA sequencing, and combinations thereof.
It will be appreciated by those skilled in the art that the use of alternative promoters allows transcription to be initiated at different transcription initiation sites. Thus, the use of alternative promoters can affect gene expression in a variety of ways, including altering gene expression levels and/or resulting in the production of altered mRNA transcripts and protein isoforms.
In one embodiment, the alternative promoter of differential expression described herein is identified by comparing the expression level of one or more preselected markers in a cancerous biological sample to the expression level of the one or more preselected markers in one or more reference samples to determine an increase or decrease in the expression level of the preselected marker between the cancerous biological sample and the one or more reference samples. It will be appreciated by those skilled in the art that the preselected marker may be one or more genes, transcripts or peptides, the level of expression of which may be regulated by the promoter and thus indicative of the activity of the promoter.
Alternative promoters of differential expression can be determined by comparing the expression level of one or more preselected markers in a cancerous biological sample to the expression level of one or more preselected markers in one or more reference samples.
In one embodiment, for an acquired promoter, an increase in the expression level of one or more preselected markers in a cancerous biological sample as compared to the expression level of one or more preselected markers in one or more reference samples is indicative of a differentially expressed surrogate promoter.
In another embodiment, for a deleted promoter, a decreased expression level of one or more preselected markers in the cancerous biological sample as compared to the expression level of one or more preselected markers in one or more reference samples is an alternative promoter indicative of differential expression.
Alternative promoters that are differentially expressed can be identified in a variety of ways. In one embodiment, the differentially expressed alternative promoter described herein is identified from an acquired promoter that has a transcript expression level that is at least 4-fold greater than its median expression level in a set of tumor samples. In another embodiment, a differentially expressed alternative promoter described herein is identified from a deleted promoter whose transcript expression level is reduced by less than 0.25-fold or at least 4-fold of its median expression level in a set of tumor samples (4-fold reduction). In one embodiment, the median expression level of the transcript for each promoter is the median expression level of the promoters for all samples in a set of tumor samples.
In another embodiment, alternative promoters that are differentially expressed as described herein are identified from an acquired promoter having a relative promoter activity greater than the median promoter activity for a set of tumor samples. In another embodiment, alternative promoters that are differentially expressed as described herein are identified from deleted promoters having a relative promoter activity that is less than the median promoter activity for a set of tumor samples. In one embodiment, the median expression level of the transcript for each promoter is the median expression level of the promoters for all samples in a set of tumor samples.
In one embodiment, the acquired promoter is a promoter that is acquired or has enhanced activity in a cancerous biological sample as compared to a non-cancerous biological sample. The acquired promoter may be a promoter in a cancerous biological sample that is not present in a non-cancerous biological sample, or a promoter having enhanced promoter activity in a cancerous biological sample as compared to a promoter in a non-cancerous biological sample.
In another embodiment, the deleted promoter is a promoter that is deleted or reduced in activity in a cancerous biological sample as compared to a non-cancerous biological sample. The deleted promoter can be a promoter present in the non-cancerous biological sample but absent from the cancerous biological sample, or a promoter having reduced promoter activity in the cancerous biological sample as compared to the promoter in the non-cancerous biological sample.
After identifying the differentially expressed alternative promoters described herein, an alternative promoter utilization score is then calculated. In one embodiment, the alternative promoter utilization score may be an AP score. In another embodiment, the alternative promoter utilization score may be an APB score. The alternative promoter utilization score can be calculated by determining the sum of the differentially expressed alternative promoters described herein.
The surrogate promoter utilization score can be used in a method of identifying whether a patient with cancer benefits from ICI therapy. The method of identifying whether a patient having cancer benefits from ICI therapy may further comprise the step of comparing the alternative promoter usage score described herein to a reference score to identify whether the patient benefits from ICI therapy.
In one embodiment, the reference score is a score of the median, tertile, or quartile of the alternative promoter utilization score located in the one or more reference samples. In another embodiment, the reference score is a score at the 10 th, 20 th, 30 th, 40 th, 50 th, 60 th, 70 th, 80 th or 90 th percentile of the alternative promoter utilization scores in the one or more reference samples. In preferred embodiments, the reference score may be the score at the 66 th or 80 th percentile of the alternative promoter utilization scores located in the one or more reference samples.
In a preferred embodiment, the reference score is an absolute score. The absolute score is a fixed, non-variable score compared to the patient's surrogate promoter score.
In one embodiment, the increased alternative promoter usage score compared to the reference score identifies the patient as not benefiting from ICI therapy. In one embodiment, the increased alternative promoter usage score is a score that is higher than the 66 th percentile of the alternative promoter usage scores of the one or more reference samples. In another embodiment, the increased alternative promoter usage score is a score that is greater than the 80 th percentage of the alternative promoter usage score of the one or more reference samples.
In another embodiment, a reduced alternative promoter usage score as compared to a reference score identifies a patient as benefiting from ICI therapy. In one embodiment, the reduced alternative promoter usage score is a score that is lower than the 66 th percentile of the alternative promoter usage scores of the one or more reference samples. In one embodiment, the reduced alternative promoter usage score is a score that is less than the 80 th percentile of the alternative promoter usage scores of the one or more reference samples.
In one aspect, the invention provides a method of determining the prognosis of a patient undergoing or having undergone ICI therapy, the method comprising the steps of:
a) measuring the expression level of one or more preselected markers in a cancerous biological sample obtained from a patient;
b) identifying an alternative promoter for differential expression based on the expression level of the one or more preselected markers measured in step (a);
c) calculating a surrogate promoter utilization score;
d) the patient's prognosis is determined using the score using the surrogate promoter.
In one embodiment, the method of determining the prognosis of a patient receiving or having received an ICI therapy described herein further comprises the step of comparing the alternative promoter usage score described herein to a reference score to determine the prognosis of the patient, wherein an increased alternative promoter usage score compared to the reference score indicates a poorer prognosis.
In one embodiment, the increased alternative promoter usage score is a score that is higher than the 66 th percentile of the alternative promoter usage scores of the one or more reference samples. In another embodiment, the increased alternative promoter usage score is a score that is higher than the 80 th percentile of the alternative promoter usage scores of the one or more reference samples.
In another embodiment, the method of determining the prognosis of a patient receiving or having received an ICI therapy described herein further comprises the step of comparing the alternative promoter usage score described herein to a reference score to determine the prognosis of the patient, wherein a decreased alternative promoter usage score compared to the reference score indicates a better prognosis.
In one embodiment, the reduced alternative promoter usage score is a score that is lower than the 66 th percentile of the alternative promoter usage scores of the one or more reference samples. In another embodiment, the reduced alternative promoter usage score is a score that is less than the 80 th percentile of the alternative promoter usage scores of the one or more reference samples.
In another aspect, the invention provides a biomarker for excluding a patient with cancer from ICI therapy, wherein the biomarker is an alternative promoter usage score that is higher than the alternative promoter usage score of one or more reference samples, wherein the alternative promoter usage score is the sum of alternative promoters that are differentially expressed at each alternative promoter site.
In one embodiment, the invention provides a biomarker for excluding patients with cancer from ICI therapy, wherein the biomarker is an alternative promoter usage score that is above the 66 th percentile of the alternative promoter usage scores of one or more reference samples, wherein the alternative promoter usage score is the sum of the alternative promoters that are differentially expressed at each alternative promoter site.
In another embodiment, the invention provides a biomarker for selecting a patient with cancer for ICI therapy, wherein the biomarker is an alternative promoter usage score that is lower than the 66 th percentile of the alternative promoter usage scores of one or more reference samples, wherein the alternative promoter usage score is the sum of the alternative promoters that are differentially expressed at each alternative promoter site.
In another aspect, the invention provides a biomarker for excluding patients with cancer from ICI therapy, wherein the biomarker is an alternative promoter usage score that is above the 80 th percentile of the alternative promoter usage scores of one or more reference samples, wherein the alternative promoter usage score is the sum of the alternative promoters that are differentially expressed at each alternative promoter site.
In another embodiment, the invention provides a biomarker for selecting a patient with cancer for ICI therapy, wherein the biomarker is an alternative promoter usage score that is less than the 80 th percentile of the alternative promoter usage scores of one or more reference samples, wherein the alternative promoter usage score is the sum of the alternative promoters that are differentially expressed at each alternative promoter site.
The one or more reference samples may be selected from the group consisting of: one or more tumor samples obtained from one or more different patients, one or more non-cancerous samples obtained from the same patient, and combinations thereof. In one embodiment, the one or more non-cancerous samples obtained from the same patient are tissue in the vicinity of cancerous tissue. It will be appreciated by those skilled in the art that various combinations of these reference samples can be used in the methods of the invention.
In another aspect, the invention relates to a method of determining whether a patient having cancer should not be treated with Immune Checkpoint Inhibitor (ICI) therapy, the method comprising the steps of:
a) measuring the expression level of one or more preselected markers in a cancerous biological sample obtained from a patient;
b) identifying an alternative promoter for differential expression based on the expression level of the one or more preselected markers measured in step (a);
c) calculating a surrogate promoter utilization score;
d) identifying patients who do not benefit from ICI therapy using the surrogate promoter using a score;
e) treating the patient with an alternative therapy when the patient is determined not to benefit from ICI therapy.
In another aspect, the invention relates to a method of treating a patient having cancer, the method comprising the steps of:
a) measuring the expression level of one or more preselected markers in a cancerous biological sample obtained from a patient;
b) identifying an alternative promoter for differential expression based on the expression level of the one or more preselected markers measured in step (a);
c) calculating a surrogate promoter utilization score;
d) using the surrogate promoter to identify whether the patient benefits from ICI therapy using the score;
e) treating a patient identified as benefiting from ICI therapy according to step (d) with an immune checkpoint inhibitor, or treating a patient identified as not benefiting from ICI therapy according to step (d) with an alternative therapy.
In one embodiment, ICI therapy may include, but is not limited to, plepimecrumab, nivolumab, pembrolizumab, alemtuzumab (avelumab), dewarpizumab (durvalumab), cimiraprizumab (cemipimab), sellizumab (spartalizumab), trulizumab (sintilimab), carpriclizumab and tirlizumab.
In another embodiment, the replacement therapy is any therapy suitable for treating cancer in addition to ICI therapy. For example, replacement therapy may include chemotherapy, radiation therapy, stem cell transplantation, surgery, hormonal therapy, and targeted therapy. Targeted therapy involves the use of drugs that interfere with specific molecules required for tumor growth and progression. Replacement therapy may also include discontinuing ICI therapy in patients receiving ICI therapy.
The invention illustratively described herein suitably may be practiced in the absence of any element or elements, limitation or limitations which is not specifically disclosed herein. Thus, for example, the terms "comprising", "including", "containing", and the like are to be read broadly and not restrictively. Furthermore, the terms and expressions which have been employed herein are used as terms of description and not of limitation, and there is no intention, in the use of such terms and expressions, of excluding any equivalents of the features shown and described or portions thereof, but it is recognized that various modifications are possible within the scope of the invention claimed. Thus, it should be understood that although the present invention has been specifically disclosed by preferred embodiments and optional features, modification and variation of the inventions embodied therein herein disclosed may be resorted to by those skilled in the art, and that such modifications and variations are considered to be within the scope of this invention
The present invention has been described broadly and generically herein. Each of the narrower species and subgeneric groupings falling within the generic disclosure also form part of the invention. This includes the generic description of the invention with a proviso or negative limitation removing any subject matter from the genus, regardless of whether or not the text specifically recites such removed material.
Other embodiments are within the following claims and non-limiting examples. Further, if features or aspects of the invention are described in terms of Markush groups, those skilled in the art will recognize that the invention is also thereby described in terms of any individual member or subgroup of members of the Markush group.
Examples
Non-limiting examples of the present invention and comparative examples will be described in more detail with reference to specific examples, which should not be construed as limiting the scope of the present invention in any way.
Materials and methods
The study followed the REMARK criteria for validating tumor biomarkers.
Clinical cohort
Discovery queue
This cohort includes patients with continuous metastatic gastric cancer who received treatment with nivolumab or pembrolizumab at the korea seoul Samsung Medical Centre. ICI is administered as a remedial treatment in patients in whom at least one cytotoxic treatment regimen is ineffective. Nivolumab 3mg/kg was administered as a 1 hour infusion every 2 weeks, pembrolizumab 200mg was administered as an intravenous infusion every 3 weeks for 30 minutes until disease progression or unacceptable toxicity occurred. Ethical approval was obtained and written informed consent was provided by all patients prior to the collection of archived tumor tissue samples of primary tumors and prospective follow-up of survival data.
Pembrolizumab trial cohort
Patients enrolled in the study had histologically confirmed metastatic and/or recurrent gastric adenocarcinoma, and at least 1-line chemotherapy, including platinum/fluoropyrimidine, was ineffective in these patients. The test was performed according to the classification of Helsinki and the Guidelines for Good Clinical Practice (Clinical trials. gov identifier: NCT #02589496) (Helsinki Declaration and Good Clinical Practice Guidelines (Clinical trials. gov identifier: NCT # 02589496)). The protocol was approved by the Institutional Review Board of Samsung Medical Center (Korea) and all patients provided written informed consent prior to enrollment. Pembrolizumab 200mg was administered as an intravenous infusion at 30 minutes every 3 weeks until disease progression, unacceptable toxicity or up to 24 months was noted. Tumor response was assessed every two cycles according to RECIST1.1 criteria.
NanoString analysis
NanoString nCounter Reporter CodeSets were designed for 80 recurrent (recurrents) somatic cell-alternative promoter-associated genes as well as immune-associated genes corresponding to tumor cytolytic activity (CYT), cytokines and immune checkpoints. At least two probes were designed for each gene to measure expression of transcripts driven by canonical and alternative promoters. Canonical probes at the 5 'transcript, labeled with unaltered H3K4me3, and alternative probes at the 5' transcript of the somatic promoter. Data analysis was performed using nCounter software (nSolver) supplied by the supplier. Raw counts were normalized using the geometric mean of the internal positive control probes included in each CodeSet.
RNA sequencing
Tumor tissue was obtained between day-42 and day 1 prior to initiation of study treatment. If the tumor content after thorough pathological examination is estimated to exceed 40%, tumor DNA and RNA are extracted from freshly obtained tissue using the QIAamp Mini Kit (Qiagen, Hilden, Germany) according to the manufacturer's instructions. The concentration and 260/280 and 260/230nm ratio were measured using an ND1000 spectrophotometer (Nanodrop Technologies, Thermo-Fisher Scientific, MA, USA) and then the DNA/RNA was further quantified using a Qubit fluorometer (Life Technologies, CA, USA).
RNAnalysis of A transcriptome
The RNAseq data were aligned annotated with the gengene v19 transcript using TopHat and FPKM abundance measurements were generated using Cufflinks. Transcripts were then pooled in all samples and normalized using Cuffnorm. To analyze surrogate promoter-associated expression, RNAseq reads (reads) were mapped to genomic locations previously identified by epigenomic analysis. RNAseq mapped to these epigenomic defined promoter regions were then quantified and normalized by promoter length and library size. Finally, fold-changes in expression at each promoter site between the median expression levels for each tumor and all tumor samples were calculated.
PDL1 immunohistochemical analysis, MSI status, EBV status, TCGA subtyping, and tumor mutational burden were based on classification for the single agent pembrolizumab stage II study in metastatic gastric cancer.
Statistical analysis
Correlation of clinical pathology with histological subcategories was performed using Fisher's Exact Test. Progression Free Survival (PFS) was calculated from pembrolizumab first dose time to disease progression or time to death, and Overall Survival (OS) was calculated from pembrolizumab or nivolumab first dose time to death. Kaplan-Meier (KM) curves and log rank test were used for survival analysis. The risk ratio (HR) and its 95% Confidence Interval (CI) for each analysis were evaluated using a Cox proportional hazards regression model. All analyses were done using R (3.4.1). In the validation cohort, samples with alternative promoter utilization scores greater than the 66 th percentile were defined as high alternative promoter utilization (AP)high) The remaining samples were defined as low alternative promoter utilization (AP)low)。
PDL1 immunochemistry
PDL1 immunohistochemistry was performed using the Dako PD-L1 IHC 22C3 pharmDx kit (Agilent Technologies). PD-L1 protein expression was determined using CPS, which is the number of PD-L1 stained cells (tumor cells, lymphocytes, macrophages) divided by the total number of surviving tumor cells, multiplied by 100.
MSI status
Tumor tissue MSI status was determined by PCR analysis of both IHC of MLH1 and MSH2 and 5 markers with single nucleotide repeats.
EBV status subtype
EBV status was determined by EBV-encoded small RNA (EBER) in situ hybridization.
Tumor mutational burden
Mutation load was determined according to whole exome sequencing analysis. The mutation load of an individual is defined as the number of somatic non-synonymous SNVs that pass through all filters. Somatic mutations were annotated with a variant effect predictor. Mutation burden was calculated as the number of non-synonymous SNVs in tumor exome data. The ML-H threshold for an organization is set to a high tertile number.
TCGA subtype definition
The gastric cancer subtype defined by TCGA is based on DNA genomic alterations. These groups included EBV (+), MSI-H, CIN and genome-stable tumors, which lack CIN and are abundantly enriched in diffuse histological subtypes. With respect to representativeness of CIN (proxy), EBV (-), MSS tumors were classified as CIN and genomically stable according to their TP53 status. Mutation characterization was performed using the deconstructcsis software package (v1.6.0) in R.
Data set
Promoter activity was inferred from RNA-Seq data obtained from PanCanatlas of TCGA, which consisted of 10393 samples of 33 tumor types (9668 tumors and 725 normal samples).
APBscore algorithm
Initial epigenetic promoter alteration studies of gastric cancer identified 2732 individual cellular promoter regions (2053 acquired promoters, 679 deleted promoters), and transcriptome expression of these isoforms was used to create the APBscore algorithm.
For TCGA data, the priming subset was determined using genpole v19 annotation. Overlapping first exons of each TSS were combined to obtain a set of promoters. Ligation reads aligned with the first intron of the constitutive transcripts were then used to quantify the activity of each promoter. The total connection read count is then normalized across the entire dataset. The normalized read counts of log2 transformation were used for promoter activity in further downstream analyses. Gene expression estimates were obtained by summarizing the activity of each promoter for each gene. The activity of each promoter was then normalized by gene expression to obtain the relative promoter activity. In total 113,076 promoters were identified.
Then, from this group of 113,076 promoters, a somatic promoter region identified in gastric cancer was selected. 4672 promoters (3263 in the acquired region and 1409 in the deleted region) are located within the 2732 individual cell promoter region identified in gastric cancer. Of the 4672 promoters, the median relative promoter activity for each promoter was calculated for all tumor samples (n ═ 9668). For each sample, APBscore was calculated as the number of acquired promoters with relative promoter activity greater than the median and deleted promoters with relative promoter activity less than the median (fig. 1). Tumors were subdivided into APBs using APBscores at different percentile cut-offs (10 th, 20 th, 30 th 30 … … th, 90 th)highAnd APBlow. The 80 th percentile was determined as APBhighAnd APBlowThe ideal cut-off value for the set and used for further downstream analysis. Only normal samples were added to the analysis cohort related to normal tissue and not used to calculate median scores and cut-off values.
Immune related substance
The level of transcriptome expression of CD8A, GZMA, and PRF1, as well as the selection of 700 multiple genes, including immune checkpoints, markers for various immune cell types, genes and antigens associated with adaptive and innate immune responses, were selected and extracted from the TCGA dataset from the Broad GDAC firefose. The immune subtypes, other immune features and TMB were extracted from pan-cancer immune global (landscape) analysis. Progression Free Survival (PFS) and Overall Survival (OS), including censored data, were extracted from pan-cancer immunoglobal analysis.
Immune checkpoint inhibitor clinical data
Clinical trial data involving immune checkpoint inhibitors are rapidly expanding, where drugs are tested as single agents in combination with other therapies. Pembrolizumab is still an immune checkpoint inhibitor that has been tested in the broadest tumor types and reported clinical trial data. Therefore, a broad review of the literature was conducted on the single-agent pembrolizumab trial and the largest study reported for each tumor type was selected. The Objective Response Rate (ORR) of these tests was then correlated with the APBscore of each tumor type. TMB was extracted from pan-cancer immunoglobal analysis and PD-L1 transcriptional expression was extracted from Broad GDAC Firehose.
Statistical analysis
Wilcoxon rank sum test (Wilcoxon rank-sum test) for comparison of APBshighGroup and APBlowExpression levels of CD8A, GZMA, and PRF1 between groups. The "Rtsne" R software package is used to generate the T-SNE map. The Pearson test (Pearson test) was used for the correlation between APBscore and pembrolizumab ORR. Kaplan-Meier (KM) curves and log rank test were used for survival analysis. The risk ratio (HR) and its 95% Confidence Interval (CI) for each analysis were evaluated using a Cox proportional hazards regression model. Network mapping of the promoter gene function of somatic cells was performed using Reactome Pathway Database. All analyses were done using R (3.5.2).
Validation of estimation of promoter Activity Using RNA-Seq
The accuracy of the estimation of promoter activity using RNA-Seq was verified by benchmarking against other "gold standard" measures (e.g., H3K4me3ChIP-Seq and CAGE tag data available on public data sets). The H3K4me3 level was closely related to RNA-Seq promoter activity, indicating that epigenetic-based and transcript-based promoter activity was estimated to be consistent (Kruskal-Wallis p < 0.001). The CAGE-Tag data confirm this finding, while the unique promoter identified on RNA-Seq has higher CAGE-Tag support.
The algorithm was also compared to other bioinformatics methods used in RNA-Seq quantification and first exon read counting. The present algorithm produces results similar to these algorithms with a high correlation level (pearson correlation coefficient > 0.85). Overall, this analysis shows that our method enables quantitative, robust and reproducible estimation of promoter activity from RNA-Seq data.
Example 1: alternative promoter utilization in metastatic gastric cancer
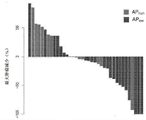
The first cohort consisted of 24 patients with metastatic gastric cancer (initially including 29 individuals with 24 tumor samples that were quality controlled to obtain sufficient tissue for Nanostring analysis) who received nivolumab and pembrolizumab therapy. A custom Nanostring panel (Nanostring panel) was used to measure transcripts associated with either canonical promoters or alternative promoters. A differentially expressed alternative promoter was defined as a promoter site whose expression level was shown relative to the median value of all samples<0.25 fold change (for a deleted somatic promoter) or>4 fold change (for the acquired somatic promoters). Using this algorithm, one third of the tumors (8/24) were found to be more than 10% localized (8/24)>8/80) shows high alternative promoter utilization. The group is defined as APhighAnd the rest are defined as APlow(FIG. 2A).
Measurement of cytolytic T cell activity has been previously described by studying the expression of CD8A (CD8+ tumor infiltrating lymphocytes), granzyme a (gzma), and perforin 1 (PRF 1). And APhighGroup comparison, APlowThe panel showed significant increases in expression of GZMA (P0.025), PRF1 (P0.011) and CD8A (P0.059), indicating a significant increase in APlowCytotoxic T cell activity was enhanced in the group (fig. 2B). These findings are consistent with the early results described in early gastric cancer, suggesting that alternative promoter utilization in metastatic gastric cancer is also negatively correlated with anti-tumor immunity. Notably, AP is of a non-experimental nature despite the small sample size of the cohort, the different treatment regimenshighTumor patients and APlowTumor patients tend to have a worse progression-free survival (PFS) than do patients (HR 1.9695% CI: 0.55-6 on day 129 versus 38993, P ═ 0.29, fig. 2C). Based on these findings, this hypothesis was further examined in a patient-individual cohort of uniform treatments.
Example 2: alternative promoter utilization as predictor of pembrolizumab treatment response and survival
For the second cohort, the transcriptome data of the phase II study described earlier was used. Transcriptome data from pre-treatment biopsy samples and matched clinical data were available for 37 individuals and for analysis. The median age was 57 years, 73% of males (N ═ 27), 4 (11%) EBV positive, 4 MSI (11%), and the rest defined as CIN or GS TCGA subtypes. Complete or partial response to treatment was observed in 11 individuals (30%). Use of the 2732 Individual cell alternative promoter site previously identified in gastric cancer [10]The definition of differentially expressed alternative promoters is similar to the first cohort (for known somatic deletion promoters,<0.25 fold change; or against known somatic cell-acquired promoters,>4 fold change). Notably, good agreement between the RNAseq and Nanostring platforms used to evaluate alternative promoter utilization has been shown previously. The sum of the differential expression sites in each sample was calculated to define an alternative promoter utilization score (fig. 3A). The scores ranged from 37-426 (median 136) (fig. 3B). Data-directed cut-off points, AP, using a first queuehighA group is defined as>66% percentile of samples (n-13), and APlowConstituting the remaining sample.
And APlowGroup comparison, APhighThe groups did not differ statistically significantly in the clinical pathology of age, gender or histological subtype. Neither group detected differences between TCGA subtype, mutation load and PDL1 CPS score (table 1). And APhighGroup comparison, APlowThe panel showed significant increases in expression of CD8A (P ═ 0.0037), GZMA (P ═ 0.0055), and PRF1(P ═ 0.016), indicating that AP was significantly increasedlowCytotoxic T cell activity in the group was enhanced (fig. 3C). Objective Response Rate (ORR), defined as the partial or complete response to treatment, at APlowIn group with APhighThe group-by-group ratio was higher (10/24 vs 1/13, P ═ 0.03) (fig. 3D). Notably, at the APhighIn the group, the only response was in MSI subtype tumors. AP (Access Point)highMedian progression-free survival (PFS) for the group was 55 days, while APlowThe group was 180 days (log P ═ 0.0076) (fig. 4A, 5B). AP (Access Point)lowPanel with 17% EBV (n ═ 4) and 12% MSI (n ═ 3) TCGA subtype samples, while APhighGroup had only 8% MSI samples (n ═ 1) and no EBV samples (fig. 4C). As shown previously, PFS differed between the various TCGA subtypes (P ═ 0.0026), and survival was significantly longer for MSI and EBV subtypes (491 days (MSI/EBV) compared to 80 days (CIN/GS)). Notably, of the CIN/GS subtypes, APlowAnd APhighPFS between groups also differed statistically significantly (48 days (CIN/GS AP)high) Compared with 161 days (CIN/GS AP)low) P ═ 0.0019) (fig. 4D). Based on the preliminary overall survival data, at the APlowA trend of improved survival was observed in the group (P ═ 0.16 for 340 days versus 292 days). Multivariate analysis of clinical pathology and alternative promoter utilization revealed that high alternative promoter utilization was an independent predictor of pembrolizumab PFS (HR 0.29, (95% CI 0.099-0.85), P ═ 0.024) (table 2).
TABLE 1.APhighAnd APlowCharacteristic differences between groups.
Fisher test
3 samples no tissue available for PDL1 CPS scoring by immunohistochemistry, all from APlowAnd (4) grouping.
TABLE 2 univariate and multivariate survival analysis
Example 3: alternative promoter usage evolution following pembrolizumab therapy
Paired biopsy samples were available for a second cohort of 8 individuals, which provided the opportunity to monitor tumor evolution as a result of ICI treatment pressure. Post-treatment biopsies were taken from primary gastric tumors at the point of pembrolizumab progression. Of these 8 subjects, two had Partial Response (PR) with response durations of 211 and 491 days (both APlow) One stable disease condition (SD) with a response duration of 167 days (AP)low) 5 Progressive Disease (PD) (AP)high N=3;APlowN-2) as the best response. Interestingly, based on clinical responses, very consistent changes were observed in the directionality of surrogate promoter utilization. In particular, tumors with PR and SD showed a 1.5-fold or higher increase in alternative promoter utilization score in post-treatment biopsy samples compared to pre-treatment biopsy samples, while all 5 tumors with PD showed a decrease in alternative promoter utilization score in post-treatment biopsy samples (fisher exact test, P ═ 0.018). These results further support the relationship between surrogate promoter global and ICI treatment pressure.
Example 4: alternative promoter utilization for multiple tumor types
To investigate whether these findings apply to other tumor types in addition to gastric cancer, the recently described algorithm was used to infer promoter activity for 10,393 samples (9668 tumors and 725 normal samples) of 33 tumor types in the PanCanAtlas RNA-seq database (table 3). Briefly, a set of 113,076 possible promoters was compiled using the Gencode (19 th edition) annotation. Assuming that isoforms with the same or very close TSS are regulated by the same promoter, promoter activity is inferred by quantifying expression starting at each promoter using unique ligation reads.
TABLE 3 TCGA cohort description and sample size
| Tumor type
|
TCGA code
|
Tumor sample (n)
|
Normal sample (n)
|
Tumor + Normal (n)
|
| Adrenocortical carcinoma
|
ACC
|
79
|
0
|
79
|
| Urothelial carcinoma of bladder
|
BLCA
|
405
|
19
|
424
|
| Invasive carcinoma of breast
|
BRCA
|
1095
|
112
|
1207
|
| Squamous cell carcinoma of cervix and adenocarcinoma of cervix
|
CESC
|
306
|
3
|
309
|
| Bile duct cancer
|
CHOL
|
36
|
9
|
45
|
| Adenocarcinoma of colon
|
COAD
|
281
|
41
|
322
|
| Diffuse large B cell lymphoma
|
DLBC
|
48
|
0
|
48
|
| Esophageal cancer
|
ESCA
|
185
|
11
|
196
|
| Glioblastoma multiforme
|
GBM
|
165
|
5
|
170
|
| Squamous cell carcinoma of head and neck
|
HNSC
|
504
|
44
|
548
|
| Renal chromophobe cell
|
KICH
|
66
|
25
|
91
|
| Clear cell carcinoma of kidney and kidney
|
KIRC
|
530
|
72
|
602
|
| Papillary cell carcinoma of kidney and kidney
|
KIRP
|
291
|
32
|
323
|
| Acute myeloid leukemia
|
LAML
|
171
|
0
|
171
|
| Brain low grade glioma
|
LGG
|
528
|
0
|
528
|
| Liver hepatocellular carcinoma
|
LIHC
|
373
|
50
|
423
|
| Adenocarcinoma of lung
|
LUAD
|
506
|
59
|
565
|
| Squamous cell carcinoma of lung
|
LUSC
|
500
|
51
|
551
|
| Mesothelioma
|
MESO
|
87
|
0
|
87
|
| Ovarian serous cystadenocarcinoma
|
OV
|
307
|
0
|
307
|
| Pancreatic cancer
|
PAAD
|
179
|
4
|
183
|
| Pheochromocytoma and paraganglioma
|
PCPG
|
184
|
3
|
187
|
| Prostate cancer
|
PRAD
|
498
|
52
|
550
|
| Adenocarcinoma of rectum
|
READ
|
95
|
10
|
105
|
| Sarcoma
|
SARC
|
263
|
2
|
265
|
| Melanoma of skin
|
SKCM
|
472
|
1
|
473
|
| Gastric adenocarcinoma
|
STAD
|
415
|
35
|
450
|
| Testicular germ cell tumors
|
TGCT
|
156
|
0
|
156
|
| Thyroid cancer
|
THCA
|
509
|
59
|
568
|
| Thymoma
|
THYM
|
120
|
2
|
122
|
| Endometrial cancer of uterus
|
UCEC
|
177
|
24
|
201
|
| Sarcoma of uterine cancer
|
UCS
|
57
|
0
|
57
|
| Uveal melanoma
|
UVM
|
80
|
0
|
80
|
| Combination of
|
|
9668
|
725
|
10393 |
Of the 113,076 promoters, 4672 promoters mapped to 2732 tumor-associated promoter regions previously defined in gastric cancer. It is hypothesized that alterations in this set of promoters may represent a generalized tumor response to host immune recognition, not limited to gastric cancer. To validate this hypothesis, the APB level (APBscore) was calculated for each tumor using 4672 promoters (fig. 5). As shown in figure 1, a wide range of APBscore was observed both within and between tumor types. The median APBscore of the entire queue was 178 (range: 46-241). The lowest tumor types for the median APBscore included thyroid cancer (THCA) (median 165, range: 54-207), diffuse large B-cell lymphoma (DLBC) (median 166, range: 108-. In contrast, median APBcore was highest for Glioblastoma (GBM) (median: 207, range: 172-241), low-grade glioma (LGG) (median: 204, range: 130-230) and Testicular Germ Cell Tumor (TGCT) (median: 189, range: 83-218).
Tumor APBscore is associated with a marker of T cell cytolytic activity: CD8A, GZMA, and PRF 1. Similar to other pan-cancerous TCGA studies, a major analysis was performed on the entire TCGA sample cohort that was tumor-type agnostic, but also provided tumor-type specific results. Previously, it was observed that bisection of tumors at median or highest tertile resulted in significant correlations with CD8A, GZMA, and PRF 1. However, since these studies were done with smaller sample sizes, they were chosen to re-establish the ideal cut-off for dichotomized tumors for correlation with these three genes. Thus, the APBscore threshold was tested at different percentiles (10 th, 20 th, 30 th 30 … … th, 90 th) to divide the APB by twohighGroup and APBlowAnd (4) grouping. For the entire cohort (all tumor types), at all nine cut-off values of the dichotomy, with APBlowTumor contrast, APBhighTumor levels of CD8A, GZMA and PRF1 were significantly lower (p)<0.0001) (fig. 6A). The 80 th percentile was found to be most correlated with these three genes, with 19 of the 33 tumor types being significantly correlated with CD8A, GZMA and PRF 1. For subsequent analysis, tumors were bisected into APBs at the 80 th percentile of the overall cohort (APBscore cut-off: 190)highGroup and APBlowAnd (4) grouping. Importantly, even if different techniques were used to interrogate alternative promoters, previouslyThe findings in gastric cancer (STAD) were also strongly replicated in this assay (FIG. 6B). To address potential confusion of tumor types, tumor type-specific analyses were also performed in which each tumor type was subdivided into APBs at the median APBscore for that particular tumor typehighGroup sum APBlowAnd (4) grouping. There was a significant association with CD8A, GZMA, and PRF1 for 20 of 33 tumor types. There was no significant correlation between 8 tumor types at any cutoff: renal chromoplast cells (KICH), DLBC, thymoma and thymus carcinoma (THYM), renal cell carcinoma (KIRC), acute myeloid leukemia (LAML), Cholangiocarcinoma (CHOL), Uterine Carcinosarcoma (UCS), pheochromocytoma, and paraganglioma (PCPG). Of these 8, the sample size of CHOL, KICH and UCS was relatively small (n)<100) While DLBC, THYM, LAML are of hematological/immunological origin.
Notably, if all 113,076 established promoters were used or according to the replacement test (experience p) compared to the set of 4672 promoters originally defined in gastric cancer for the definition of APBscore<0.001) and the like, and no similar strength of correlation with CD8A/GZMA/PRF1 expression was observed. This observation supports the hypothesis that although APBscore was originally derived from gastric cancer, the APBscore algorithm can be applied to a variety of tumor types, which may reflect a conserved pan-cancerous response to host immunity. To investigate the specific function of tumor-associated promoter isoforms, 570 promoters (12% of 4672 promoters) that are up-regulated in at least 100 tumors (about 1% of the 9668 tumor cohort) were analyzed. Different tumor types utilize specific promoter isotype clusters, and network analysis of gene function reveals that alternative promoters affect genes with different roles. This may indicate that, on a genome-wide basis, the selection of alternative promoters in tumors may be driven less by intrinsic gene function and more by extrinsic selection pressure (e.g., host anti-tumor immunity). Tumor APBscore was also compared to non-malignant tissue. Of the 725 matched normal tissue samples analyzed by PanCanatlas, only 5% (n-36 normal samples) were classified as APBhigh(cut off at the 80 th percentileAt value). When normal and tumor samples are clustered by alternating promoters, normal samples cluster to close to but different from their corresponding tumor types. Of 15 of the 16 tumor types with at least 10 normal samples, tumor samples are more likely to be classified as APBs than normal sampleshigh(Fisher exact, p<0.001)。
Example 5: alternative promoter utilization between tumor and normal samples
To further explore the interaction between alternative promoter utilization and tumor immunity, the analysis extended to study the relationship between APBscore and a broad range of approximately 700 immune-related genes encompassing a variety of immune cell types, immune checkpoints and antigens. With APB
highCompared to tumors, most of these genes (78%) were in APB
lowSignificantly higher expression was shown in tumors (FIG. 7), indicating APB
highTumors have an immunodepleted phenotype. Differential expression analysis of all approximately 20,000 genes available in PanCanatlas confirmed that APB
highDownregulation of genes in subgroups was restricted to immune genes (fig. 8A). In a global study of pan-cancer immunity using TGCA samples, tumors were classified into six immune subtypes, characterized by distinct immunological features-wound healing,
Dominant, inflammatory, lymphocyte depletion, quiet immunity and TGF-beta dominant. When APBscore is associated with these immune subtypes, it was found that the lymphocyte-depleted or immune-quiescent subtype is more likely to be APB
highTumor (Fisher exact p)<0.0001) (fig. 8B). Notably, lymphocyte-depleted APB
highTumors comprise multiple tumor subtypes, while immunocompromised APBs
highTumors were predominantly dominated by LGG. In contrast to this, the present invention is,
the subtype and inflammatory subtype are more likely to be APB
lowTumor (Fisher exact p)<0.0001) (fig. 8B), and APB
lowTumors are also more likely to have a higher lymphocyte infiltration characteristic score and
response characteristic (p)<0.0001, wilcoxon test) (fig. 9, fig. 10). Importantly, APBscore was independent of TMB levels (r 0.02, p 0.02), suggesting that different processes drive alternative promoter utilization and acquisition of DNA somatic mutations.
Example 6: alternative promoter utilization and survival results
The association between APBscore and Progression Free Survival (PFS) and Overall Survival (OS) data obtained from TCGA Pan-Cancer analysis was studied. To avoid confusion at the pan-cancerous level, where survival outcomes may be affected by intrinsic tissue or site-specific properties, individual tumor type-specific analyses were performed. Most tumor types did not show any correlation between APBscore and PFS or OS when analyzed at the tumor type-specific level. Only a few tumor types showed survival differences between the APB groups (KIRC, LGG, LUAD, THYM). Multivariate analysis of APBscore and disease subtypes also suggests that APBscore is not an independent prognostic predictor of survival in patients not receiving ICI therapy.
Example 7: alternative promoter utilization and pembrolizumab resistance
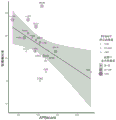
To test APBhighWhether tumors were more resistant to ICI as previously shown in metastatic gastric cancer was quantified by the association of APBscore with pembrolizumab Objective Response Rate (ORR) reported in an independent study. In all tumor types, a significant negative correlation between ORR and APBscore was observed (Pearson R (Pearson's R) — 0.46, p ═ 0.025). No similar correlation was observed for CD8A (r ═ 0.18, p ═ 0.4), GZMA (r ═ 0.17, p ═ 0.4) or PRF1(r ═ 0.3, p ═ 0.1). Consistent with previous studies, a positive association was observed for TMB (r 0.53, p 0.0078) and PD-L1 expression (r 0.42, r 0.042). Thus, these results indicate that APBscore and TMB may be complementary in determining different tumor subsets, with TMB selecting the type with better ICI response, while APBscore determines those types that lack response because APBscore and TMB are not related. Interestingly, when selecting onlyWhen tumor types showing significant APBscore association with CD8A, GZMA and PRF1 were selected for analysis (19 tumor types), the association between APBscore and ORR increased in both intensity and significance: pearson R ═ 0.55, p ═ 0.019 (fig. 11). Taken together, these results extend the findings previously shown in gastric cancer and establish a pan-cancerous relationship between APBscore and pembrolizumab resistance.
Equivalents of
The above-described embodiments are presented for the purpose of illustrating the invention and should not be construed as imposing any limitation on the scope of the invention. It will be evident that various modifications and changes may be made to the specific embodiments of the invention described above and illustrated in the examples without departing from the underlying principles thereof. All such modifications and variations are intended to be covered by this application.