Disclosure of Invention
In order to overcome the defects in the prior art, the invention aims to provide a sliding window-based high-frequency acquisition abnormity-resistant electric energy meter accurate positioning method.
The technical purpose of the invention is realized by the following technical scheme: the sliding window based high-frequency acquisition abnormity resistant electric energy meter accurate positioning method comprises the following steps:
setting a sliding window n and a sliding interval T according to input parameters;
synchronously acquiring the electric quantity or current data of all the sub-meters and the general meter according to the number of the preset samples;
establishing an error calculation model based on an energy conservation principle according to the collected electric quantity data, or establishing an error calculation model based on a current balance principle according to the collected current data, and calculating according to the error calculation model to obtain an error estimation result of the collected sample data;
after the error calculation model is subjected to iterative updating, error estimation results are recalculated to obtain an estimation error vector consisting of a plurality of error estimation results, and the iterative updating times of the error calculation model are recorded;
judging whether the estimated error vector meets the reliability confirmation requirement or not according to the sliding window n, the sliding interval T and the iteration updating times; if not, continuing to calculate the error estimation result; if yes, calculating a reliability value of the estimation error vector; when the reliability value is smaller than a set threshold value, judging that the error calculation model is in a stable state; otherwise, the state is in a dynamic state;
and acquiring a first error estimation result of the last group of the error calculation model entering the dynamic state and being in a stable state and a second error estimation result of the corresponding error calculation model exiting the dynamic state and initially being in the stable state, calculating abnormal difference values of all the electric energy meters according to the first error estimation result and the second error estimation result, and judging that the corresponding electric energy meters are in an abnormal state when the abnormal difference values are greater than a preset abnormal threshold value.
Further, the setting of the sliding window n and the sliding interval T specifically includes:
the numerical value of the sliding window n is equal to the total number of all the sub-tables in the calculation range;
the sliding interval T is a positive integer between 1-n, including 1 and n.
Further, the value m of the preset sample number is not less than the total number of all the sub-tables.
Further, the value m of the preset number of sample strips is not less than 1.5 times of the total number of all the sub-tables.
Further, the synchronous acquisition process of the sample data specifically comprises: and collecting instantaneous current or electric quantity data of all the electric energy meters at the same time.
Further, the sample data specifically includes:
[x1j,x2j,x3j,Λxnj,yj]
wherein x isnjThe current instantaneous value or electric quantity collected by the nth partial table at the j-th collection is represented; y isjRepresenting the current transient or charge collected at the j-th collection of the summary table.
Further, the calculation formula of the error calculation model is as follows:
An*nXn*1=bn*1
An*ncoefficient matrix representing n x n, An*nThe expression of (a) is as follows:
bn*1constant matrix representing n x 1, bn*1The expression of (a) is as follows:
Xn*1error matrix, X, representing n X1n*1The expression of (a) is as follows:
wherein epsilonnkRepresenting the estimation error of the nth division table calculated at the kth time; the error estimation result consists of the estimation errors of all the sub-tables.
Further, the iterative update of the error calculation model specifically comprises the following steps:
when a group of new sample data is collected, discarding the group of sample data farthest from the current time to obtain the sample data with the same quantity and new composition;
and reconstructing the coefficient matrix A and the constant matrix b according to the newly formed sample data, and then finishing the iterative updating of the error calculation model.
Further, the specific process of determining whether the estimated error vector meets the reliability validation requirement is as follows:
judging whether the number k of times of updating the modulo iteration is greater than a sliding window n and whether the difference between the number of times of iteration and the last estimated error vector judgment is greater than or equal to a sliding interval T;
and if the iteration updating times k and the difference between the iteration times meet the requirement, determining that the estimated error vector meets the reliability confirmation requirement.
Further, the calculation process of the confidence value specifically includes:
establishing an estimated error vector according to an error estimation result:
εk=[ε1k,ε2k,ε3k,Λεnk,]
wherein epsilonkRepresenting the vector formed by all the sub-table estimation errors calculated at the kth time;
establishing an estimation error matrix according to estimation error vectors obtained by multiple calculations, updating epsilon once every time an error calculation model is calculated, and newly adding a vector:
wherein ε represents the estimation error matrix;
the transpose of the vector formed by all the sub-table estimation errors in the k-th calculation is represented;
selecting the latest n elements from the estimated error matrix to establish an error judgment set epsilonupdate:
Calculating epsilonupdateThe cumulative sum of the similarity of two adjacent vectors is calculated by the following formula:
dt=||εupdate[t]-εupdate[t+1]||2,t=1,2,3...n-1;
D={d1 d2...dn-1}
wherein epsilonupdate[t]Represents a set of difference decisions epsilonupdateThe t-th element in (1); dtA cumulative sum representing the similarity of two adjacent vectors; d represents a set consisting of a plurality of accumulated sums;
calculating the variance value of the elements in the set D to obtain a reliability value; when the reliability value is smaller than a set threshold value, judging that the error calculation model is in a stable state, and determining that the calculation result is reliable; otherwise, the calculation result is in a dynamic state and is not credible.
Compared with the prior art, the invention has the following beneficial effects: the sliding window-based high-frequency acquisition abnormity-resistant electric energy meter accurate positioning method can realize accurate measurement of model estimation error reliability, can effectively improve false alarm and missing report of a system, and improves accuracy of a model output result.
Detailed Description
In order to make the objects, technical solutions and advantages of the present invention more apparent, the present invention is further described in detail below with reference to examples and accompanying drawings, and the exemplary embodiments and descriptions thereof are only used for explaining the present invention and are not meant to limit the present invention.
Example 1: the sliding window based high-frequency acquisition abnormity resistant electric energy meter accurate positioning method is specifically realized by the following steps.
The method comprises the following steps: and setting the sliding window n and the sliding interval T according to the input parameters. The numerical value of the sliding window n is equal to the total number of all the sub-tables in the calculation range; the sliding interval T is a positive integer between 1 and n, including 1 and n, and is generally 1.
Step two: and synchronously acquiring the electric quantity or current data of all the sub-meters and the general meter according to the number of the preset samples. The number m of the preset sample strips is not less than the total number n of all the branch tables. As a preferred embodiment, the number m of the preset number of sample pieces is not less than 1.5 times the total number of all the partial tables.
It should be noted that the synchronous collection is to collect instantaneous current or electric quantity data of all the electric energy meters at the same time. And the specific expression of the collected sample data is as follows: [ x ] of1j,x2j,x3j,Λxnj,yj](ii) a Wherein x isnjThe current instantaneous value or electric quantity collected by the nth partial table at the j-th collection is represented; y isjRepresenting the current transient or charge collected at the j-th collection of the summary table. In addition, the collected sample data can only select to collect electric quantity, and can also select to only collect instantaneous current, but once the sample data is determined, the sample data is not changed.
Step three: establishing an error calculation model based on an energy conservation principle according to the collected electric quantity data, or establishing an error calculation model based on a current balance principle according to the collected current data, and calculating according to the error calculation model to obtain an error estimation result of the collected sample data;
step four: and after the error calculation model is subjected to iterative updating, recalculating the error estimation result to obtain an estimation error vector consisting of a plurality of error estimation results, and recording the iterative updating times of the error calculation model.
(1) The calculation formula of the error calculation model is as follows:
An*nXn*1=bn*1
An*ncoefficient matrix representing n x n, An*nThe expression of (a) is as follows:
bn*1constant matrix representing n x 1, bn*1The expression of (a) is as follows:
Xn*1error matrix, X, representing n X1n*1The expression of (a) is as follows:
wherein epsilonnkRepresenting the estimation error of the nth division table calculated at the kth time; error estimationThe result of the calculation consists of the estimation errors of all the sub-tables.
(2) The iterative updating process of the error calculation model comprises the following specific steps:
when a group of new sample data is collected, discarding the group of sample data farthest from the current time to obtain the new sample data with equal quantity. And reconstructing the coefficient matrix A and the constant matrix b according to the newly formed sample data, and then finishing the iterative updating of the error calculation model.
For example, the coefficient matrix, the constant matrix, and the error matrix are established by performing the k-th calculation at time t 0. Then, based on the sample data acquired at the time t1, the coefficient matrix a and the constant term b are updated, and the updated coefficient matrix a, the updated constant term b, and the updated error matrix are respectively:
step five: judging whether the estimated error vector meets the reliability confirmation requirement or not according to the sliding window n, the sliding interval T and the iteration updating times; if not, continuing to calculate the error estimation result; if yes, calculating a reliability value of the estimation error vector; when the reliability value is smaller than a set threshold value, judging that the error calculation model is in a stable state; otherwise, the dynamic state is set.
The specific process for judging whether the estimated error vector meets the reliability confirmation requirement is as follows: judging whether the number k of times of updating the modulo iteration is greater than a sliding window n and whether the difference between the number of times of iteration and the last estimated error vector judgment is greater than or equal to a sliding interval T; and if the iteration updating times k and the difference between the iteration times meet the requirement, determining that the estimated error vector meets the reliability confirmation requirement.
The calculation process of the credibility value is realized by the following steps.
S1, establishing an estimation error vector according to the error estimation result:
εk=[ε1k,ε2k,ε3k,Λεnk,]
wherein epsilonkRepresents the vector consisting of all the sub-table estimation errors calculated at the k-th time. The updated estimated error vector corresponding to time t1 is: epsilonk+1=[ε1(k+1),ε2(k+1),ε3(k+1),Λεn(k+1),]。
S2, establishing an estimation error matrix according to the estimation error vectors obtained by multiple calculations, and updating epsilon once every time the error calculation model is calculated, and newly adding a vector:
wherein ε represents the estimation error matrix;
representing the transpose of the vector consisting of all the sub-table estimation errors calculated the k-th time.
The updating method of epsilon specifically comprises the following steps:
s201: in the initial case, ε is null;
s202: the model completes the first calculation, then
S203: the model completes the second calculation, then
S204: the model completes the third calculation, then
S205: the model completes the k-th calculation, then
S206: and so on to update epsilon.
S3, selecting the latest n elements from the estimation error matrix to establish errorsSet of difference decisions εupdate:
S4, calculating epsilonupdateThe cumulative sum of the similarity of two adjacent vectors is calculated by the following formula:
dt=||εupdate[t]-εupdate[t+1]||2,t=1,2,3...n-1;
D={d1 d2...dn-1}
wherein epsilonupdate[t]Represents a set of difference decisions epsilonupdateThe t-th element in (1); dtA cumulative sum representing the similarity of two adjacent vectors; d denotes a set consisting of a plurality of accumulated sums.
S5, calculating the variance value of the elements in the set D to obtain a reliability value; when the reliability value is smaller than a set threshold value, judging that the error calculation model is in a stable state, and determining that the calculation result is reliable; otherwise, the calculation result is in a dynamic state and is not credible.
Step six: and acquiring a first error estimation result of the last group of the error calculation model entering the dynamic state and being in a stable state and a second error estimation result of the corresponding error calculation model exiting the dynamic state and initially being in the stable state, calculating abnormal difference values of all the electric energy meters according to the first error estimation result and the second error estimation result, and judging that the corresponding electric energy meters are in an abnormal state when the abnormal difference values are greater than a preset abnormal threshold value.
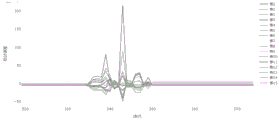
Example 2: assuming that 16 users exist in a certain area, the error of the electric energy meter 5 is suddenly changed in the 350 th sampling period (corresponding to the 350 th-16 th iterative calculation period), and the error is changed from-5.23% to + 2.40%; the table area general table has no error and no line loss. The estimation error curves for each meter are shown in fig. 1.
From fig. 1, it can be seen that before the 350 th sampling period, i.e. the 334 th iterative computation period, the error curves of the respective meters are very smooth and substantially consistent, but after the 350 th sampling period, i.e. the 334 th iterative computation period, the mean square error of all meters greatly fluctuates, but after the 16 th iterative computation period, the computation results are again stable.
By locally enlarging the 30-time moving average curve, we can clearly find that the error variation of table 5 is correctly judged by the model, as shown in fig. 2. It should be noted that, since fig. 2 is the 30-day moving average of fig. 1, the duration of the dynamic process shown in fig. 2 is superimposed on the duration of fig. 1 by 30 calculation cycles, that is, the end iteration time of the dynamic process of fig. 1 is 350, and the end iteration time of the dynamic process of fig. 2 is 380.
As will be appreciated by one skilled in the art, embodiments of the present application may be provided as a method, system, or computer program product. Accordingly, the present application may take the form of an entirely hardware embodiment, an entirely software embodiment or an embodiment combining software and hardware aspects. Furthermore, the present application may take the form of a computer program product embodied on one or more computer-usable storage media (including, but not limited to, disk storage, CD-ROM, optical storage, and the like) having computer-usable program code embodied therein.
The present application is described with reference to flowchart illustrations and/or block diagrams of methods, apparatus (systems), and computer program products according to embodiments of the application. It will be understood that each flow and/or block of the flow diagrams and/or block diagrams, and combinations of flows and/or blocks in the flow diagrams and/or block diagrams, can be implemented by computer program instructions. These computer program instructions may be provided to a processor of a general purpose computer, special purpose computer, embedded processor, or other programmable data processing apparatus to produce a machine, such that the instructions, which execute via the processor of the computer or other programmable data processing apparatus, create means for implementing the functions specified in the flowchart flow or flows and/or block diagram block or blocks.
These computer program instructions may also be stored in a computer-readable memory that can direct a computer or other programmable data processing apparatus to function in a particular manner, such that the instructions stored in the computer-readable memory produce an article of manufacture including instruction means which implement the function specified in the flowchart flow or flows and/or block diagram block or blocks.
These computer program instructions may also be loaded onto a computer or other programmable data processing apparatus to cause a series of operational steps to be performed on the computer or other programmable apparatus to produce a computer implemented process such that the instructions which execute on the computer or other programmable apparatus provide steps for implementing the functions specified in the flowchart flow or flows and/or block diagram block or blocks.
The above embodiments are provided to further explain the objects, technical solutions and advantages of the present invention in detail, it should be understood that the above embodiments are merely exemplary embodiments of the present invention and are not intended to limit the scope of the present invention, and any modifications, equivalents, improvements and the like made within the spirit and principle of the present invention should be included in the scope of the present invention.