CN113383089A - Personalized ctDNA disease monitoring via representative DNA sequencing - Google Patents
Personalized ctDNA disease monitoring via representative DNA sequencing Download PDFInfo
- Publication number
- CN113383089A CN113383089A CN201980078983.1A CN201980078983A CN113383089A CN 113383089 A CN113383089 A CN 113383089A CN 201980078983 A CN201980078983 A CN 201980078983A CN 113383089 A CN113383089 A CN 113383089A
- Authority
- CN
- China
- Prior art keywords
- sequencing
- tumor
- sample
- variants
- rep
- Prior art date
- Legal status (The legal status is an assumption and is not a legal conclusion. Google has not performed a legal analysis and makes no representation as to the accuracy of the status listed.)
- Pending
Links
Images


Classifications
-
- C—CHEMISTRY; METALLURGY
- C12—BIOCHEMISTRY; BEER; SPIRITS; WINE; VINEGAR; MICROBIOLOGY; ENZYMOLOGY; MUTATION OR GENETIC ENGINEERING
- C12Q—MEASURING OR TESTING PROCESSES INVOLVING ENZYMES, NUCLEIC ACIDS OR MICROORGANISMS; COMPOSITIONS OR TEST PAPERS THEREFOR; PROCESSES OF PREPARING SUCH COMPOSITIONS; CONDITION-RESPONSIVE CONTROL IN MICROBIOLOGICAL OR ENZYMOLOGICAL PROCESSES
- C12Q1/00—Measuring or testing processes involving enzymes, nucleic acids or microorganisms; Compositions therefor; Processes of preparing such compositions
- C12Q1/68—Measuring or testing processes involving enzymes, nucleic acids or microorganisms; Compositions therefor; Processes of preparing such compositions involving nucleic acids
- C12Q1/6876—Nucleic acid products used in the analysis of nucleic acids, e.g. primers or probes
- C12Q1/6883—Nucleic acid products used in the analysis of nucleic acids, e.g. primers or probes for diseases caused by alterations of genetic material
- C12Q1/6886—Nucleic acid products used in the analysis of nucleic acids, e.g. primers or probes for diseases caused by alterations of genetic material for cancer
-
- C—CHEMISTRY; METALLURGY
- C12—BIOCHEMISTRY; BEER; SPIRITS; WINE; VINEGAR; MICROBIOLOGY; ENZYMOLOGY; MUTATION OR GENETIC ENGINEERING
- C12Q—MEASURING OR TESTING PROCESSES INVOLVING ENZYMES, NUCLEIC ACIDS OR MICROORGANISMS; COMPOSITIONS OR TEST PAPERS THEREFOR; PROCESSES OF PREPARING SUCH COMPOSITIONS; CONDITION-RESPONSIVE CONTROL IN MICROBIOLOGICAL OR ENZYMOLOGICAL PROCESSES
- C12Q1/00—Measuring or testing processes involving enzymes, nucleic acids or microorganisms; Compositions therefor; Processes of preparing such compositions
- C12Q1/68—Measuring or testing processes involving enzymes, nucleic acids or microorganisms; Compositions therefor; Processes of preparing such compositions involving nucleic acids
- C12Q1/6876—Nucleic acid products used in the analysis of nucleic acids, e.g. primers or probes
- C12Q1/6883—Nucleic acid products used in the analysis of nucleic acids, e.g. primers or probes for diseases caused by alterations of genetic material
-
- C—CHEMISTRY; METALLURGY
- C12—BIOCHEMISTRY; BEER; SPIRITS; WINE; VINEGAR; MICROBIOLOGY; ENZYMOLOGY; MUTATION OR GENETIC ENGINEERING
- C12Q—MEASURING OR TESTING PROCESSES INVOLVING ENZYMES, NUCLEIC ACIDS OR MICROORGANISMS; COMPOSITIONS OR TEST PAPERS THEREFOR; PROCESSES OF PREPARING SUCH COMPOSITIONS; CONDITION-RESPONSIVE CONTROL IN MICROBIOLOGICAL OR ENZYMOLOGICAL PROCESSES
- C12Q1/00—Measuring or testing processes involving enzymes, nucleic acids or microorganisms; Compositions therefor; Processes of preparing such compositions
- C12Q1/68—Measuring or testing processes involving enzymes, nucleic acids or microorganisms; Compositions therefor; Processes of preparing such compositions involving nucleic acids
- C12Q1/6869—Methods for sequencing
-
- C—CHEMISTRY; METALLURGY
- C12—BIOCHEMISTRY; BEER; SPIRITS; WINE; VINEGAR; MICROBIOLOGY; ENZYMOLOGY; MUTATION OR GENETIC ENGINEERING
- C12Q—MEASURING OR TESTING PROCESSES INVOLVING ENZYMES, NUCLEIC ACIDS OR MICROORGANISMS; COMPOSITIONS OR TEST PAPERS THEREFOR; PROCESSES OF PREPARING SUCH COMPOSITIONS; CONDITION-RESPONSIVE CONTROL IN MICROBIOLOGICAL OR ENZYMOLOGICAL PROCESSES
- C12Q2600/00—Oligonucleotides characterized by their use
- C12Q2600/106—Pharmacogenomics, i.e. genetic variability in individual responses to drugs and drug metabolism
-
- C—CHEMISTRY; METALLURGY
- C12—BIOCHEMISTRY; BEER; SPIRITS; WINE; VINEGAR; MICROBIOLOGY; ENZYMOLOGY; MUTATION OR GENETIC ENGINEERING
- C12Q—MEASURING OR TESTING PROCESSES INVOLVING ENZYMES, NUCLEIC ACIDS OR MICROORGANISMS; COMPOSITIONS OR TEST PAPERS THEREFOR; PROCESSES OF PREPARING SUCH COMPOSITIONS; CONDITION-RESPONSIVE CONTROL IN MICROBIOLOGICAL OR ENZYMOLOGICAL PROCESSES
- C12Q2600/00—Oligonucleotides characterized by their use
- C12Q2600/118—Prognosis of disease development
-
- C—CHEMISTRY; METALLURGY
- C12—BIOCHEMISTRY; BEER; SPIRITS; WINE; VINEGAR; MICROBIOLOGY; ENZYMOLOGY; MUTATION OR GENETIC ENGINEERING
- C12Q—MEASURING OR TESTING PROCESSES INVOLVING ENZYMES, NUCLEIC ACIDS OR MICROORGANISMS; COMPOSITIONS OR TEST PAPERS THEREFOR; PROCESSES OF PREPARING SUCH COMPOSITIONS; CONDITION-RESPONSIVE CONTROL IN MICROBIOLOGICAL OR ENZYMOLOGICAL PROCESSES
- C12Q2600/00—Oligonucleotides characterized by their use
- C12Q2600/156—Polymorphic or mutational markers
-
- C—CHEMISTRY; METALLURGY
- C12—BIOCHEMISTRY; BEER; SPIRITS; WINE; VINEGAR; MICROBIOLOGY; ENZYMOLOGY; MUTATION OR GENETIC ENGINEERING
- C12Q—MEASURING OR TESTING PROCESSES INVOLVING ENZYMES, NUCLEIC ACIDS OR MICROORGANISMS; COMPOSITIONS OR TEST PAPERS THEREFOR; PROCESSES OF PREPARING SUCH COMPOSITIONS; CONDITION-RESPONSIVE CONTROL IN MICROBIOLOGICAL OR ENZYMOLOGICAL PROCESSES
- C12Q2600/00—Oligonucleotides characterized by their use
- C12Q2600/158—Expression markers
Landscapes
- Chemical & Material Sciences (AREA)
- Life Sciences & Earth Sciences (AREA)
- Proteomics, Peptides & Aminoacids (AREA)
- Organic Chemistry (AREA)
- Health & Medical Sciences (AREA)
- Zoology (AREA)
- Wood Science & Technology (AREA)
- Engineering & Computer Science (AREA)
- Genetics & Genomics (AREA)
- Analytical Chemistry (AREA)
- Immunology (AREA)
- Microbiology (AREA)
- Biotechnology (AREA)
- Molecular Biology (AREA)
- Biophysics (AREA)
- Physics & Mathematics (AREA)
- Biochemistry (AREA)
- Bioinformatics & Cheminformatics (AREA)
- General Engineering & Computer Science (AREA)
- General Health & Medical Sciences (AREA)
- Pathology (AREA)
- Hospice & Palliative Care (AREA)
- Oncology (AREA)
- Measuring Or Testing Involving Enzymes Or Micro-Organisms (AREA)
Abstract
本文公开了一种从均质化的输入样品衍生出多个基因变体的方法。本文还公开了鉴定样品中多个基因变体的方法,所述方法包括:对一个或多个输入样品均质化以提供均质化样品;制备从所述均质化的输入样品中分离出的基因组材料以用于测序;以及在对制备的基因组材料测序后得出的测序数据内鉴定所述多个基因变体。

Disclosed herein is a method of deriving multiple genetic variants from a homogenized input sample. Also disclosed herein is a method of identifying a plurality of genetic variants in a sample, the method comprising: homogenizing one or more input samples to provide a homogenized sample; preparing a sample isolated from the homogenized input sample the genomic material for sequencing; and identifying the plurality of gene variants within sequencing data resulting from sequencing the prepared genomic material.
Description
Cross reference to related patent applications
This application claims benefit of filing date of U.S. provisional application No. 62/772,650, filed on 29.11.2018, the disclosure of which is incorporated herein by reference in its entirety.
Technical Field
The present disclosure relates to methods of identifying gene variants in a sample, such as a representative sample. In some embodiments, the method involves the generation of a CTDNA monitoring panel based on a plurality of gene variants identified in a sample (such as a representative sample).
Background
Since the introduction of the prior art 40 years ago, the use of DNA sequencing for the study of human genetic variations has undergone remarkable development, which allows the sequencing and analysis of human genomes within a few days. The release of the first "next generation sequencing" (NGS) instruments in the mid 2000 s triggered a revolution in disease research, greatly increasing the speed at a significantly reduced cost, allowing only weeks for the generation of human whole genome sequences. In addition to price and performance, new sequencing technologies have also proven to offset some of the technical deficiencies of older sequencing and genotyping technologies, allowing for genome-wide detection of variants (including new variants) at low cost. A further breakthrough of NGS in human genomics is the introduction of targeted enrichment methods to allow selective sequencing of regions of interest, thereby significantly reducing the number of sequences that need to be generated. The method is based on the collection of DNA or RNA probes representing target sequences in the genome, which can bind to and extract DNA fragments derived from the target region.
Whole Exon Sequencing (WES), which is capable of sequencing all protein coding regions (exons) in the human genome, is rapidly becoming the most widely used method of targeted enrichment, especially for single gene ("mendelian") diseases. This method can detect both exon (coding) as well as splice site variants, while requiring only about 2% sequencing "load" compared to whole genome sequencing. Unbiased analysis of all genes eliminates the need for time-consuming candidate gene selection prior to sequencing. It is estimated that exons carry about 85% of mutations, which have a large impact on disease-related traits. In addition, it was shown that exon mutations cause most monogenic diseases, with only missense and nonsense mutations accounting for about 60% of disease mutations.
Recent advances in genome sequencing technology provide an unprecedented opportunity to characterize individual genome maps and identify mutations relevant for diagnosis and therapy. Indeed, NGS has also been increasingly used in recent years to address pharmacogenomic research issues. Not only can genetic causes be detected that explain why certain patients do not respond to a certain drug, but attempts can be made to predict the success of a drug based on the genetic information. Certain gene variants may affect the activity of a particular protein, and these gene variants may be used to estimate the potential efficacy and toxicity of a drug targeting that protein. Therefore, NGS is used far beyond the discovery of disease-causing variants.
About 99.5% of the total DNA is shared among all people, and it is this 0.5% that produces all differences. A genetic variation or variant is a difference that makes the genome of each person unique. DNA sequencing identifies individual variants by comparing individual DNA sequences to DNA sequences of a reference genome maintained by the Genome Reference Consortium (GRC). It is believed that the human genome has on average millions of variants. Some variants appear in genes, but most appear in DNA sequences outside of genes. A few variants have been associated with diseases such as cancer.
Cancer is a disease characterized by the uncontrolled proliferation of abnormal cells. In normal tissue, cells divide and organize within the tissue in response to signals from surrounding cells, thereby producing normal cellular behavior that is carefully coordinated by the tissue environment. Cancer cells are unresponsive to growth-limiting environmental cues of surrounding tissues, and they often have genetic variations that cause them to proliferate and form tumors in many organs. As tumors continue to grow, genetic and phenotypic variation accumulates, enabling cancer cell populations to overcome additional "checkpoints," such as anti-tumor immune responses, and to manifest a more aggressive cancer cell growth phenotype. If not treated in time, metastasis may occur and cancer cells may spread to distant parts of the body through the lymphatic system or blood flow. Metastasis results in the formation of secondary tumors at multiple sites, damaging healthy tissue. Most cancer deaths are caused by such secondary tumors.
Current diagnostic oncology utilizes information obtained from a portion of a tumor and is based on the premise that the tumor is composed of cells that are homogeneous in composition. Many tumors are not homogeneous in composition, but rather heterogeneous. Indeed, it has been reported that some solid tumors are not homogeneous, but rather are composed of multiple genetically distinct, spatially separated populations of cancer cells. See Gerlinger et al, NEJM (2012) 366: 883-92; and Yachida et al Nature (2010)467 (7319): 1114, 1117, the disclosure of which is hereby incorporated by reference in its entirety. Conventional histological methodology addresses this heterogeneity by selecting multiple biopsy samples for analysis, e.g., based on morphology and other characteristics. For example, biopsy samples are taken from multiple regions of a tumor, wherein each sample taken comprises about 0.1 cubic centimeters of tissue. These methods investigate more tumor tissue and different spatial regions of the tumor; however, the vast majority of tumors determined using such methods remain unsampled. Similarly, conventional methods sample only a small fraction of lymph nodes from cancer patients, and do not sample the vast majority of tissues. The small size of these samples may also limit other diagnostic steps that may be utilized, such as sequencing.
Disclosure of Invention
One aspect of the disclosure is a method of identifying a plurality of gene variants in a sample (e.g., a sample derived from a human patient), the method comprising: homogenizing one or more tumor samples to provide a homogenized sample; preparing genomic material isolated from the homogenized sample for sequencing; and identifying a plurality of gene variants within sequencing data obtained after sequencing the prepared genomic material. In some embodiments, the method further comprises determining whether the identified plurality of gene variants are cloned or subcloned. In some embodiments, the one or more neoantigens are derived from an identified subcloning mutation. In some embodiments, the plurality of gene variants are identified using Whole Genome Sequencing (WGS), Whole Exome Sequencing (WES), Single Nucleotide Polymorphism (SNP) analysis, deep sequencing, sequencing by synthesis, targeted gene sequencing, or any combination thereof.
In some embodiments, the method further comprises generating a ctDNA monitoring set based on the identified plurality of gene variants. In some embodiments, the generated ctDNA monitoring set is used to determine a response to therapy. In some embodiments, the generated ctDNA monitoring set is used to determine an evolution trajectory of the cancer. In some embodiments, the generated ctDNA monitoring set is used to predict response to future treatment strategies. In some embodiments, the generated ctDNA monitoring set is used to determine the presence of cancer in the patient during or after therapy. In some embodiments, the generated ctDNA monitoring panel is used to determine the presence of cancer in a patient after remission of the disease, after a complete response to therapy, or after diagnosis of an undetectable disease. In some embodiments, the generated ctDNA monitoring set is used to detect minimal residual disease after surgical removal of the primary tumor. In some embodiments, the generated ctDNA monitoring set is used to detect minimal residual disease after surgical removal of metastatic tumors.
In some embodiments, the method further comprises calculating a clonal structure based on the identified plurality of gene variants. In some embodiments, the calculation of the clonal structure comprises: (i) calculating a cancer cell score estimate for each of a plurality of identified gene variants; and (ii) grouping the calculated cancer cell fraction estimates into mutation clusters. In some embodiments, the method further comprises evaluating the isolation of a single identified gene variant.
In some embodiments, the method further comprises sorting the cellular particles within the homogenized sample prior to preparing the genomic material. In some embodiments, sorting of the cell particles is based on size. In some embodiments, sorting of the cell particles is based on the presence of one or more biomarkers.
In some embodiments, the method further comprises: if one or more specific subcloned variants are identified within the plurality of identified genetic variants, then it is assessed whether the human subject is at increased risk for rapid disease progression. In some embodiments, the method further comprises determining whether replacement therapy is required based on the identification of one or more specific subclone variants within the plurality of identified genetic variants.
Another aspect of the disclosure is a method of identifying a plurality of gene variants in a sample (e.g., a sample derived from a human patient), the method comprising: homogenizing one or more input samples to provide a homogenized sample; preparing genomic material isolated from the homogenized input sample for sequencing; and identifying a plurality of gene variants within sequencing data obtained after sequencing the prepared genomic material. In some embodiments, the method further comprises determining whether the identified plurality of gene variants are cloned or subcloned. In some embodiments, the one or more neoantigens are derived from an identified subcloning mutation. In some embodiments, the plurality of gene variants are identified using Whole Genome Sequencing (WGS), Whole Exome Sequencing (WES), Single Nucleotide Polymorphism (SNP) analysis, deep sequencing, targeted gene sequencing, or any combination thereof.
In some embodiments, the one or more input samples are derived from one or more of a tumor sample, a lymph node sample, a blood sample, and/or other tissue sample. In some embodiments, the one or more input samples are derived from one or more of a tumor sample and/or a blood sample. In some embodiments, the one or more input samples are derived from a tumor sample. In some embodiments, the input sample is derived from a human patient or a mammalian subject: (i) is diagnosed with cancer, (ii) is suspected of having cancer, (iii) is at risk of developing cancer; (iv) risk of worsening or recurrence of cancer; and/or (v) suspected of having cancer recurrence. In some embodiments, the input sample is derived from a healthy human patient or mammalian subject.
In some embodiments, the input sample comprises a representative sample of cells derived from a tumor sample, a lymph node sample, a blood sample, or any combination thereof. In some embodiments, a representative sample can be generated from an intact tumor biopsy of a solid tumor. In some embodiments, the biopsy sample comprises at least about 100 to about 200 cells. In some embodiments, the biopsy sample comprises at least about 200 to about 1,000 cells. In some embodiments, the biopsy sample comprises at least about 1,000 to about 5,000 cells. In some embodiments, the biopsy sample comprises at least about 10,000 to about 100,000 cells. In some embodiments, the biopsy sample comprises at least about 100,000 to about 1,000,000 or more cells.
In some embodiments, the method further comprises generating a ctDNA monitoring set based on the identified plurality of gene variants. In some embodiments, the generated ctDNA monitoring set is used to determine a response to therapy. In some embodiments, the generated ctDNA monitoring set is used to determine an evolution trajectory of the cancer. In some embodiments, the generated ctDNA monitoring set is used to predict response to future treatment strategies. In some embodiments, the generated ctDNA monitoring set is used to determine the presence of cancer in the patient during or after therapy. In some embodiments, the generated ctDNA monitoring panel is used to determine the presence of cancer in a patient after remission of the disease, after a complete response to therapy, or after diagnosis of an undetectable disease. In some embodiments, the generated ctDNA monitoring set is used to detect minimal residual disease after surgical removal of the primary tumor. In some embodiments, the generated ctDNA monitoring set is used to detect minimal residual disease after surgical removal of metastatic tumors.
In some embodiments, the method further comprises calculating a clonal structure based on the identified plurality of gene variants. In some embodiments, the calculation of the clonal structure comprises: (i) calculating a cancer cell score estimate for each of a plurality of identified gene variants; and (ii) grouping the calculated cancer cell fraction estimates into mutation clusters. In some embodiments, the method further comprises evaluating the isolation of a single identified gene variant.
In some embodiments, the method further comprises sorting the cellular particles within the homogenized sample prior to preparing the genomic material. In some embodiments, sorting of the cell particles is based on size. In some embodiments, sorting of the cell particles is based on the presence of one or more biomarkers.
In some embodiments, the method further comprises: if one or more specific subcloned variants are identified within the plurality of identified genetic variants, then it is assessed whether the human subject is at increased risk for rapid disease progression. In some embodiments, the method further comprises determining whether replacement therapy is required based on the identification of one or more specific subclone variants within the plurality of identified genetic variants.
Another aspect of the disclosure is a method of identifying a plurality of gene variants in a sample (e.g., a sample derived from a human patient), the method comprising: obtaining a representative sample; and identifying a plurality of gene variants within sequencing data obtained after sequencing the representative sample. In some embodiments, a representative sample can be generated from an intact tumor biopsy of a solid tumor. In some embodiments, the biopsy sample comprises at least about 100 to about 200 cells. In some embodiments, the biopsy sample comprises at least about 200 to about 1,000 cells. In some embodiments, the biopsy sample comprises at least about 1,000 to about 5,000 cells. In some embodiments, the biopsy sample comprises at least about 10,000 to about 100,000 cells. In some embodiments, the biopsy sample comprises at least about 100,000 to about 1,000,000 or more cells.
In some embodiments, a representative sample may be obtained by homogenizing one or more input samples. In some embodiments, the one or more input samples are derived from one or more of a tumor sample, a lymph node sample, a blood sample, and/or other tissue sample. In some embodiments, the one or more input samples are derived from one or more of a tumor sample and/or a blood sample. In some embodiments, the one or more input samples are derived from a tumor sample. In some embodiments, the input sample is derived from a human patient or a mammalian subject: (i) is diagnosed with cancer, (ii) is suspected of having cancer, (iii) is at risk of developing cancer; (iv) risk of worsening or recurrence of cancer; and/or (v) suspected of having cancer recurrence. In some embodiments, the input sample is derived from a healthy human patient or mammalian subject.
In some embodiments, the method further comprises determining whether the identified plurality of gene variants are cloned or subcloned. In some embodiments, the one or more neoantigens are derived from an identified subcloning mutation. In some embodiments, the plurality of gene variants are identified using Whole Genome Sequencing (WGS), Whole Exome Sequencing (WES), Single Nucleotide Polymorphism (SNP) analysis, deep sequencing, sequencing by synthesis, targeted gene sequencing, or any combination thereof.
In some embodiments, the method further comprises generating a ctDNA monitoring set based on the identified plurality of gene variants. In some embodiments, the generated ctDNA monitoring set is used to determine a response to therapy. In some embodiments, the generated ctDNA monitoring set is used to determine an evolution trajectory of the cancer. In some embodiments, the generated ctDNA monitoring set is used to predict response to future treatment strategies. In some embodiments, the generated ctDNA monitoring set is used to determine the presence of cancer in the patient during or after therapy. In some embodiments, the generated ctDNA monitoring panel is used to determine the presence of cancer in a patient after remission of the disease, after a complete response to therapy, or after diagnosis of an undetectable disease. In some embodiments, the generated ctDNA monitoring set is used to detect minimal residual disease after surgical removal of the primary tumor. In some embodiments, the generated ctDNA monitoring set is used to detect minimal residual disease after surgical removal of metastatic tumors.
In some embodiments, the method further comprises calculating a clonal structure based on the identified plurality of gene variants. In some embodiments, the calculation of the clonal structure comprises: (i) calculating a cancer cell score estimate for each of a plurality of identified gene variants; and (ii) grouping the calculated cancer cell fraction estimates into mutation clusters. In some embodiments, the method further comprises evaluating the isolation of a single identified gene variant.
In some embodiments, the method further comprises sorting the cellular particles within the homogenized sample prior to preparing the genomic material. In some embodiments, sorting of the cell particles is based on size. In some embodiments, sorting of the cell particles is based on the presence of one or more biomarkers.
In some embodiments, the method further comprises: if one or more specific subcloned variants are identified within the plurality of identified genetic variants, then it is assessed whether the human subject is at increased risk for rapid disease progression. In some embodiments, the method further comprises determining whether replacement therapy is required based on the identification of one or more specific subclone variants within the plurality of identified genetic variants.
Thousands of solid tumors have been sequenced to date, but the basic undersampling bias is inherent to current methodologies. This is caused by a fixed size biopsy input sample, which is significantly less capable as the tumor volume expands. Indeed, our analysis of current clinical and research practices indicates that existing protocols sample only from 0.0005% to 2.0% of the total tumor mass, increasing the likelihood of significant sampling range deviations. Here, we demonstrate representative sequencing (hereinafter "Rep-Seq") as a novel method to achieve unbiased sampling of solid tumor tissue. The Rep-Seq protocol involves homogenizing all residual tumor material not used for pathology into well-mixed solutions, in conjunction with next generation sequencing. Rep-Seq was performed on the basis of proof-of-concept of 11 tumors and benchmarked for single and multi-region sequencing methods at matching sequencing depths. Rep-Seq enables the detection of more variants, greater accuracy in determining clones from subclonal mutations, and provides a greater level of reproducibility between repeats. In summary, Rep-Seq effectively implements a unbiased tumor sampling method, extracting DNA molecules from a well-mixed solution of the entire tumor mass, thereby eliminating the spatial bias inherent in current methods.
Drawings
The features of the present disclosure are generally understood with reference to the accompanying drawings. In the drawings, like reference numerals are used to identify like elements throughout.
FIG. 1 provides a flow chart illustrating the steps of identifying gene variants within a homogenized tumor sample.
Figure 2 provides a flow chart illustrating the steps of sequencing genomic data derived from homogenized tumor samples.
Figure 3 illustrates further downstream processes that may occur after multiple genomic samples are identified from the homogenized tumor sample.
Figure 4 illustrates the current tumor sequencing method resulting in undersampling, which can be addressed by a wider sampling range.
Fig. 4A (top) shows a density plot of tumor volume distribution from a cancer genomic map (TCGA), where tumor volume (cm3) is plotted on the x-axis on a logarithmic scale. Fig. 4A (in) shows a density plot of biopsy tissue volumes used as input material for sequencing in the same set of TCGA samples. Fig. 4A (bottom) shows the proportion of tissue sampled (i.e., for each case, the values from the middle group divided by the values of the top group), divided by tumor stage.
Figure 4B (left) shows tumor volume (cm) estimated from local clinical examination3) It is divided into tissue parts. Fig. 4B (right) shows the proportion of sampled tissue divided by tissue site in a clinical review.
Fig. 4C shows the experimental design of a pilot experiment for the pooled "mixed" samples.
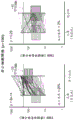
Figure 4D (left) shows the Variant Allele Frequency (VAF) correlation between mixed sequencing (x-axis) compared to the true VAF estimated from multiple biopsy sequencing (y-axis). Figure 4D (right) shows the Variant Allele Frequency (VAF) correlation between single region sequencing (x-axis) compared to the true VAF estimated from multiple biopsy sequencing (y-axis).
Figure 4E (left) shows the number of variants found in each sequencing method in the pilot dataset for non-small cell lung cancer. Figure 4E (right) shows the proportion of known authentic variants found using "mixed" sequencing compared to single region biopsy sequencing for non-small cell lung cancer.
Figure 4F (left) shows the number of variants found in each sequencing method in the pilot dataset for urothelial cancer. Figure 4F (right) shows the proportion of known authentic variants found using "mixed" sequencing compared to single region biopsy sequencing for urothelial cancer.
FIG. 5 illustrates a representative sample sequencing method as described herein.
Fig. 5A illustrates a methodological workflow for a new representative sequencing (Rep-Seq) methodology, according to some embodiments described herein.
Fig. 5B illustrates a sampling strategy for validating the Rep-Seq method for a broad range of biopsy samples.
FIG. 5C illustrates a map of non-synonymous variants found in all biopsies, ctDNA samples, and Rep-Seq biological replicates, and the case Rep-Seq1 was sequenced.
FIG. 5D illustrates the Jaccard similarity index results for single biopsy sequencing versus Rep-Seq (left) and ctDNA sequencing versus Rep-Seq (right), as a measure of reproducibility.
Fig. 5E provides a plot of Variant Allele Frequency (VAF) versus variants detected for Rep-seq (VAF) samples and whole tumor (VAF) samples.
FIG. 6 illustrates clone tracking by Rep-Seq and ctDNA.
FIG. 6A illustrates a phylogenetic tree of case Rep-Seq1, which was derived using extensive multiple biopsy sequencing (left) and single Rep-Seq samples.
FIG. 6B illustrates clonal distribution in 4 sections of primary Rep-Seq1 tumor and lymph node metastases.
Fig. 6C illustrates Cancer Cell Fraction (CCF) estimates for mutations in tumor clone A, B and C in each biopsy sample (left) and Rep-Seq sample (right).
Fig. 6D illustrates the illusion of clonality simulation data, where the number of simulated biopsy samples is plotted on the x-axis, and the percentage of variants of clones (clonality illusion) is shown incorrectly on the y-axis (from 100 simulated sample combinations).
FIG. 6E illustrates ctDNA data for Rep-Seq1 and plots VAF (y-axis) for mutations in clones A, B and C.
FIG. 6F illustrates the phylogenetic tree of cases Rep-Seq2 and Rep-Seq3 constructed using the Rep-Seq method.
FIG. 6G illustrates the non-synonymous mutation counts for cases Rep-Seq4 through Rep-Seq11 (top), and the mutation characterization results (bottom).
Fig. 6H illustrates Rep-Seq11 coverage data for the total batch mixed cell population, followed by the estimated tumor cell coverage and purity estimates (left). Data are shown for standard Rep-Seq, followed by Rep-Seq with high tumor purity for comparison. FIG. 6H illustrates the number of non-synonymous variants detected in normal and high-purity Rep-Seq samples (right). The variant count is color-coded based on "shared" (i.e., present in both samples) or "private" (i.e., the variant is present only in that sample and not in the other sample).
FIG. 7 illustrates predicted neoantigens from each biopsy sample and Rep-Seq biological replicates for case Rep-Seq 1. Although tumors may contain thousands of mutations or variants, only some of these mutations are presented to the immune system as neoantigens (i.e., proteins that are perceived as "foreign" to the immune system). It is not possible to know a priori whether a mutation can be effectively recognized as foreign by the immune system, and therefore computer algorithms are used to predict the antigenicity of a modified (i.e., mutated) protein. By creating personalized vaccines, the neoantigens can be used to elicit immune responses in cancer patients. After vaccination with a targeted personalized neoantigen vaccine, the key components of an effective immune response are (1) proper detection of the clonality of the neoantigen (since the subcloned neoantigen that elicits the immune response will only eliminate cancer cells bearing the neoantigen), and (2) finding as many neoantigens as possible from each patient (it is not possible to know whether the predicted neoantigen will be a productive stimulator of the immune system, and the utility of a personalized cancer vaccine may depend on the number of neoantigens targeted). Thus, as shown in FIG. 7, Rep-Sep will outperform a single biopsy in all cases.
Fig. 8A and 8B list copy number heatmaps of Rep-Seq1 (fig. 8A) and all primary biopsy regions of metastatic biopsy regions (fig. 8B) taken from 20 different anatomical sites of disease at the time of a rapid necropsy. Biopsies are sorted based on log (r) values of chromosome arm 14 q. The metastatic regions all contained 14q loss, and about half of the primary biopsy region (clone B), indicating that metastasis was disseminated by clone B. Although we note that we cannot exclude the possibility that 14q loss in metastasis is an independent parallel event, the hypothesis would be supported by combined ctDNA data, lymph node representational sequencing, and autopsy metastatic data.
FIG. 9 provides variant allele frequencies sequenced from the entire exome in cases Rep-Seq4 through Rep-Seq10, divided by Ref > Alt base changes and by frequency (above or below 5% VAF). Base changes associated with FFPE artifacts (e.g., C > T, G > a) are not elevated in low frequency mutations. These data indicate that sequencing data generated by Rep-Seq is comparable to standard sequencing methods and that the extended period of formalin fixation does not negatively impact DNA sequencing from homogenized residual tumor tissue.
Detailed Description
It will also be understood that, in any method claimed herein that includes a plurality of steps or acts, the order of the steps or acts is not necessarily limited to the order in which the steps or acts are recited.
As used herein, the singular terms "a" and "the" include plural references unless otherwise specified. Similarly, the word "or" is intended to include "and" unless the context clearly indicates otherwise. The term "comprising" is defined as inclusive, such that "comprising a or B" means including A, B, or a and B.
As used herein in the specification and claims, "or" should be understood to have the same meaning as "and/or" as defined above. For example, when items in a list are separated, "or" and/or "should be interpreted as being inclusive, i.e., including at least one of a plurality of elements or a list of elements, and optionally additional unlisted items, but also including more than one. Merely explicitly stating the opposite terms, such as "only one" or "exactly one," or "consisting of … …" when used in the claims, will mean that only one of the one or more elements is included. In general, when there are presently exclusive terms such as "any," "an," "only one," or "exactly one," the term "or" as used herein should be interpreted merely to indicate an exclusive choice (e.g., "one or the other, but not both"). "consisting essentially of … …" when used in the claims shall have the ordinary meaning as used in the patent law.
The terms "comprising," "including," "having," and the like are used interchangeably and have the same meaning. Similarly, "including," "comprising," "having," and the like are used interchangeably and have the same meaning. In particular, the definition of each term is consistent with the definition of "comprising" in common U.S. patent law, and thus each term is to be understood as an open term that means "at least the following," and is also to be construed as not excluding additional features, limitations, aspects, and the like. Thus, for example, "a device having components a, b, and c" means that the device includes at least components a, b, and c. Similarly, the phrase: by "a method involving steps a, b and c" is meant that the method comprises at least steps a, b and c. Further, although the steps and processes may be summarized herein in a particular order, those skilled in the art will recognize that the sequential steps and processes may vary.
As used herein in the specification and claims, the phrase "at least one," when referring to a list of one or more elements, should be understood to mean at least one element selected from any one or more of the elements in the list of elements, but not necessarily including at least one of each element specifically listed in the list of elements, and not excluding any combinations of elements in the list of elements. This definition also allows that, in addition to the elements specifically identified in the list of elements to which the phrase "at least one" refers, there may optionally be additional elements, whether related or unrelated to those specifically identified elements. Thus, as a non-limiting example, in one embodiment, "at least one of a and B" (or, equivalently, "at least one of a or B," or, equivalently "at least one of a and/or B") may refer to at least one (optionally including more than one) a, no B being present (and optionally including elements other than B); in another embodiment, it may refer to at least one (optionally including more than one) B, with no a present (and optionally including elements other than a); in yet another embodiment, it may refer to at least one (optionally including more than one) a and at least one (optionally including more than one) B (and optionally including other elements), and so forth.
As used herein, the term "biological sample," "tissue sample," "specimen," or similar terms refer to any sample, including biomolecules (e.g., proteins, peptides, nucleic acids, lipids, carbohydrates, or combinations thereof) obtained from any organism, including viruses. Examples of other organisms include mammals (e.g., humans; veterinary animals such as cats, dogs, horses, cows, and pigs; and laboratory animals such as mice, rats, and primates), insects, annelid animals, arachnids, marsupials, reptiles, amphibians, bacteria, and fungi. Biological samples include tissue samples (e.g., tissue sections and needle biopsies of tissue), cellular samples (e.g., cytological smears, such as cervical smears or blood smears or obtained by microdissection), or cellular fractions, debris, or organelles (e.g., obtained by lysing cells and separating their components by centrifugation or other means). Other examples of biological samples include blood, serum, urine, semen, stool, cerebrospinal fluid, interstitial fluid, mucus, tears, sweat, pus, biopsy tissue (e.g., obtained by surgical biopsy or needle biopsy), nipple aspirate, cerumen, breast milk, vaginal secretion, saliva, a swab (e.g., a buccal swab), or any material that contains a biomolecule and is derived from a first biological sample. In certain embodiments, the term "biological sample" as used herein refers to a sample (such as a homogenized or liquefied sample) prepared from a tumor or a portion thereof obtained from a subject.
As used herein, the term "biomarker" refers to a biological molecule found in blood, other bodily fluids, or tissues that serves as a marker for a normal or abnormal process or condition or disease (e.g., cancer). Biomarkers can be used to determine the extent of the body's response to treatment of a disease or disorder or whether a subject is predisposed to a disease or disorder. In the case of cancer, biomarkers refer to biological substances that indicate the presence of cancer in vivo. The biomarker may be a molecule secreted by the tumor or a specific response of the body to the presence of cancer. Genetic, epigenetics, proteomics, carbohydrate and imaging biomarkers can be used for diagnosis, prognosis and epidemiology of cancer. Such biomarkers can be determined in a non-invasively collected biological fluid (e.g., blood or serum). Several gene and protein based biomarkers have been used in patient care including, but not limited to, AFP (liver cancer), BCR-ABL (chronic myeloid leukemia), BRCA1/BRCA2 (breast/ovarian cancer), BRAF V600E (melanoma/colorectal cancer), CA-125 (ovarian cancer), CA19.9 (pancreatic cancer), CEA (colorectal cancer), EGFR (non-small cell lung cancer), HER-2 (breast cancer), KIT (gastrointestinal stromal tumor), PSA (prostate specific antigen), S100 (melanoma), etc. Biomarkers can be used as a diagnosis (to identify early stage cancer) and/or prognosis (to predict the aggressiveness of the cancer and/or to predict the extent of a subject's response to a particular treatment and/or the likelihood of cancer recurrence).
As used herein, the term "cell particle" refers to a single cell or organelle released from a cell. In some embodiments, the organelle released from the cell is a nucleus. In other embodiments, the organelles released from the cells are nuclei containing remnants of cytoplasmic material, which can be used to identify cells of nuclear origin. For example, cytokeratins can remain attached to the nucleus and serve as protein markers originating from the nucleus of tumor cells.
As used herein, the term "clonal mutation" refers to a mutation that is present in most cells.
As used herein, the term "ctDNA" refers to free DNA released from primary tumor cells, circulating tumor cells in the blood circulation system, and necrotic or apoptotic tumor cells in peripheral blood, or any combination thereof.
As used herein, the term "elevated risk" refers to an increased likelihood that an event will occur as compared to another population. In the context of the present disclosure, "a subject at increased risk of rapid disease progression" refers to a subject (e.g., a human patient) having an increased likelihood of rapid disease progression due to the presence of one or more mutations, including subclonal mutations as compared to a subject not having such one or more mutations.
As used herein, the term "will.. homogenize" or "homogenization" refers to a process (such as a mechanical process and/or a biochemical process) whereby a biological sample reaches a state such that all fractions of the sample are compositionally equal. A representative sample (as defined above) may be prepared by removing a portion of the sample that has been homogenized. The homogenized sample ("homogenate") should be mixed well so that removal of a portion of the sample (aliquot) does not substantially change the overall composition of the remaining sample, and the components of the removed aliquot are substantially identical to the components of the remaining sample. In the present disclosure, "homogenization" will generally preserve the integrity of most cells within the sample, e.g., at least 50% of the cells in the sample will not be disrupted or lysed as a result of the homogenization process. In other embodiments, homogenization will preserve the integrity of at least 80% of the cells in the sample. In other embodiments, homogenization will preserve the integrity of at least 85% of the cells in the sample. In other embodiments, homogenization will preserve the integrity of at least 90% of the cells in the sample. In other embodiments, homogenization will preserve the integrity of at least 95% of the cells in the sample. In other embodiments, homogenization will preserve the integrity of at least 96 cells in the sample. In other embodiments, homogenization will preserve the integrity of at least 97% of the cells in the sample. In other embodiments, homogenization will preserve the integrity of at least 98% of the cells in the sample. In other embodiments, homogenization will preserve the integrity of at least 99% of the cells in the sample. In other embodiments, homogenization will preserve the integrity of at least 99.9% of cells in the same cell. The homogenate may be substantially broken down into individual cells (or clusters of cells), and the resulting homogenate(s) is substantially homogeneous (consisting of or consisting of similar elements, or homogeneous throughout).
As used herein, the term "lymph node" refers to an oval or kidney-shaped organ of the lymphatic system, widely found throughout the body, including the axilla and stomach, and connected by lymphatic vessels. Lymph nodes contain a variety of immune cells including, but not limited to, B cells and T cells. In some embodiments, the lymph nodes may contain hidden tumor cells.
As used herein, the term "neoantigen" is an antigen formed from peptides not normally present in the proteome of a cell. The term "antigen" is used herein as it is in the art and refers to a molecule or portion thereof that induces antibody production in an organism capable of producing antibodies. In some embodiments, the term "neoantigen" refers to a class of tumor antigens that result from tumor-specific mutations in the expressed protein. In some embodiments, the neoantigen may be derived from any cancer, tumor, or cell thereof. In some embodiments, the term encompasses both neoantigenic peptides and polynucleotides encoding neoantigenic peptides. Not all antigens may elicit an immune response, and thus the term "antigenic" is not synonymous with "immunogenic". Likewise, the term "antigen" is not synonymous with "immunogen". As used herein, a neoantigen discovered using the methods of the present disclosure may or may not be immunogenic. In some embodiments, the neoantigens discovered using the methods of the present disclosure are immunogenic. In some embodiments, the neoantigens discovered using the methods of the present disclosure are not immunogenic to one host, e.g., a human host, but can be used to generate antibodies in other hosts to therapeutically target them. In some embodiments, the neoantigens of the present disclosure may be specific for each individual population of cells. For example, a cell population obtained from one subject may contain a neoantigen that is different from the neoantigen contained in a cell population obtained from a different subject. Thus, while cellular DNA may be identical or nearly identical between two cell populations obtained from different subjects, the neoantigens contained in the cell populations may differ. Thus, the present disclosure may be applied in methods of personalized medicine.
As used herein, the term "nucleic acid" as used herein refers to a high molecular weight biochemical macromolecule consisting of a chain of nucleotides that conveys genetic information. The most common nucleic acids are deoxyribonucleic acid (DNA) and ribonucleic acid (RNA). The monomers that make up a nucleic acid are called nucleotides. Each nucleotide is composed of three parts: a nitrogen-containing heterocyclic base, purine or pyrimidine (also known as a nucleobase); and pentose sugars. Different nucleic acid types differ in the sugar structure of their nucleotides; DNA contains 2-deoxyribose, while RNA contains ribose.
As used herein, the term "read depth" or "sequencing depth" refers to the number of times a sequence has been sequenced (depth of sequencing). For example, read depth can be determined by aligning multiple sequencing runs and counting the starting positions of reads in a non-overlapping window of a certain size (e.g., 100 bp). Copy number variation may be determined based on read depth using methods known in the art. For example, Yoon et al (Genome Research 2009 September; 19 (9): 1586-; xie et al (BMC Bioinformatics 2009 Mar.6; 10: 80); or as described by Medvedev et al (Nature Methods 2009 November; 6(11 Suppl): S13-20).
As used herein, the terms "representative sample" and "representative sample" refer to a sample (or a subset of a sample) that accurately reflects the overall composition and thus is an unbiased indication of the entire population. Generally, this means that the different types of cells and their relative proportions or percentages in a representative sample or portion thereof substantially accurately reflect or mimic the relative proportions or percentages of these cell types within an entire tissue specimen (typically a solid tumor or portion thereof). Sampling is the operation of fixing a portion of an object for subsequent analysis. Representative samples are generated in a manner that enables reasonably close knowledge of the subject under study. In contrast, conventional random sampling methods generally do not produce a "representative sample. While it may be possible to bias the selection of a smaller single subsample from a larger sample based on the selected region, homogenizing a large sample (e.g., the entire tumor or lymph node) results in a uniform dispersion of spatially separated elements throughout the sample.
The term "sequencing" or "DNA sequencing" as used herein refers to biochemical methods for determining the order of nucleotide bases, adenine, guanine, cytosine, and thymine in a DNA oligonucleotide. Sequencing, as the term is used herein, may include, but is not limited to, parallel sequencing or any other sequencing method known to those skilled in the art, such as chain termination, rapid DNA sequencing, walk-point analysis (wandering-spot analysis), Maxam-Gilbert sequencing, dye terminator sequencing, or using any other modern automated DNA sequencing instrument.
As used herein, the term "sequence data" or "sequencing data" refers to any sequence information known to the skilled artisan with respect to a nucleic acid molecule. The sequence data may comprise information about DNA or RNA sequences, modified nucleic acids, single or double stranded sequences, or alternatively amino acid sequences, which have to be converted into nucleic acid sequences. The sequence data may additionally include information about the sequencing equipment, date of acquisition, read length, sequencing direction, source of the sequenced entity, adjacent sequences or reads, presence of repeats, or any other suitable parameter known to those skilled in the art. The sequence data may be presented in any suitable format, archive, code, or document known to those skilled in the art.
As used herein, the term "subcloning mutations" refers to mutations that are present in less than 100% of cancer cells, typically less than 50%. Subclonal mutations may be present in most tumors (i.e., less than 100%, but greater than 50%) or in a few tumors (i.e., less than 50%).
As used herein, the term "tumor" refers to a mass or neoplasm, which is itself defined as an abnormal new growth of cells that typically grow faster than normal cells and that would continue to grow if left untreated, sometimes resulting in damage to adjacent structures. The tumor sizes may vary widely. The tumor may be solid or liquid-filled. A tumor may refer to a growth that is benign (non-malignant, generally harmless) or malignant (capable of metastasizing). Some tumors may contain benign neoplastic cells (e.g., carcinoma in situ) as well as malignant cancer cells (e.g., adenocarcinoma). It should be understood to include neoplasms located at various locations throughout the body. Thus, for the purposes of this disclosure, tumors include primary tumors, lymph nodes, lymphoid tissues, and metastatic tumors.
As used herein, the term "tumor sample" encompasses a sample prepared from a tumor or from a sample that may or is suspected of comprising cancer cells, or a sample to be tested for the possible presence of cancer cells. In some embodiments, the tumor sample may originate from, for example, a lymph node.
As used herein, the term "variant" or "gene variant" refers to an alternative form of a gene, genomic sequence, or portion thereof. Variant may also refer to a corresponding genomic change at the protein or RNA level. In some embodiments, the variant causes an alteration of an amino acid in the protein sequence, but may also affect the function or activity of the protein or cell in other ways, for example, in RNA splicing, translation, or other levels of transcriptional or translational regulation. "variant" may also refer to a polypeptide: wherein the sequence differs from the sequence most prevalent in the population at a position that does not alter the amino acid sequence of the encoded polypeptide (i.e., conservative changes). The gene variant polypeptide may be encoded by an at-risk haplotype, by a protective haplotype, or may be encoded by a neutral haplotype. The gene variant polypeptide may be risk related, protection related or may be neutral. Non-limiting examples of gene variants include frameshifts, stop acquisition, start loss, splice acceptor, splice donor, stop loss, missense, splice region, synonyms, and copy number variants. Non-limiting types of copy number variants include deletions and duplications.
Generation of representative samples for sequencing
Input sample and homogenization
In some embodiments, a tumor sample, lymph node sample, blood sample, and/or other tissue sample (collectively, "input sample") is homogenized by placing the sample in a mechanical shearing apparatus (e.g., a stirrer or sonicator) (step 100).
In some embodiments, the input sample comprises a representative sample of cells derived from a tumor sample, a lymph node sample, a blood sample, or any combination thereof. In some embodiments, the input sample is derived from a human patient or a mammalian subject: (i) is diagnosed with cancer, (ii) is suspected of having cancer, (iii) is at risk of developing cancer; (iv) risk of worsening or recurrence of cancer; and/or (v) suspected of having cancer recurrence. In other embodiments, the input sample is derived from a healthy human patient or mammalian subject.
In some embodiments, the representative sample is obtained by homogenization (step 100) of a large volume or bulk tumor sample (such as a clinical tumor sample) or lymph node obtained from the subject. For example, the entire tumor or a substantial portion thereof can be used as an input material for generating a representative sample. In some embodiments, at least 40% of the tumor or lymph node (or the portion thereof remaining after removal of the portion used for other diagnostic tests (such as removal of the portion that can be used to prepare a conventional FFPE sample)) is used for homogenization. In other embodiments, at least 50% of the tumor or lymph nodes are used for homogenization. In other embodiments, at least 60% of the tumor or lymph is used for homogenization. In other embodiments, at least 70% of the tumor or lymph nodes are used for homogenization. In other embodiments, at least 80% of the tumor or lymph is used for homogenization. In other embodiments, at least 90% of the tumor or lymph nodes are used for homogenization. In other embodiments, at least 91% of the tumor or lymph nodes are used for homogenization. In other embodiments, at least 92% of the tumor or lymph nodes are used for homogenization. In other embodiments, at least 93% of the tumor or lymph nodes are used for homogenization. In other embodiments, at least 94% of the tumor or lymph nodes are used for homogenization. In other embodiments, at least 95% of the tumor or lymph nodes are used for homogenization. In other embodiments, at least 96% of the tumor or lymph nodes are used for homogenization. In other embodiments, at least 97% of the tumor or lymph nodes are used for homogenization. In other embodiments, at least 98% of the tumor or lymph nodes are used for homogenization. In other embodiments, at least 99% of the tumor or lymph nodes are used for homogenization. In still other embodiments, the entire tumor, the entire lymph node, or the entire population of lymph nodes (or a portion thereof that remains after removal of portions for other diagnostic tests, such as removal of portions that can be used to prepare conventional FFPE samples) is used for homogenization.
Representative samples can be generated from an intact tumor biopsy of a solid tumor. In some embodiments, the biopsy sample comprises at least about 100 to about 200 cells. In other embodiments, the biopsy sample comprises at least about 200 to about 1,000 cells. In still other embodiments, the biopsy sample comprises at least about 1,000 to about 5,000 cells. In a further embodiment, the biopsy sample comprises at least about 10,000 to about 100,000 cells. In even further embodiments, the biopsy sample comprises at least about 100,000 to about 1,000,000 or more cells. In some embodiments, the cells are obtained from spatially distinct regions of a tumor. In another embodiment, representative examples disclosed herein are obtained by homogenizing one or more putative normal tissue specimens, e.g., derived from a patient or mammalian subject at risk for cancer, including those at risk for cancer due to genetic mutation or previous cancer. As used herein, the term "spatially distinct" refers to elements that are distributed in different regions of space. In one embodiment, the tumor biopsy samples used to generate the representative sample are taken from different regions of the tumor sample. For example, proximal versus distal regions of the tumor, different faces of the tumor, different layers of the tumor, etc., to capture diversity throughout the tumor.
In some embodiments, a tumor sample, lymph node sample, or other tissue sample is homogenized by placing the sample in a mechanical shearing device (e.g., a stirrer or sonicator). In some embodiments, homogenization produces a series of tissue fragments, each ranging from thousands to hundreds of cells. In some embodiments, the median size of the tissue fragments is inversely related to the energy of the agitator (or other suitable device); so that at high energies, the tissue fragments are very small. In some embodiments, the tissue component most relevant to the energy of the agitator is the collagen content, as the dermis requires a large amount of energy to completely dissociate. In some embodiments, the time of mixing is also important; however, the most effective clinical application requires dissociation of the entire tumor within minutes. Once the mixing time is determined, the energy required to achieve tumor dissociation within the desired time limit can be easily determined. Other methods of preparing tumor samples or lymph node samples are disclosed in PCT publication No. WO/2017/07976 and U.S. patent publication No. 2018/0320229, the disclosures of which are hereby incorporated by reference in their entirety. Aliquots can be removed from the homogenized sample for use in preparing genomic material for sequencing, such as described further herein.
After sufficient mechanical shearing to isolate the tumor, lymph node and/or other tissue sample, a subset of all tumor cells that were initially spatially isolated in the original sample will be distributed throughout the newly homogenized sample. That is, as a result of homogenizing the tumor, one or more lymph nodes, blood, or any combination thereof, any heterogeneity of cells within the tumor is substantially homogeneously (homogeneously) distributed within the resulting homogenate, or a portion or fraction thereof, such that the homogenate (or any fraction thereof) substantially homogeneously expresses heterogeneity of the tumor and/or lymph node sample as an input. By homogenizing tumors and/or lymph nodes to generate a sample (or homogenate) representative of the tumor as a whole, in certain embodiments, it is possible to characterize a characteristic of the tumor (such as heterogeneity), such as by sequencing gene variants present within the homogenized sample, as described herein.
In some embodiments, the input sample is derived from a sufficient number of histological sections and/or biopsy samples, e.g., obtained from a plurality of histological sections and/or a plurality of biopsy samples. In some embodiments, the input sample derived from the histological sections and/or biopsy samples comprises at least 0.2 micrograms of genomic material. In some embodiments, the input sample derived from the histological sections and/or biopsy samples comprises at least 0.3 micrograms of genomic material. In some embodiments, the input sample derived from the histological sections and/or biopsy samples comprises at least 0.4 micrograms of genomic material. In some embodiments, the input sample derived from the histological sections and/or biopsy samples comprises at least 0.5 micrograms of genomic material. In other embodiments, the input sample derived from the histological section and/or biopsy sample comprises at least 1 microgram of genomic material. In other embodiments, the input sample derived from the histological sections and/or biopsy samples comprises at least 5 micrograms of genomic material. In other embodiments, the input sample derived from the histological section and/or biopsy sample comprises at least 10 micrograms of genomic material.
In some embodiments, the amount of genomic material within the input sample for the disclosed methods is at least 10 times greater than the amount of material within the input sample for traditional sequence capture methods. In some embodiments, the amount of genomic material within the input sample for the disclosed methods is at least 50 times greater than the amount of material within the input sample for traditional sequence capture methods. In some embodiments, the amount of genomic material within the input sample for the disclosed methods is at least 100 times greater than the amount of material within the input sample for traditional sequence capture methods. In some embodiments, the amount of genomic material within the input sample for the disclosed methods is at least 250-fold greater than the amount of material within the input sample for traditional sequence capture methods. In some embodiments, the amount of genomic material within the input sample for the disclosed methods is at least 500 times greater than the amount of material within the input sample for traditional sequence capture methods. In some embodiments, the amount of genomic material within the input sample for the disclosed methods is at least 1000 times greater than the amount of material within the input sample for traditional sequence capture methods. In some embodiments, the amount of genomic material within the input sample for the disclosed methods is greater than about 1000-fold the amount of material within the input sample for traditional sequence capture methods.
Subsequent processing of homogenized samples
In some embodiments, the homogenized sample is further processed prior to downstream analysis. For example, the cells and/or genomic material may be separated from the homogenized sample, such as by filtering the homogenate. In some embodiments, the homogenate is filtered with a set of cell screens of different sizes (e.g., about 20um, about 10um, etc.). In some embodiments, a metal mesh is used to remove large tissue fragments prior to filtration with a cell screen. In some embodiments, the obtained filtered sample consists essentially of single cells (some small aggregates of cells, such as double cells) that can be stained with the desired marker.
In some embodiments, the cells in the homogenized sample or filtered homogenized sample are lysed to release the cellular components. For example, the cells may be lysed using a french press or similar type lysis device, microfluidizer, grinding, milling, chemical or enzymatic lysis, and/or using other techniques known in the art. In some embodiments, membrane lipids and proteins (including histones) are removed from a sample containing cellular components (e.g., by addition of surfactants or enzymes (proteases)). In addition, RNA can be removed from samples containing cellular components (e.g., with enzymes such as ribonucleases).
The homogenized sample (or filtered homogenized sample) may be further dissociated and/or processed to provide dissociated cells, nuclei, and/or small tissue aggregates. Generally, there are three main methods for tissue dissociation, including enzymatic, chemical and mechanical dissociation or any combination thereof. Dissociation methods are typically selected based on tissue type and tissue source.
Enzymatic dissociation is the process of using enzymes to digest tissue debris, thereby releasing cells from the tissue. Many different types of enzymes can be used in this process, and, as will be appreciated by those skilled in the art, certain enzymes are more effective on certain tissue types. One skilled in the art will also appreciate that any enzymatic dissociation process may use one or more enzymes in conjunction with each other, or in conjunction with other chemical and/or mechanical dissociation methods. Examples of suitable enzymes include, but are not limited to, collagenase, trypsin, elastase, hyaluronidase, papain, DNase I, neutrase, and trypsin inhibitors.
Collagenase is a proteolytic enzyme used to digest proteins found in the extracellular matrix. Unique to the enzyme protease, collagenase attacks and degrades the triple helix natural collagen fibers that are common in connective tissue. There are four basic collagenase types, namely: type 1, which is suitable for epithelial, liver, lung, adipose and adrenal tissue cell specimens; type 2, due to its high proteolytic activity, is suitable for use in tissues of cardiac, skeletal, muscular, thyroid and cartilage tumor origin; type 3, due to its low proteolytic activity, is suitable for breast cells; and type 4: due to its trypsin activity, it is suitable for use in pancreatic islets and other research protocols where receptor integrity is critical.
Trypsin is described as a pancreatic serine (an amino acid) protease with specificity for the peptide bond involving the carboxyl groups of arginine and lysine amino acids. It is considered to be one of the most highly specific proteases. Trypsin alone is generally ineffective for tissue dissociation because of its very low selectivity for extracellular proteins. It is usually used in combination with other enzymes (e.g. collagenase or elastase).
Elastase is another pancreatic serine protease that is specific for peptide bonds next to neutral amino acids. It has the unique ability to hydrolyze native elastin in proteases. Elastase is also found in blood components and bacteria. In some embodiments, it is suitable for isolating type II cells from lung tissue.
Hyaluronidase is a polysaccharidase that is commonly used for tissue dissociation when used in conjunction with more natural proteases such as collagenase. It has affinity for bonds present in almost all connective tissues.
Papain is a thiol protease that has a wide range of specificities and therefore degrades most protein substrates more thoroughly than pancreatic proteases (i.e., trypsin or elastase). Papain is commonly used to isolate neuronal material from tissues.
Deoxyribonuclease i (dnase i) is commonly included in enzymatic cell separation procedures to digest nucleic acids that leak into the dissociation medium and may address issues of increased viscosity and recovery. Without wishing to be bound by any particular theory, it is believed that dnase i does not destroy intact cells.
Neutral proteases, e.g. (available from Worthington Biochemical) is a bacterial enzyme with mild proteolytic activity.
 Can be used to isolate primary and secondary cell cultures because of its ability to maintain cell membrane integrity. It has been found that fibroblast-like cells can be isolated more efficiently than epithelial-like cells. It is inhibited by EDTA.
Trypsin inhibitors are derived primarily from soy, which inactivates trypsin and are therefore sometimes used in specific cell separation protocols.
Chemical dissociation exploits the fact that cations are involved in the maintenance of intracellular bonds and intracellular matrices. By introducing EDTA or EGTA that binds these cations, intercellular bonds are disrupted, allowing dissociation of the tissue structure.
In some embodiments, the DNA may be isolated, extracted, or purified by means known to those of ordinary skill in the art. For example, DNA can be extracted via ethanol precipitation or phenol-chloroform extraction, followed by centrifugation to form particles. In some embodiments, the DNA may be isolated or extracted on a solid phase column. In some embodiments, nucleic acid-binding beads can be used to isolate or extract DNA. In some embodiments, DNA may be separated or extracted by selective passage through a porous matrix based on physical, chemical, or electrical properties.
The extracted DNA (genomic material) may be dissolved in a buffer, e.g., an alkaline buffer, and introduced as an input sample for sequencing, as further explained herein.
Optional sorting of cells within homogenized samples
In some embodiments, the homogenized sample from step 100 is further sorted (step 110) prior to downstream processing. In some embodiments, sorting is performed using one or more biomarkers present on the cells. In some embodiments, dissociated cells and/or nuclei are labeled or stained prior to evaluating the homogenized sample by flow cytometry so that different cell types can be identified. The label or stain can be any detectable label or reporter moiety, such as a fluorescent label, that can identify different cell types by flow cytometry. For example, the homogenized sample may be first stained to detect the presence of one or more biomarkers, and then the cells may be sorted using flow cytometry based on whether the cells are stained or unstained. In some embodiments, the homogenized sample is contacted with one or more detection probes, which can be visualized by applying one or more detection reagents (see, e.g., PCT publication No. WO/2017/085307, the disclosure of which is incorporated herein by reference in its entirety). For example, in some embodiments, the detection probes utilized are specific for immune cell markers. As a further example, the cells may be stained for the presence of one or more biomarkers selected from: CD3, CD4, CD8, CD25, CD163, CD45LCA, CD45RA, CD45RO, PD-1, TIM-3, LAG-3, CD28, CD57, FOXP3, EPCAM and CK 8/18.
In some embodiments, sorting is accomplished using a size-based sorting procedure. In some embodiments, the size-based sorting step sorts the dissociated cell particles into a first cell particle population and a second cell particle population, wherein the first cell particle population is enriched in tumor cells and wherein the second cell particle population is enriched in normal cells. In some embodiments, the cell particles are cells, whereby the average diameter of normal cells is less than 12 μm, and whereby the average diameter of tumor cells is greater than 12 μm. In some embodiments, the size-based sorting step sorts the dissociated cell particles into a first nuclear population and a second nuclear population, wherein the first nuclear population is enriched for tumors and wherein the second nuclear population is enriched for normal nuclei. In some embodiments, the average diameter of normal nuclei is less than 8.5 μm, while the average diameter of tumor nuclei is greater than 8.5 μm. In some embodiments, sorting of the cellular particles is accomplished with a microfluidic device. In some embodiments, the size-based staining does not require a staining step. Other methods of size-based sorting are described in PCT publication No. WO/2018/189040, the disclosure of which is hereby incorporated by reference in its entirety.
Preparation of genomic Material for sequencing
After optional sorting of the genomic material, the genomic material is then prepared for sequencing (step 120). Methods of preparing genomic material for sequencing are described in U.S. patent application publication No. 2018/0320229, the disclosure of which is hereby incorporated by reference in its entirety. In some embodiments, the genomic material is fragmented to provide a fragmented genomic sample. In some embodiments, fragmentation of the genomic material is followed by repair or "polishing" of the ends of the fragmented genomic material. In some embodiments, a fragmented nucleic acid sample (e.g., fragmented genomic DNA, cDNA, etc.) is modified by ligation with an adaptor on one or both of the 5 'end and the 3' end. The genomic material is then denatured according to procedures known to those of ordinary skill in the art to isolate complementary DNA strands.
The denatured genomic material is then subjected to a hybridization reaction, wherein the hybridization reaction mixture includes, for example, DNA capture probes with nucleic acid sequences complementary to targets within the genomic material, Cot1 fraction blocking DNA (to block non-specific hybridization), and blocking oligonucleotides (step 200). The DNA capture probes can be biotinylated for subsequent immobilization using streptavidin-coated beads or surfaces, or immobilized directly on a solid support (such as a microarray). Following hybridization, the non-targeted and unbound nucleic acids are washed from the solid support and the bound, targeted nucleic acids are eluted from the microarray or capture beads or capture surface, according to methods known in the art. In some embodiments, after hybridization of genomic material to biotinylated DNA capture probes, streptavidin-coated beads are incubated with the hybridized genomic material such that the hybridized genomic material is immobilized via streptavidin-biotin bonds, and any non-targeted genomic material is removed by washing (bead capture) (step 210). The captured genomic material is then eluted and provided for sequencing, or first amplified prior to sequencing.
Sequencing of the genetic Material prepared
Sequencing (step 220) may be performed according to any method known to one of ordinary skill in the art. In some embodiments, the sequencing methods include Sanger sequencing and dye terminator sequencing, as well as next generation sequencing technologies such as pyrosequencing, nanopore sequencing, microwell-based sequencing, nanosphere sequencing, MPSS, SOLiD, Illumina, ionic torrent, Starlite, SMRT, tSMS, sequencing-by-synthesis, ligation sequencing, mass spectrometry sequencing, polymerase sequencing, RNA polymerase (RNAP) sequencing, microscopy-based sequencing, microfluidic Sanger sequencing, microscopy-based sequencing, RNAP sequencing, tunnel current DNA sequencing, and in vitro virus sequencing. See WO2014144478, WO2015058093, WO2014106076 and WO2013068528, each of which is hereby incorporated by reference in its entirety.
In some embodiments, sequencing can be performed by a variety of different methods, such as by sequencing using synthetic techniques. Sequencing by synthesis according to the prior art is defined as any sequencing method that monitors the formation of by-products after integration of a particular deoxynucleoside triphosphate during the sequencing reaction (Hyman, 1988, anal. biochem. 174: 423 436; Rhonaghi et al, 1998, Science 281: 363-365). One prominent example of sequencing by synthesis is the pyrophosphate sequencing method. In this case, the generation of pyrophosphate during nucleotide integration is monitored by an enzymatic cascade that results in the generation of a chemiluminescent signal. The 454 genome sequencer system (Roche Applied Science catalog No. 04760085001) (an example of sequencing by synthesis) is based on the pyrophosphate sequencing technology. For sequencing on the 454 GS20 or 454FLX instrument, the average genomic DNA fragment size was in the range of 200bp or 600bp, respectively, as described in the product literature.
In some embodiments, sequencing by synthesis reaction may alternatively be based on the terminator dye type of the sequencing reaction. In this case, the incorporated dye deoxynuclear triphosphate (ddNTP) building block comprises a detectable label, which is preferably a fluorescent label that prevents further extension of the nascent DNA strand. The label is then removed and detected, for example, by integrating the ddNTP building block into the template/primer extension hybrid using a DNA polymerase containing 3 '-5' exonuclease or proofreading activity.
In some embodiments, sequencing is performed using a next generation sequencing method, such as that provided by Illumina, Inc. Without wishing to be bound by any particular theory, Illumina next generation sequencing technology uses clonal amplification and Sequencing By Synthesis (SBS) chemistry to achieve rapid, accurate sequencing. This process simultaneously identifies the DNA bases while integrating them into the nucleic acid strand. Each base, when added to a growing strand, emits a unique fluorescent signal that is used to determine the ordering of the DNA sequence.
Sequencing data set
After sequencing (step 220), the sequencing data may be analyzed so that multiple gene variants may be identified, i.e., gene variants may be identified within the sequencing data derived from sequencing the homogenized sample. In some embodiments, the identified gene variants may be cloned or subcloned. In some embodiments, Mutect is used to detect variants within sequencing data (see https/software. broadinstruction. org/cancer/cga/mutet; see also U.S. patent publication No. 2015/0178445, the disclosure of which is hereby incorporated by reference in its entirety).
In some embodiments, the neoantigen is derived from an identified gene variant (step 300). In some embodiments, derivation of the neoantigen enables drug discovery, vaccine generation, and/or CAR-T cell engineering (step 301). For example, Ott et al, "An immunogenic personal neoantigen vaccine for tissues with melanoma," Nature, Vol.000, 00Month 2017, doi: 10.1038/nature22991 (the disclosure of which is hereby incorporated by reference in its entirety) describes the process of generating vaccines against neoantigens. Similarly, Sahin et al, "Personalized RNA molecules vacines biological immunity approach cancer," Nature, Vol.000, 00Month 2017, doi: 10.1038/nature23003, the disclosure of which is incorporated herein by reference in its entirety, describes an RNA-based multiple epitope approach to mobilize immunity against a variety of cancer mutations in humans. Thus, in some embodiments, after sequencing the homogenized tumor sample according to the methods described herein, a vaccine can be generated based on the derived neoantigen or neoantigens. In some embodiments, the method further comprises administering to the subject an effective amount of a vaccine.
In other embodiments, a ctDNA monitoring set may be developed based on the identified gene variants (step 310). In some embodiments, the ctDNA set may be used to monitor gene variants that may lead to distal resetting (step 311).
In still other embodiments, the clonal structure can be calculated based on the identified gene variants (step 320). In some embodiments, the calculated clonal structure can be used to assess the separation between truncated variants and subcloned variants (step 321).
Examples of the invention
Current tumor sequencing methods are hampered by physical sampling bias, where the input tissue is only extracted from a narrow spatial frame, which will miss subclones that expand at other distal locations. This is a difficult problem that cannot be solved by excessive sequencing depth. To check the severity of the problemTo the extent we analyzed pan-cancer sequencing data on cancer genomic maps, we showed that current protocols sampled on average only 2.3% of the tumor mass (median, n ═ 1, 667 samples in all stages), which decreased to 0.5% (median, n ═ 181) for stage IV tumors (fig. 4A). We further investigated this model in a routine clinical setting by performing molecular profiling on randomly selected case audits within the main cancer treatment center as part of standard treatment (see methods). This indicates that the median tumor sampling ratio was only 0.0005% (n ═ 76 cases) (fig. 4B), reflecting the minimal input material available from standard pathological tumor slides. The remaining 99.9% + tumor tissue was not sampled for molecular profiling purposes, resulting in a high level of undersampling. The "sampling theory" developed by Pierre Gy fully accounts for traps employing non-representative sampling methods1And has been proved in practice in a plurality of fields within the range of food pollution, voting and mining industry2-4. In the case of tumor sequencing, this bias appears in the context of intratumoral heterogeneity, a well-documented feature of cancer5-7In addition to molecular profiling as a tool for targeted or immunotherapeutic treatment of patients, its utility is increasing8. Failure to solve this problem may undermine the clinical utility of genomic medicine in cancer; by decreasing sensitivity of detecting prognostic markers or neoantigen targets for immunotherapy, sequencing results between biopsy results lack reproducibility, and subcloned variants are mis-assigned as clones due to biased variant allele frequency values. A frequently proposed solution is to perform multi-region sampling, although this may be done in a research environment5But can be prohibitively expensive and labor intensive for large-scale clinical practice. Furthermore, the recurrent question of "how many biopsies should be taken" cannot be answered because of the large difference in tumor heterogeneity between patients. We hypothesize that these limitations can be overcome by using a new sampling methodology that uses residual surgical material to create a broader, more representative sampling range without adding additional sampling stepsBetter results were obtained with increased sequencing depth, and without the need for multiple sample analyses for each tumor.
To first test this hypothesis, we performed a pilot experiment to expand the sampling range by pooling DNA extracted from n-1, 184 multi-zone biopsies (from n-79 primary solid tumors) to create a "mixed" solution for each tumor (fig. 4C). The pooled samples were subjected to next generation sequencing (median depth: 674X) and mutation detection was compared to previously generated single biopsies (reflecting current clinical practice, median depth: 608X) and multi-region biopsy (truth set) data (median depth: 612X). All samples were processed by the same protocol (see methods). In all 79 tumors, mixed samples found a median of 100% of truth set mutations (range [ 30% -100%)]) In contrast, the median discovery rate for a single biopsy sample was only 73% [ 15% -100%]It supports the following assumptions: a wider sampling range may improve the sensitivity of the detection variants (p 6.6x 10)-11Paired Wilcoxon test, fig. 4E and fig. 4F). Furthermore, Variant Allele Frequencies (VAFs) from mixed samples had a strong correlation (r 0.97) with true VAF values from multi-region sequencing, and a higher correlation (r 0.69) relative to that obtained from a single biopsy sample (fig. 4D). This suggests that a wider sampling range provides a more accurate estimate of the true cellular mutation incidence throughout the tumor mass, which is an important consideration for both prognostic and predictive biomarkers.
Based on these experimental results, we next sought to develop a novel tumor sampling methodology to allow sequencing of input materials extracted from as wide a sampling range as possible. Here we demonstrate a novel method called "representational sequencing" (Rep-Seq), which involves homogenizing solid tumor masses into well-mixed solutions in conjunction with next generation sequencing (FIG. 5A). The source of tumor mass is all residual tumor material not used for pathology assessment after surgery, which would otherwise be considered clinical waste and destroyed. The residual samples accounted for an average of 54.8% of the total tumor volume, and provided an average of 223.5g of tissue per tumor (based on our case trial cohort, see table S1). These values are significantly increased relative to a sample average of 0.0006% and tumor tissue of 0.0001g, currently used as a sampling range in standard molecular profiling methods. After formalin-fixed residual tumor tissue was dissected from surrounding normal tissue, the residual tumor mass was homogenized into a representative solution.
From this well-mixed solution, samples were extracted for DNA extraction, library preparation and sequencing (fig. 5A). Rep-Seq was applied in 11 tumors from 4 different cancer types based on proof of concept (Table S1). The first treated tumor was Rep-Seq1, a large clear cell renal cell carcinoma (ccRCC) tumor (17 cm in maximum size) that was selected to be widely sampled for cross-validation. A total of 68 fresh frozen individual biopsies were taken from the primary tumor and the remaining formalin-fixed residual block (1258 g of tissue) was homogenized according to the Rep-Seq protocol. To determine the variant profile in this tumor, an aliquot of 7 spatially incoherent primary biopsies and Rep-Seq samples (median 162x depth) was first selected for Whole Exome Sequencing (WES), resulting in a total of 76 non-synonymous mutations (SNV and small-scale insertions/deletions) being found.
These 76 mutations were then captured in the target custom group and sequenced at 68 primary biopsies, 11 biopsies taken from 2 lymph node metastases, 4 biological Rep-Seq replicates (primary tumors), 6 circulating tumor (ct) DNA samples collected at different time points, and 3 homogenized lymph node Rep-Seq samples (one lymph node not used for biopsy sampling) at high depth (median 15, 402x depth) (fig. 5B). The development of targeted custom groups is described in US publication No. 2009/0246788, the disclosure of which is hereby incorporated by reference in its entirety. This integrated data set was used to fully evaluate the Rep-Seq methodology (FIG. 5C). First, we evaluated the reproducibility of each method, comparing the Jaccard similarity index between paired combinations of primary tumor biopsies versus paired biological replicates of Rep-Seq and ctDNA time points. Median pairwise similarity between biopsies was 0.77, indicating that in singletonApproximately one-fourth of the mutations found in individual biopsies were not reproducible in subsequent biopsy samples. In contrast, at 0.95(p ═ 9.9x10⁻⁷Figure 5D), where each repeat found nearly identical lists of mutations (figure 2 c). Pairwise similarity between plasma ctDNA samples was low (overall median similarity index 0.24, fig. 5C to 5D), which reflects technical challenges in ctDNA analysis.
Furthermore, it should also be recognized that the duration of the tumor evolves over ctDNA time points, however we note that even though there is a substantial difference between close time points (e.g., P16 and P20 are only 21 days apart), there are no common mutations. The mutations detected by Rep-Seq are mainly clonal (in every cancer cell) or events in the major subclones, whereas biopsy sequencing often detects low frequency minor subclonal changes, which are present in only a small fraction of tumor cells. Minor subclonal mutations have been well documented and are often of interest in research settings (literature references), however, for clinical utility, definitive identification of true clonal variation and high levels of reproducibility are often more important goals. Furthermore, the benefit of a wider sampling range, which detects clonal and major subclonal mutations, may lead to a higher overall variant detection rate relative to single biopsy analysis (since the latter may miss subclonal mutations present in spatially distant tumor regions). Higher mutation detection rates may be particularly important in the design of personalized adoptive cell therapy or vaccine immunotherapy, and we note that the average number of neoantigens found using the Rep-Seq method is significantly higher (+ 19%) (average neoantigen across Rep-Seq biological replicates is 185, average of sequenced individual biopsies is 155, p is 0.011, fig. 7).
Next, we investigated the utility of Rep-Seq in determining clonal structure, as measures of clonal diversity have been shown to correlate with prognosis9,10. Cancer Cell Fraction (CCF) estimates were first calculated for all mutations (n 76) within the Rep-Seq1 primary tumor biopsy set (n 52 biopsies controlled by clonal quality), and then grouped asThe clusters were mutated to infer the true-base clonal structure (see methods). Four different tumor clones were detected: clone a (truncated clone, 100.0% mutations per cancer cell CCF, 41 mutations), and (sub) clone B (CCF 45.6%, 6 mutations), C (CCF 52.8%, 3 mutations), and D (CCF 17.1%, 2 mutations) (fig. 6A). The clustering process was repeated for individual Rep-Seq samples (n ═ 1), and then the cloning solutions were compared between the methods (fig. 6A). Rep-Seq correctly clustered all 41 clonal mutations into a truncated clone a (CCF ═ 100.0%) and identified the major (sub) clone B (CCF ═ 40.6%) and C (CCF ═ 33.3%) (fig. 6A). The lowest frequency subclones (clone D, CCF ═ 17.1%) were not detected in the Rep-Seq samples as distinct clusters, reflecting the challenge in accurately grouping low frequency mutations. The cancer cell fraction estimates derived from these two methods were validated by physical mapping of the spatial biopsy location and the presence of mutations, returning to the images of the tumor sections: 20 (sub) clones B (38.4%) were found in 52 primary biopsies, while 32 (sub) clones C (61.5%) were found in 52 cases (FIG. 6B). This confirms the presence of two major, spatially distinct subclones. Interestingly, the lymph node metastases LN1 and LN2 were disseminated only by clone B, whereas the spatial proximal perirenal lymph node sample LN (pr) was polyclonal, with clones B and C present.
Next, the individual mutant CCFs within each sample were considered in order to assess how well the separate truncation events (i.e., the mutations cloned in or present in each cancer cell) (clone a) came from the subclonal mutations (clone B and clone C). Within the Rep-Seq samples, the CCF estimate for the cloning event (clone A) was clearly separated from (sub-) clones B and C, which reflected a rapid convergence of the CCF estimate to true values in Rep-Seq (FIG. 6C). In contrast, the CCF distribution in a single sample biopsy overlapped between clones A, B and C, with sub- (clones) B and C at Often appear as clones (incorrect) ("clonal illusion") in a single biopsy. On average, in 52 primary biopsiesIn the above-mentioned formula (B), when 17% (range is (6% -35%)]) When considered as a single region, the clonal variant of (a) suffered from the clonal illusion (fig. 6D) (including all 76 mutations, see methods).
Even with multi-region biopsy sampling, there is still an illusion of clonality; the simulations show that two random biopsies yield clonality illusions of 9% [ 0% -25% ], three ═ 6% [ 0% -25% ], four ═ 4% [ 0% -15% ] and five ═ 3% [ 0% -15% ] (fig. 6D). Furthermore, since three-dimensional sampling is performed along the z-axis, these results are likely to represent a conservative estimate of the true illusion of cloning efficiency. We note that if normal two-dimensional tumor slice sampling was performed on slice 4 only, while slice 4 was monoclonality for clone C, then no biopsy number could prevent the illusion of clonality (fig. 6B), and there is a concern that clone B (which metastasizes to the lymph nodes) will be missed completely.
Given the broad applicability of fluid biopsies, and previous studies, it has been shown that both clonal and subclonal mutations can be identified11A related problem is how well the ctDNA sample in plasma represents true clonal diversity compared to a representative sample of a primary tumor. We investigated this problem with the opportunity to have well-characterized primary tumors and 6 longitudinal ctDNA time points. At the pre-operative time points (P1 and P10), variants of both clone A, B and C could be detected at 0.1% -1.0% VAF, however many variants were missed, including some clone a truncation events, reflecting the technical challenge of analysis of ctDNA. The average VAF within clone a was overall higher than for (sub) clones B and C, however a large inconsistency was observed for the individual variants and across time points (fig. 6E). At post-operative time point P16, the highest VAF variant was actually from clone C, and similarly at time point P20, the mutation of clone B was highest, all higher than the truncation mutation of any clone a (fig. 6E). However, at a later stage time point (at necropsy), all clonal mutations were detected with a highly consistent VAF frequency (fig. 6E).
Correlation coefficients for VAF from ctDNA ranged from r-0.17 (time point P16) to r-0.78 (necropsy pleural fluid) compared to biopsy counts with mutations present. Rep-Seq CCF correlates most strongly with biopsy count data, where r is 0.90. This suggests that inferring de novo clonal structure from ctDNA alone is still challenging, whereas the tracking clonal markers that have been previously identified from tumor tissue still have high information value (e.g., for minimal residual disease tracking (MRD)). We note that in the context of MRD follow-up, a larger set of variants may increase the sensitivity of detecting earlier time-point relapses, e.g. in Rep-Seq1 data at time point p16, the MRD set of single biopsy designs missed disease relapses 53% of the time compared to 0% with a missed detection rate using Rep-Seq samples (table S2). In terms of the cloning kinetics of Rep-Seq1, an interesting pattern was observed in which clone C disappeared and became undetectable at a later ctDNA time point (FIG. 6E). This supports the predicted metastatic dissemination pattern determined by biopsy and Rep-Seq analysis, i.e. clone B achieved distant metastatic dissemination, while clone C was contained within the renal (peripheral) region (fig. 6B). As an additional validation, copy number analysis was also performed on an additional 43 biopsies taken from 20 different anatomical sites of metastatic disease present at the time of Rep-Seq1 necropsy. All sites contained 14q loss, a driving event found only in clone B of the primary tumor (fig. 8). We note that in single region biopsy sequencing; metastatic clone B will be lost 32 times (61.5%) in 52.
As a technical feasibility study, the Rep-Seq method was also performed in another 10 cases. Cases Rep-Seq2 and Rep-Seq3 are additional ccRCC tumors and appear to have predominantly a monoclonal structure (FIG. 6F). Cases Rep-Seq4 to Rep-Seq10 were tumors in primary sites of breast, colorectal and lung, and tumor-specific driver mutations were successfully detected in all specimens. The highest mutation load was observed in Rep-Seq7 (colon), with 980/251 non-synonymous SNV/Indel, and the presence of COSMIC mutation signatures 6 and 15 associated with mismatch repair deficiency (FIG. 6G), confirmed by IHC showing loss of MHL 1. Characterization of three non-small cell lung carcinoma (NSCLC) tumors (Rep-Seq8, Rep-Seq9, Rep-Seq10) revealed evidence of the unique presence of feature 4 (smoking-related) only in these three tumors (FIG. 6G). Thus, the characteristics of the mutations derived from Rep-Seq are consistent with the expected pattern. Finally, an additional benefit of tissue homogenization is the ability to add during the cell sorting step to enrich for higher tumor purity.
As proof of principle, Rep-Seq11 (colorectal tumors) were flow sorted, preferentially selecting tumor cells based on the presence of cytokeratins 8 and 18. Full exome sequencing was first performed on a standard sample (unsorted, depth 221X) from the Rep-Seq protocol, which showed a tumor purity of 0.44. At the same overall bulk sample sequencing depth and cost, significant enrichment was observed in the flow sorted Rep-Seq samples (depth 215X) with a purity of 0.89, which resulted in approximately doubled coverage of efficient tumor cell sequencing (from 90X to 184X) (fig. 6H). In terms of variant discovery, a total of 365 non-synonymous SNVs were observed between both the standard and flow sorted samples, followed by an additional 68 mutations uniquely found in the flow sorted sample (an increase of + 19%), probably due to the increased sensitivity from the higher effective tumor depth (fig. 6H). Only 5 mutations (1.4% of the total) were found to have the opposite pattern, i.e. present in the standard sample but absent in the flow sorting, indicating that flow sorting did not produce systematic bias, thereby excluding some tumor subclones.
In summary, Rep-Seq effectively implements a bias-free tumor sampling method that extracts DNA molecules from a well-mixed homogenized solution of all residual surgical tumor material, thereby eliminating the spatial bias inherent to current single and multi-zone biopsy methods. We show that a wider sampling range leads to an overall improved sensitivity for detecting mutations, with trade-offs of reduced resolution to detect smaller (sub-) clones, but with the ability to fully determine the location of all major subclones. This trade-off is acceptable in clinical settings, in which case the less frequent mutations may not be as directly contributing as the widely spread clonality or major sub-clonality driving events. The reproducibility of the results in Rep-Seq is significantly higher than current single biopsy sequencing methods (at the same equivalent sequencing depth) and higher accuracy is also obtained in determining clones from subclonal variants.
Materials and methods
Research group
As previously described, cases Rep-Seq1, Rep-Seq2 and Rep-Seq3 were diagnosed with renal cell carcinoma and were approved for study by the TRACERx Kidney study (11/LO/1996 approval by the national institutes of health services research Ethics Committee)5. The residual surgical material of cases Rep-Seq4, Rep-Seq5, Rep-Seq6, Rep-Seq7, Rep-Seq8, Rep-Seq9, Rep-Seq10 and Rep-Seq11 was obtained from commercial suppliers of research specimens from IRB-approved American hospitals (GLAS Consultants, Winston-Salem, NC. (IRB #: 120160685) and The MT Group, Van Nuys, CA (MTG-015)).
Clinical review of current molecular profiling practices
Approval of the institutional review board for service evaluation was obtained to quantify tumor volume as a standard of care for routine diagnosis in resected colorectal, melanoma and sarcoma tumors (SE725), with both surgery and molecular profiling performed by the royal massden NHS foundation of london, england. A list of cases from 2016 to 2018, 5 months, was obtained for each tumor type and reviewed. Cases were included if >2 macroscopic tumor sizes were recorded in the histopathology report, and if information on the number and thickness of slides used for molecular profiling was available.
Regional biopsy and Mixed sample preparation
Multi-zone and single-zone biopsy sampling of surgically excised tumor tissue using the same methods as previously described5. A pooled sample was created for each tumor by pooling the extracted DNA obtained from all single regions of each tumor in equimolar ratios (as shown in fig. 4A-4F). The median of 9 single-field samples were combined for each mixture.
Summation and homogenization of Rep-Seq1 tissue
Following diagnostic histological sampling and removal of fresh biopsies, three different clinical surgical waste tissues were isolated from radical renal nephrectomy (Rep-Seq1) containing: 1) primary tumor, 2) periaortic lymph node cluster, and 3) nodes of the hilum fixed in 10% neutral buffered formalin for 24 hours to mimic standard clinical workflow. After fixation, the samples were changed to Phosphate Buffered Saline (PBS) for 24 hours and then stored in ethanol until dissected. The pathologist identifies the tumor tissue by macroscopic evaluation and physical palpation, and dissects all identifiable tumors from the surrounding tissue. The pathologist also dissects and retains a region of normal tissue (at least 5cm from the tumor). Lymph nodes detected during gross examination of Rep-Seq1 specimens, including the pulmonary and perirenal lymph nodes, were also dissected as independent tissue samples. All dissected tissues were weighed prior to homogenization.
Dividing the residual primary tumor tissue into two portions, each portion being 625 g; each aliquot was combined with 600ml of autoMACS Running Buffer (Miltenyi Biotec Inc., 130-. Primary tumor homogenates (2.5 liters total) were mixed manually and in plastic containers, split and liquefied again for additional homogenization and mixing, and combined together into one large plastic container. Using a disposable mixing vessel, IKA Tube Mill (IKA Works Inc. Wilmington North Carolina, 0004180001) was run in an automatic MACS Running Buffer (1: 1, mass: volume) at 15,000rpm for 2 minutes, and the isolated tissues of the renal portal pulmonary lymph node, perirenal lymph node, normal renal tissue, and periaortic lymph node were each homogenized. When the tissue mass exceeds the capacity of a single blender vessel, the homogenates of the same sample are combined by mixing as described above. Samples of each tissue homogenate were stored in methanol (1: 1, v: v) at 4 ℃. Cases Rep-Seq2 and Rep-Seq3 were primary renal tumors only and were treated by the same protocol.
Standard methods for residual organization (SMRT) processing
For cases Rep-Seq4 through Rep-Seq11, formalin-fixed, residual tumor tissue was obtained from commercial suppliers of research specimens from IRB-approved U.S. hospitals (GLAS Consultants, Winston-Salem, NC. and The MT Group, Van Nuys, Calif.). For diagnosis and staging, each specimen is subjected to standardized sampling. These cases are considered surgical waste and will be ready for incineration and therefore are preserved in formalin for four to six weeks. After arrival, the tissue was transferred to PBS for 12 to 24 h. The pathologist identifies the tumor tissue by macroscopic evaluation and physical palpation, and dissects all identifiable tumors from the surrounding tissue. The pathologist also dissects and retains a region of normal tissue (at least 5cm away from the tumor). All dissected tissues were weighed prior to homogenization. The dissected tumor and normal tissues were homogenized in autoMAC buffer (1: 1, m: v) at 15,000rpm for 2 minutes in a disposable blender container (IKA Works Inc. Wilmington North Carolina, 0004180001) or a disposable consumer grade blender (Hamilton Beach, 51102, Glen Allen, Va.), respectively. The filters were from Pluriselect (San Diego, Calif.). The buffers used were from the following companies: CC1 (950-. Tween 20 was purchased from Fisher Scientific, USA (AC 233362500). DAPI (D9542) and pepsin (P7012) were purchased from Sigma in the united states. Proteinase K (0706) is from the United states VWR. Mouse anti-cytokeratin 8/18 antibody (760-4344) was from Ventana Medical Systems. Goat anti-mouse antibodies conjugated to Alexa Fluor 488(A-11001) and Alexa Fluor 647(A-21236) were purchased from Invitrogen. The homogenate was stored at 4 ℃ until further processing.
Purification of genomic DNA from tissue and cfDNA
Aliquots (1200. mu.l) of each homogenate were collected by centrifugation at 5000rcf for 2 min, rinsed twice with TE buffer pH 8.0 (VWR, AAJ62745-EQE), and incubated for 2-16 hours at 56 ℃ in 5ml of protease digestion buffer [9.75ml of TE buffer pH 8.0, 60mg of proteinase K (VWR, 0706), and 0.25ml of 20% SDS in water (Amresco, 0837) ]. The digested tissue (100. mu.l) was used for genomic DNA purification by High Pure PCR purification kit (Roche Applied Sciences, Mannheim Germany, 11732668001) according to the manufacturer's protocol. The purified genomic DNA was quantified using NanoDrop 8000(Thermo Fisher Scientific) and stored at-20 ℃. cfDNA was isolated from plasma using a cobas cfDNA sample preparation kit (Roche, 07247737190).
Construction and sequencing of target-rich NGS libraries
An Illumina-compatible indexed NGS library was constructed from genomic DNA of tissues using SeqCap EZ HyperCap workflow user guide, v1.0(Roche Sequencing Solutions), and the following defined parameters were specified. Briefly, 1g of purified genomic DNA was enzymatically fragmented at 37 ℃ for 33-40 minutes and prepared for ligation of adaptors using the KAPA HyperPlus library preparation kit according to the manufacturer's instructions (Roche Sequencing Solutions, KK 8514). SeqCap sequencing adapters final reaction concentration was 2M and adapter ligation reaction time was extended to 14-18h at 16 ℃. No pre-capture PCR was used after ligation purification. Target enrichment groups (Roche Sequencing Solutions) and 2nM blocking oligonucleotides (Roche Sequencing Solutions) were incubated at 47 ℃ for 18-22 hours, according to manufacturer's instructions, for MedExome (07681330001), Onco _ EZ (08333076001), or SeqCap EZ library probe baits specific to custom Rep-Seq1 (see data analysis section below for design criteria). Post-capture PCR was performed for 14 cycles using KAPA HiFi HotStart ReadyMix and LM-PCR oligonucleotides. The purified library concentration after capture was determined by qubit (thermofisher) and the fragment size distribution was analyzed by Bioanalyzer 2100 (Agilent). The amplified enriched libraries were each diluted to 2nM and stored at-20 ℃ before being pooled for sequencing. The pooled libraries were sequenced using the MiSeq and HiSeq instrument (Illumina) according to the manufacturer's recommendations, for paired-end sequencing using (Illumina) run 101 base-paired-end reads. cfDNA sequencing libraries were constructed using the AVENIO ctDNA targeting kit (Roche, 08061076001) following AVENIO ctDNA analysis kit reagent workflow user guidelines v1.0.0. The amplified, adaptor-ligated samples were concentrated with the hybridization replenisher using a Vacufuge plus instrument (Eppendorf). Each sample was resuspended in the appropriate enhanced oligonucleotide, custom Rep-Seq1 proprietary set, and hybridization premix. Enrichment, hybridization clearance and amplification were performed according to the manufacturer's instructions. Will be provided withSamples (equal masses) were pooled and sequenced using hiseq (illumina) with 151 base-paired end reads according to the instructions. As shown in FIG. 1, the preparation and sequencing of the renal driver Panel _ v6 library was performed on multi-regional, mixed-regional, and single-regional samples from 79 renal cell carcinomas using the methods previously described5. Multi-region full exome library preparation and sequencing of Rep-Seq1 was performed by external laboratories (Eurofins Scientific) using the Agilent SureSelect Human All Exon v5 kit.
Flow sorting method to improve tumor purity
Representative samples of formalin-fixed residual tumor tissue from Rep-Seq11 were generated by homogenization in autoMACS buffer (1: 1 mass to volume ratio) in an IKA stirrer. Aliquots (1g) of the homogenate were further dissociated into single nuclei by using the method described previously12. Briefly, tissues were harvested by centrifugation, resuspended in CC1 buffer (5: 1 mass to volume) and heated at 80 ℃ for 30 minutes. The tissue was washed once with PBS and then resuspended in PBS containing 1mg/ml proteinase K (1: 1 mass to volume ratio) and incubated at 50 ℃ for 10 minutes. The sample was replaced with pepsin 5mg/ml in 150mM NaCl (pH 1.5) and incubated for 30 minutes at 37 ℃. The samples were adjusted to pH 8 with 5M NaOH and changed to PBS, 0.5% BSA and 0.5% Tween 20, then filtered through a 20 micromolar filter to collect nuclei.
Nuclei were then collected by centrifugation at 400 Xg and exchange with antibody diluent for 30 minutes at 20 ℃. Samples were exchanged directly from the dispenser for mouse anti-cytokeratin 8/18 primary antibody for 1 hour at 4 ℃, washed three times in 0.5ml PBS, 0.1% BSA, and 0.1% Tween 20, and incubated for 30 minutes at 4 ℃ in goat anti-mouse antibody conjugated with Alexa Fluor 488 or Alexa Fluor 647(2 micrograms/ml) and DAPI (3 μ M). Stained samples were washed and filtered prior to analysis and sorting using a BD FACS Aria (656700, Becton Dickinson) equipped with a 355nm, 60mW laser and 450/50nm filter for DAPI; 488nm, 60mW laser and 530/30nm filter for AF 488; and a 633nm, 100mW laser and 670/30nm filter for AF 647. No compensation is used. DAPI is used for dual recognition. After gating, the Rep-Seq11 tumor nuclei were enriched by FACS, with the gating involving cytokeratin positive (CK +), high Side Scatter (SSC) nuclei, while excluding cytokeratin negative (CK-), low SSC nuclei.
Data and statistical analysis
Tumor volume sampling analysis
For clinical review data, all samples had available data on width (W) and length (L) dimensions, and tumor volume (T _ V) was estimated using the following formula:
T_V=(W2×L)/2
(obtained from the literature, is the most accurate method for measuring tumor volume13)。
Based on 2D surface area analysis of 8 typical slides, biopsy volumes (B _ V) were calculated, where each slide was scanned AT 40x using an Aperio AT2 full slide scanner. Each image was manually annotated, following the perimeter of the tissue, and the surface area was calculated via the use of Aperio ImageScope software. Average surface area of 3.37cm2And this value was multiplied by the slide thickness (10 μm) and the total number of slides used to obtain a B _ V estimate for each tumor. We note that in the case of multiple slides used for molecular profiling (up to 5 were used), each slide was taken from the same block (i.e. all taken from one fixed spatial location). The proportion of the total tumor volume sampled in each case was then simply calculated as B _ V/T _ V. For cancer genomic mapping (TCGA) dataset analysis, we extracted an abstract clinical annotation file for each solid tumor population from the Broad Institute TCGA GDAC firefose repository. Tumor size data for n-1667 samples for a total of 6 tumor types were available: ACC, KICH, KIRC, KIRP, PAAD and THCA. From the above, the tumor volume (T _ V) was calculated using the following formula: t _ V ═ W2X L)/2. Given only one dimension (i.e., the largest dimension), it is assumed to be the tumor length and the tumor width is estimated using an L: W ratio of 1: 0.8, with the 0.8 standard value being estimated as the median ratio value observed in all cases with the available length and width data. According to the clinical conditionThe exact length (L), width (W) and depth (D) dimensions given in the annotation file are used to calculate the biopsy sample volume, where the biopsy shape is assumed to be a cuboid and the biopsy volume (B _ V) is calculated as B _ V ═ L × W × D. In the absence of biopsy size in the clinical annotation file, the standard biopsy volume (B _ V) was assumed to be 0.48cm based on the median of all other benchmarks of available data3. The proportion of the total tumor volume sampled in each case was then simply calculated as B _ V/T _ V.
Sequencing data processing
Paired-end reads in FastQ format sequenced by Hiseq were aligned to the reference human genome (built hg19) using a Burrows-Wheeler Aligner (BWA) v0.7.15, with the spreading recursion (-c flag) set to 1000014. Intermediate processing of the Sam file is performed using Samtools v1.3.1, and Picard 1.81 (seehttp:// broadinstitute.github.io/picard/) Deduplication is performed. For the whole exome and kidney driver Panel _ v6 sequencing datasets, Single Nucleotide Variant (SNV) calls were performed using Mutect v1.1.7, and small scale insertion/deletion (INDEL) was referred to as running VarScan v2.4.1 in somatic mode with a minimum variant frequency (-min-var-freq) of 0.005 and a tumor purity estimate (-tumor-purity) of 0.75, followed by validation using Scalpel v0.5.3 (using the intersection between the two calls) in somatic mode15-17. The SNV called by Mutect was further filtered using the following criteria: i) variant Allele Frequency (VAF) in the corresponding germline sample is ≦ 1%, ii) variants that fall into the mitochondrial chromosome, haplotype chromosome, HLA gene, or any intergenic region are not considered, iii) the presence of both forward and reverse strand reads supporting the variant. For the custom Rep-Seq1 set of sequencing data, sequencing was performed at high depth using unique molecular barcode (UMI) indexing and using UMI tools18The PCR repeat reads and the de-repeat reads are grouped so that each group produces one read. Then calling SNV using deepSNV19Because mutmutmutut is known not to be able to be calibrated for higher sequencing depth levels. As described above, Varscan and Scalepel were used to invoke Rep-Seq1 custom groupsINDEL. All variants were annotated using Annovar20. To estimate changes in somatic copy number, CNVkit v0.7.3 was performed on paired tumor normal sequencing data with default parameters21. Outliers of log 2-ratio (logR) calls derived from CNVkit were detected and modified using median absolute deviation Winsorization prior to case-specific joint segmentation to identify genomic fragments of constant logR22. ABSOLUTE v1.0.6 was used to estimate purity, ploidy and ABSOLUTE copy number per fragment of tumor samples23. Derivation of neoantigen predictions by first determining 4 HLA types per patient and mutations in HLA class I genes using POLYSOLVER24. Next, all possible 9, 10 and 11-mer mutant peptides were calculated based on the somatic non-synonymous SNV and INDEL mutations detected in each sample. Using NetMHCpan (v3.0) and NetMHC (v4.0), one can predict the binding affinity of mutants to the corresponding wild-type peptides associated with the corresponding POLYSOLVER deduced HLA allele25. New antigen binding agents are defined as IC50 < 50nM or grade<2.0. All non-synonymous mutations were characterized using the software package deconstructSigs26. We also examined Rep-Seq data for evidence of formalin-induced artifact variants, as this protocol involves formalin-exposed material. Formalin Fixed Paraffin Embedded (FFPE) samples may contain artifacts, which are typically caused by the hydrolytic deamination of cytosine to form uracil or thymine (if cytosine is methylated). Such artifacts typically show up as excess C at lower variant allele frequencies>T/G>Mutation A27. Analysis of this in whole exome sequencing data from Rep-Seq cases showed no evidence of low frequency formalin induced excessive artifacts, of which low frequency (below 5% VAF) C>The proportion of T mutations was 34.0% which was very close to the average of all base changes (33.3%) (FIG. 9).
Analysis of pooled Mixed sequencing data
The final set of mixed samples included 79 tumors with matched processed reference datasets from multi-region sequencing. Each timeThe number of biopsies for each mixed sample ranged from 2 to 75, with a median biopsy per tumor of 8 and a total number of individual biopsies of 1184. As a reference dataset for true variants, we used a previously issued multi-region sequencing variant call from the same case, representing the sum of all variants detected in each tumor5. In our analysis, we compared the overall performance of single-region sequencing and mixed sequencing to detect somatic mutations from a known truth set. From the entire multi-regional dataset, single-region samples were selected as one random single-region biopsy per tumor. We first evaluated the performance of the hybrid sequencing method compared to multi-region and single-region sequencing by comparing the number of somatic variants detected in each tumor by each method. To reflect the average performance of single-region biopsies, we calculated the average number of variants detected by single-region sequencing per tumor. Next, we determined the detection rate of the authentic variants in the mixed and single-region samples using the multi-region sequencing data as a reference. Significance was assessed using a paired Wilcoxon test. Finally, to determine the accuracy of the mixed sequencing method, we next determined the correlation between Variant Allele Frequency (VAF) of all somatic mutations detected by multi-region sequencing and VAF in the mixed sample and randomized single-region biopsy of each tumor. The multi-region VAF was calculated as the average VAF of all regions included in the mixture. The relevance is calculated by Spearman's rank relevance test.
Custom group design
To perform in-depth validation of representative sequencing methods, case Rep-Seq1 was analyzed using a custom set of high coverage profiles. Panel design was based on the results of whole exome sequencing of: i) 7 biopsies taken from Rep-Seq1 primary tumors (before homogenization), and ii) aliquots of the Rep-Seq1 homogenized solution. As described above, SNV and INDEL mutations were called out in 8 samples and 76 non-synonymous mutations were detected in total. These 76 mutations were successfully captured in the target custom group and sequenced at 68 primary biopsies, 11 biopsies taken from 2 lymph node metastases, 4 biological primary Rep-Seq replicates, 6 circulating tumor (ct) DNA samples collected at different time points, and 3 homogenized lymph node Rep-Seq samples at high depth (median 15, 402 x).
Jaccard repeatability analysis
Jaccard similarity coefficients were used to assess the reproducibility of variant findings between Rep-Seq1 primary tumor biopsies (n-68), Rep-Seq biological replicates (n-4), and ctDNA samples (n-6). Each pairwise combination between samples (within each group) is considered, e.g. biopsy 1(a) vs biopsy 2(B), biopsy 1(a) vs biopsy 3(B), etc. The Jaccard similarity coefficient was calculated using the standard formula (J):
J=M11/(M01+M10+M11)
wherein M is11Represents the total number of variants, M, present in both sample A and sample B10Represents the total number of variants present in A but absent in B, M01Represents the total number of variants present in B but absent from a.
Clustering and phylogenetic analysis
Performing cluster analysis on Rep-Seq1 custom group data using PyClone Dirichlet Process clustering28. For each mutation, the observed surrogate allele counts, reference counts, and total local tumor copy number were used as inputs along with the purity of each sample. The PyClone runs 10,000 iterations and 1000 prefiring are performed with the default parameter of-var _ prior total _ copy _ number. Two separate PyClone runs were performed, the first run being for a primary multi-zone biopsy dataset. Of the total n-68 primary biopsies sequenced, n-52 passed quality control for cluster analysis, with n-16 biopsies excluded due to low purity (measured based on the inability to correctly recall known clone 3p copy number loss events due to low purity). Using the same parameters, a second PyClone clustering run was performed on only the Rep-Seq homogenate samples (n ═ 1).
Illusion of clone simulation
To assess the risk of clonality illusion, a Rep-Seq1 dataset was used, simulating a biopsy sampling method, with 1 to 20 biopsies sampled. For each biopsy number (n ═ 1-20), randomly sized biopsy samples were taken from the total set of 68 primary biopsies analyzed for Rep-Seq 1. Within the random sampling set, the number of mutations that appeared to be clonal was calculated (based on the mutations that were prevalent in all biopsies in the sampling set). This list was then compared to a known list of true clonal mutations (from the complete 68 sets) and the percentage of variants misclassified as clonal was recorded. This process was repeated 100 iterations for each n to give a distribution from which mean and standard deviation values could be calculated.
Analysis of purity-enriched data
For Rep-Seq11, whole exome sequencing was performed using the standard Rep-Seq protocol, followed by repeated additional steps of flow sorting purity enrichment. As described above, variant calling was completed and purity estimates were calculated in the same manner in both samples. The number of variants found in each sample was counted, and then the number of variants common to the samples was counted and plotted in fig. 6.
Table legend
Table S1-characteristics of 11 representative samples from various tumor types. Tumor volumes were calculated using dimensions taken from clinical pathology reports. Tumor homogenates contained an average of 54.8% of the initial tumor volume.
Table S2-comparison of minimal residual disease ctDNA tracking group, biopsy versus Rep-Seq.
Technical Field
The present disclosure relates to methods of identifying gene variants in a sample, such as a representative sample. In some embodiments, the method involves the generation of a ctDNA monitoring set based on a plurality of gene variants identified in a sample (such as a representative sample).
Reference to the literature
1.Gy,P.Heterogeneite,Echantillonnage,Homogeneisation(Heterogeneity,Sampling,Homogenizing).xiv+607p(Masson:Paris)(1988).
2.Rohde,A.Sampling and Homogenization Strategies Significantly Influence the Detection of Foodbome Pathogens in Meat.BioMed Research International(2015).
3.Crespi,I.Pre-Election Polling:Sources of Accuracy and Error.(1988).
4.David,M.Handbook of Applied Advanced Geostatistical Ore Reserve Estimation.Elsevier:Amsterdam(1988).
5.Turajlic,S.et al.Deterministic Evolutionary Trajectories Influence Primary Tumor Growth:TRACERx Renal.Cell 173,595-610e511(2018).
6.Jamal-Hanjani,M.et al.Tracking the Evolution of Non-Small-Cell Lung Cancer.The New England journal of medicine 376,2109-2121(2017).
7.Warrick,J.I.et al.Intratumoral Heterogeneity of Bladder Cancer by Molecular Subtypes and Histologic Variants.European urology(2018).
8.Consortium,A.P.G.AACR Project GENIE:Powering Precision Medicine Through An International Consortium.Cancer discovery(2017).
9.Miao,D.et al.Genomic correlates of response to immune checkpoint blockade in microsatellite-stable solid tumors.Nature genetics 50,1271-1281(2018).
10.McGranahan,N.et al.Clonal neoantigens elicit T cell immunoreactivity and sensitivity to immune checkpoint blockade.Science 351,1463-1469(2016).
11.Abbosh,C.et al.Phylogenetic ctDNA analysis depicts early-stage lung cancer evolution.Nature 545,446-451(2017).
12.Hedley,D.W.,Friedlander,M.L.,Taylor,I.W.,Rugg,C.A.&Musgrove,E.A.Method for analysis of cellular DNA content of paraffin-embedded pathological material using flow cytometry.The journal of histochemistry and cytochemistry:official journal of the Histochemistry Society31,1333-1335(1983).
13.Faustino-Rocha,A.et al.Estimation of rat mammary tumor volume using caliper and ultrasonography measurements.Lab animal 42,217-224(2013).
14.Li,H.&Durbin,R.Fast and accurate short read alignment with Burrows-Wheeler transform.Bioinformatics 25,1754-1760(2009).
15.Cibulskis,K.et al.Sensitive detection 0f somatic point mutations in impure and heterogeneous cancer samples.Nat Biotechnol 31,213-219(2013).
16.Fang,H.et al.Indel variant analysis of short-read sequencing data with Scalpel.Nat Protoc 11,2529-2548(2016).
17.Koboldt,D.C.et al.VarScan:variant detection in massively parallel sequencing of individual and pooled samples.Bioinformatics 25,2283-2285(2009).
18.Smith,T.,Heger,A.&Sudbery,I.UMI-tools:modeling sequencing errors in Unique Molecular Identifiers to improve quantification accuracy.Genome research 27,491-499(2017).
19.Gerstung,M.et al.Reliable detection of subclonal single-nucleotide variants in tumor cell populations.Nature communications 3,811(2012).
20.Wang,K.,Li,M.Y.&Hakonarson,H.ANNOVAR:functional annotation of genetic variants from high-throughput sequencing data.Nucleic Acids Res 38(2010).
21.Talevich,E.,Shain,A.H.,Botton,T.&Bastian,B.C.CNVkit:Genome-Wide Copy Number Detection and Visualization from Targeted DNA Sequencing.Plos Comput Biol 12(2016).
22.Nilsen,G.et al.Copynumber:Efficient algorithms for single-and multi-track copy number segmentation.Bmc Genomics 13(2012).
23.Carter,S.L.et al.Absolute quantification of somatic DNA alterations in human cancer.Nat Biotechnol 30,413-421(2012).
24.Shukla,S.A.et al.Comprehensive analysis of cancer-associated somatic mutations in class I HLA genes.Nature biotechnology 33,1152-1158(2015).
25.Andreatta,M.&Nielsen,M.Gapped sequence alignment using artificial neural networks:application t0 the MHC class I system.Bioinformatics32,511-517(2016).
26.Rosenthal,R.,McGranahan,N.,Herrero,J.,Taylor,B.S.&Swanton,C.DeconstructSigs:delineating mutational processes in single tumors distinguishes DNA repair deficiencies and patterns of carcinoma evolution.Genome biology 17,31(2016).
27.W0ng,S.Q.et al.Sequence artefacts in a prospective series of formalin-fixed tumors tested for mutations in hotspot regions by massively parallel sequencing.BMC medical genomics 7,23(2014).
28.Roth,A.et al.PyClone:statistical inference of clonal population structure in cancer.Nat Methods 11,396-398(2014).
While the disclosure has been described with reference to a number of illustrative embodiments, it should be understood that numerous other modifications and embodiments can be devised by those skilled in the art that will fall within the spirit and scope of the principles of this disclosure. More particularly, reasonable variations and modifications are possible in the component parts and/or arrangements of the subject combination arrangement within the scope of the foregoing disclosure, the drawings and the appended claims without departing from the spirit of the disclosure. In addition to variations and modifications in the component parts and/or arrangements, alternative uses will also be apparent to those skilled in the art.

Supplementary Table 2
Comparison of minimal residual disease ctDNA tracking groups designed based on Rep-Seq or biopsy sequencing of tumor tissue. The overall median number of mutations detected from all Rep-Seq and each time point in the biopsy replicates is given and below is the complete data set for all individual samples. The percentage difference in the number of mutations detected is shown. The percentage of the number of times MRD will be missed ("% _ MRD _ missed") is also shown, assuming that at least >3 unique tumor mutations need to be detected in ctDNA to reliably confirm disease recurrence.


Claims (21)
1. A method of identifying a plurality of gene variants in a sample, the method comprising:
(a) homogenizing one or more tumor samples to provide a homogenized sample;
(b) preparing genomic material isolated from the homogenized sample for sequencing; and
(c) identifying the plurality of gene variants within sequencing data derived from sequencing the prepared genomic material.
2. The method of claim 1, further comprising determining whether the identified plurality of gene variants are cloned or subcloned.
3. The method of claim 2, wherein the one or more neoantigens are derived from a defined subcloning mutation.
4. The method of any one of the preceding claims, further comprising generating a ctDNA monitoring set based on the identified plurality of gene variants.
5. The method of claim 4, wherein the generated ctDNA monitoring set is used to determine a response to a therapy.
6. The method of claim 4, wherein the generated ctDNA monitoring set is used to determine an evolutionary track of a cancer.
7. The method of claim 4, wherein the generated ctDNA monitoring set is used to predict response to a future treatment strategy.
8. The method of claim 4, wherein the generated ctDNA monitoring group is used to determine the presence or absence of cancer in a patient during or after therapy.
9. The method of claim 4, wherein the generated ctDNA monitoring panel is used to determine the presence of cancer in a patient after remission of disease, after a complete response to therapy, or after diagnosis of an undetectable disease.
10. The method of claim 4, wherein the generated ctDNA monitoring panel is used to detect minimal residual disease after surgical removal of a primary tumor.
11. The method of claim 4, wherein the generated ctDNA monitoring set is used to detect minimal residual disease after surgical removal of metastatic tumors.
12. The method of any one of claims 10 and 11, wherein the primary tumor and metastatic tumor are removed during the same surgery and the ctDNA monitoring test comprises variants detected in multiple tumors from a single patient.
13. The method of any one of the preceding claims, further comprising calculating a clonal structure based on the identified plurality of gene variants.
14. The method of claim 13, wherein the calculating of the clonal structure comprises: (i) calculating a cancer cell score estimate for each of a plurality of identified gene variants; and (ii) grouping the calculated cancer cell fraction estimates into mutation clusters.
15. The method of claim 14, further comprising evaluating the isolation of a single identified gene variant.
16. The method of any one of the preceding claims, further comprising sorting cellular particles within the homogenized sample prior to preparing the genomic material.
17. The method of claim 16, wherein the sorting of the cellular particles is based on size.
18. The method of claim 16, wherein sorting of the cellular particles is based on the presence of one or more biomarkers.
19. The method of claim 2, further comprising: assessing whether the human subject is at increased risk for rapid disease progression if one or more high risk subclone variants are identified within the plurality of identified genetic variants.
20. The method of claim 2, further comprising determining a treatment strategy based on the identification of one or more specific subcloned variants within the plurality of identified genetic variants.
21. The method of any one of the preceding claims, wherein the plurality of gene variants are identified using Whole Genome Sequencing (WGS), Whole Exome Sequencing (WES), Single Nucleotide Polymorphism (SNP) analysis, deep sequencing, targeted gene sequencing, Polymerase Chain Reaction (PCR), or any combination thereof.
Applications Claiming Priority (3)
| Application Number | Priority Date | Filing Date | Title |
|---|---|---|---|
| US201862772650P | 2018-11-29 | 2018-11-29 | |
| US62/772650 | 2018-11-29 | ||
| PCT/US2019/062857 WO2020112566A1 (en) | 2018-11-29 | 2019-11-22 | Personalized ctdna disease monitoring via representative dna sequencing |
Publications (1)
| Publication Number | Publication Date |
|---|---|
| CN113383089A true CN113383089A (en) | 2021-09-10 |
Family
ID=69005824
Family Applications (1)
| Application Number | Title | Priority Date | Filing Date |
|---|---|---|---|
| CN201980078983.1A Pending CN113383089A (en) | 2018-11-29 | 2019-11-22 | Personalized ctDNA disease monitoring via representative DNA sequencing |
Country Status (5)
| Country | Link |
|---|---|
| US (1) | US20220064733A1 (en) |
| EP (1) | EP3887547A1 (en) |
| JP (1) | JP7479367B2 (en) |
| CN (1) | CN113383089A (en) |
| WO (1) | WO2020112566A1 (en) |
Families Citing this family (7)
| Publication number | Priority date | Publication date | Assignee | Title |
|---|---|---|---|---|
| CN105190656B (en) | 2013-01-17 | 2018-01-16 | 佩索纳里斯公司 | Method and system for genetic analysis |
| US10125399B2 (en) | 2014-10-30 | 2018-11-13 | Personalis, Inc. | Methods for using mosaicism in nucleic acids sampled distal to their origin |
| US11299783B2 (en) | 2016-05-27 | 2022-04-12 | Personalis, Inc. | Methods and systems for genetic analysis |
| EP4055610A4 (en) | 2019-11-05 | 2023-11-29 | Personalis, Inc. | ESTIMATION OF TUMOR PURITY FROM INDIVIDUAL SAMPLES |
| EP4413580A4 (en) | 2021-10-05 | 2025-08-13 | Personalis Inc | PERSONALIZED TESTS FOR PERSONALIZED CANCER MONITORING |
| US20250000906A1 (en) | 2021-11-16 | 2025-01-02 | Sotio Biotech Inc. | Treatment of myxoid/round cell liposarcoma patients |
| US20230392212A1 (en) * | 2022-06-03 | 2023-12-07 | Saga Diagnostics Ab | Detection of target nucleic acids |
Citations (1)
| Publication number | Priority date | Publication date | Assignee | Title |
|---|---|---|---|---|
| WO2018189040A1 (en) * | 2017-04-14 | 2018-10-18 | Ventana Medical Systems, Inc. | Size-based separation of dissociated fixed tissues |
Family Cites Families (11)
| Publication number | Priority date | Publication date | Assignee | Title |
|---|---|---|---|---|
| US20090246788A1 (en) | 2008-04-01 | 2009-10-01 | Roche Nimblegen, Inc. | Methods and Assays for Capture of Nucleic Acids |
| GB2497510A (en) | 2011-11-10 | 2013-06-19 | Harry Cuppens | Methods for determining mononucleotide sequence repeats |
| WO2014036167A1 (en) | 2012-08-28 | 2014-03-06 | The Broad Institute, Inc. | Detecting variants in sequencing data and benchmarking |
| US10138519B2 (en) | 2012-12-28 | 2018-11-27 | Quest Diagnostics Investments Incorporated | Universal sanger sequencing from next-gen sequencing amplicons |
| US20140278461A1 (en) | 2013-03-15 | 2014-09-18 | Memorial Sloan-Kettering Cancer Center | System and method for integrating a medical sequencing apparatus and laboratory system into a medical facility |
| JP2017500004A (en) | 2013-10-18 | 2017-01-05 | セブン ブリッジズ ジェノミクス インコーポレイテッド | Methods and systems for genotyping gene samples |
| EP3799005B1 (en) | 2015-07-07 | 2025-07-23 | Ilumi Solutions, Inc. | A method for resetting a device or turning a computer program on |
| KR102771841B1 (en) * | 2015-11-06 | 2025-02-24 | 벤타나 메디컬 시스템즈, 인코포레이티드 | Representative diagnostics |
| WO2017085307A1 (en) | 2015-11-22 | 2017-05-26 | Ventana Medical Systems, Inc. | Methods of identifying immune cells in pd-l1 positive tumor tissue |
| EP3402896B1 (en) * | 2016-01-15 | 2021-03-31 | Ventana Medical Systems, Inc. | Deep sequencing profiling of tumors |
| WO2017165463A1 (en) * | 2016-03-22 | 2017-09-28 | Counsyl, Inc. | Combinatorial dna screening |
-
2019
- 2019-11-22 CN CN201980078983.1A patent/CN113383089A/en active Pending
- 2019-11-22 WO PCT/US2019/062857 patent/WO2020112566A1/en not_active Ceased
- 2019-11-22 JP JP2021530795A patent/JP7479367B2/en active Active
- 2019-11-22 EP EP19827883.0A patent/EP3887547A1/en active Pending
-
2021
- 2021-05-07 US US17/314,958 patent/US20220064733A1/en active Pending
Patent Citations (1)
| Publication number | Priority date | Publication date | Assignee | Title |
|---|---|---|---|---|
| WO2018189040A1 (en) * | 2017-04-14 | 2018-10-18 | Ventana Medical Systems, Inc. | Size-based separation of dissociated fixed tissues |
Non-Patent Citations (2)
| Title |
|---|
| ANGEL E. DAGO等: "Rapid Phenotypic and Genomic Change in Response to Therapeutic Pressure in Prostate Cancer Inferred by High Content Analysis of Single Circulating Tumor Cells", PLOS ONE, vol. 9, no. 8, pages 1 - 9 * |
| STEFFEN DIETZ等: "Low Input Whole-Exome Sequencing to Determine the Representation of the Tumor Exome in Circulating DNA of Non-Small Cell Lung Cancer Patients", PLOS ONE, vol. 11, no. 8, pages 1 - 16 * |
Also Published As
| Publication number | Publication date |
|---|---|
| JP7479367B2 (en) | 2024-05-08 |
| JP2022511787A (en) | 2022-02-01 |
| WO2020112566A1 (en) | 2020-06-04 |
| US20220064733A1 (en) | 2022-03-03 |
| EP3887547A1 (en) | 2021-10-06 |
Similar Documents
| Publication | Publication Date | Title |
|---|---|---|
| Litchfield et al. | Representative sequencing: unbiased sampling of solid tumor tissue | |
| JP7479367B2 (en) | Individualized ctDNA disease monitoring by representative DNA sequencing | |
| JP7821415B2 (en) | Residual disease detection system and method | |
| Hennigan et al. | Low abundance of circulating tumor DNA in localized prostate cancer | |
| Ledergor et al. | Single cell dissection of plasma cell heterogeneity in symptomatic and asymptomatic myeloma | |
| Macagno et al. | Wholistic approach: transcriptomic analysis and beyond using archival material for molecular diagnosis | |
| Nassar et al. | Genomic landscape of carcinogen-induced and genetically induced mouse skin squamous cell carcinoma | |
| Zhang et al. | Deep single-cell RNA sequencing data of individual T cells from treatment-naïve colorectal cancer patients | |
| Heitzer et al. | Tumor-associated copy number changes in the circulation of patients with prostate cancer identified through whole-genome sequencing | |
| WO2019108807A1 (en) | Process for microsatellite instability detection | |
| Tuononen et al. | Targeted resequencing reveals ALK fusions in non‐small cell lung carcinomas detected by FISH, immunohistochemistry, and real‐time RT‐PCR: a comparison of four methods | |
| Alexander et al. | Utility of single-cell genomics in diagnostic evaluation of prostate cancer | |
| Stanta et al. | Tumour heterogeneity: principles and practical consequences | |
| Xiao et al. | Non‐invasive diagnosis and surveillance of bladder cancer with driver and passenger DNA methylation in a prospective cohort study | |
| JP2020511933A (en) | Methods for cancer detection | |
| WO2023197004A1 (en) | Detecting the presence of a tumor based on methylation status of cell-free nucleic acid molecules | |
| Liang et al. | Long insert whole genome sequencing for copy number variant and translocation detection | |
| Wu et al. | Elucidating the pathogenesis of synchronous and metachronous tumors in a woman with endometrioid carcinomas using a whole-exome sequencing approach | |
| Blanco-Heredia et al. | Converging and evolving immuno-genomic routes toward immune escape in breast cancer | |
| Tan et al. | Neoadjuvant immunotherapy in mismatch-repair-proficient colon cancers | |
| US20250078955A1 (en) | Detecting the presence of a tumor based on methylation status of cell-free nucleic acid molecules | |
| Cheng et al. | Whole genome error-corrected sequencing for sensitive circulating tumor DNA cancer monitoring | |
| Wang et al. | Explosive tumor growth in a patient with colon cancer is associated with reduced neoantigen levels and decreased interferon-gamma (IFN-γ) signaling | |
| Wilmott et al. | Tumour procurement, DNA extraction, coverage analysis and optimisation of mutation-detection algorithms for human melanoma genomes | |
| WO2023114203A1 (en) | Genotyping of targeted loci with single-cell chromatin accessibility |
Legal Events
| Date | Code | Title | Description |
|---|---|---|---|
| PB01 | Publication | ||
| PB01 | Publication | ||
| SE01 | Entry into force of request for substantive examination | ||
| SE01 | Entry into force of request for substantive examination |