Disclosure of Invention
The invention aims at: the method for quantifying the diversity of the recommendation system aims to solve the problems that the current recommendation system lacks an evaluation index, and the data volume is huge.
The technical scheme adopted by the invention is as follows:
the quantification method of the diversity of the recommendation system comprises the following steps:
step 1, acquiring URL and user information from a log, and setting URL types in advance according to classification words, and storing related information in the same file;
step 2, compiling a program to classify and primarily screen URLs, and storing the URLs which can be classified and have clear classification items to form three graphs of category-URL-user;
step 3, importing the values in the obtained triples into a MySQL database, screening repeated data from the mySQL database, screening out the URL access times of the user for more than 2 times for the second time, and respectively exporting the URL access times according to categories to obtain three graphs of a plurality of categories;
step 4, programming the three graph ideas and calculating to obtain a Herfindahl diversity index and a calibrated Herfindahl diversity index, and calculating the calibrated diversity index of each category and the proportion of the calibrated diversity index in the total category to obtain the diversity index of the recommendation system:
wherein S represents the name of the recommendation system, T represents the set of categories of URLs, v represents a certain category in the T set, count (v) represents the total number of URLs under the v category, count (T) represents the total number of URLs of all categories in the T set, T is the set of users, u represents a certain user node in the T set, chd (v, u) represents the value of the calibrated Herfindahl diversity index of the category v, chd (S) represents the value of the calibrated Herfindahl diversity index of the recommendation system.
In the technical scheme of the application: a three-graph calibration based terkindahl diversity index was presented by which the diversity of the recommendation system was quantified. Firstly, classifying URLs according to a set classification mode; further designing and forming three graphs of user-URL-category; secondly, the original Herfindahl index is improved, so that the influence of the quantity difference on diversity is effectively reduced; finally, the improved Herfindahl diversity index is combined to obtain a diversity index of the recommendation system, the variety of the category of the recommendation system is quantified, the diversity index is incorporated into an evaluation system when the recommendation system is evaluated, the diversity index is used as one of evaluation criteria, and meanwhile, the optimization of the recommendation system and the improvement of a recommendation algorithm can be provided with assistance.
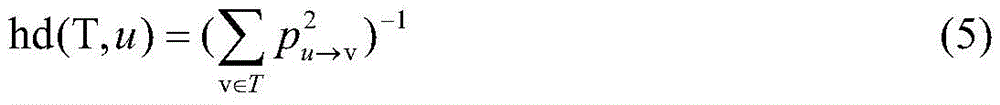
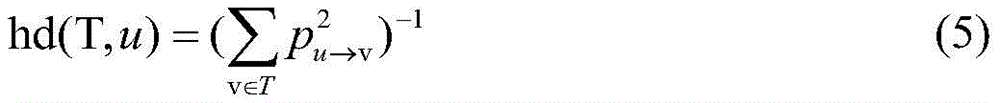
Preferably, in step 4, the diversity index of the terfindahl is expressed by a probability distribution of formal random walk, that is, the terfindahl index defining the T class and the node u in use of T is:
wherein T is a set of URL categories, T is a set of users, p represents probability, u represents a certain user node in the T set, v represents a certain category in the T set, hd (T, u) represents the value of the Herfindahl index of the user u in the set T.
Preferably, the calibrated terfindahl diversity index in step 4 is: chd (T, u),
wherein Rand (T) represents a three-part graph formed by random access under a T set when a user accesses a URL, T is a set of URL categories, u represents a certain user node in a set of T, chd (T, u) represents a value of a calibrated herpandal diversity index of the set T, hd (Rand (T), u) represents a value of a herpandal index of the user u in the randomly generated set Rand (T), and hd (T, u) represents a value of a herpandal index of the user u in the set T.
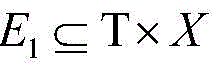
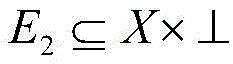
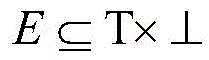
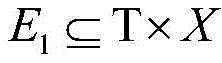
Preferably, the URL three-part graph is formed by associating points on one independent set with points on another independent set, defining the three-part graph as a triplet b= (T, ∈e), and constructing the three-part graph according to information in the search engine log of the dongle, specifically defining T as a set of URL categories, T as a set of users,
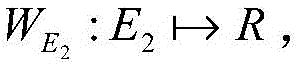
is a collection of URL categories and user contact relationships; for each node v E T, defining its neighbor set N (v) = { u E T (u, v) E } and defining node u E T in a similar manner, neighbor set N (u) = { v E T (u, v) E }; the set size of adjacent points is called degree: d (u) = |n (u) |; also, a bipartite graph is defined to represent the relationship between URLs and categories, and based thereon, the two bipartite graphs are combined to form a three-part graph T= (T, X, ∈E) for analyzing the complete structure of user activities
1 ,E
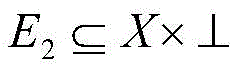
2 ) Wherein T is the set of types of URLs, X is the set of URLs, T is the set of users, +.>
Is a set of URL types and URL relationships, +.>
Is a collection of URL and user relationships.
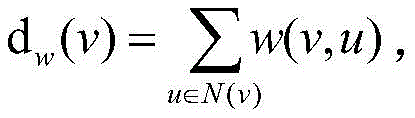
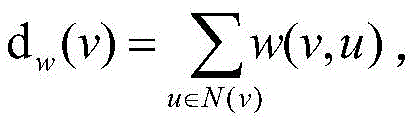
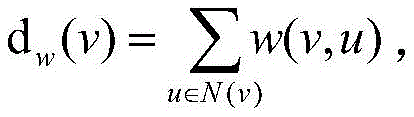
More particularlyPreferably, the weight function of the number of accesses of the user and the URL
The degree of weighting is defined as:
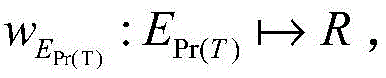
analyzing the relation between the category and the user activity by analyzing the bi-directional projection of T through the three graphs, wherein the bi-directional projection is defined as Pr (T) = (T, ∈E)
Pr(T) ) Wherein
If the three graphs are weighted, the projection will give a weighting function +.>
It is defined as:
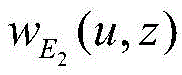
wherein T is a set of URL categories, u represents a certain user node in the set of T, v represents a certain category in the set of T, z represents a certain URL in the set of X,
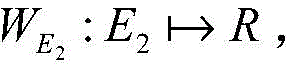
weighting function representing a bi-directional projection between a category v and a user u, w
E2 (u, z) is represented in the relation set E
2 In this regard, the weighting function of user u with respect to some term z in the URL set, N (v) represents the set of neighbors of v, N (u) represents the set of neighbors of u,
after the setting of the three graphs is completed, when the relationship between the user and the category is analyzed, the conventional distance quantification is abandoned, random walk in the three graphs is relied on, probability distribution of different URLs belonging to the category v is calculated, any node v epsilon T is defined, z epsilon X is defined, and the probability from z to v is defined as follows:
where T is the set of types of URLs and X is the set of URLs. v denotes a certain category in the T set, z denotes a certain URL in the X set, w (z, v) denotes a weighting function of the node z in the URL set to the category v, d w (z) represents the weighting of node z in the URL collection,
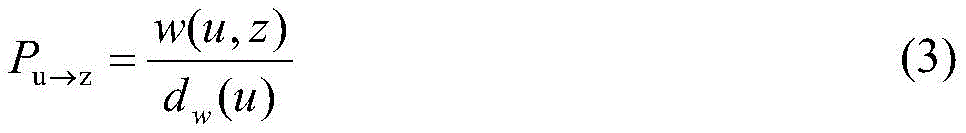
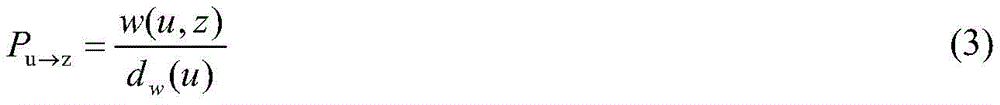
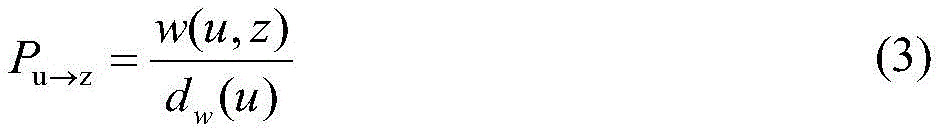
similarly, for any node z e X, u e T, the probability from u to z is defined as:
wherein X is the set of URLs, T is the set u of users representing a certain user node in the set of T, z represents a certain URL in the set X, w (u, z) represents a weighting function of the user u to the node z in the set of URLs, d w (u) represents the degree of weighting of the node u in the user set,
the probability of getting from u to v is:
wherein T is the set of URL types, X is the set of URLs, T is the set of users, u represents a certain user node in the set of T, z represents a certain URL in the set of X, and v represents a certain category in the set of T.
In this application, herfindahl is Hefendale;
URL: uniform Resource Locator, uniform resource locator;
in summary, due to the adoption of the technical scheme, the beneficial effects of the invention are as follows:
1. in the invention, the category of the recommendation system is quantified by a plurality of varieties, and when the recommendation system is evaluated, the diversity index of the application is incorporated into an evaluation system and is used as one of evaluation standards;
2. in the invention, the optimization of a recommendation system and the improvement of a recommendation algorithm can be provided with help;
3. in the invention, the three graphs can well reflect the connection between the top node and the bottom node, thereby providing help for researching user behaviors and analyzing category audiences;
4. in the invention, the randomness of the user access is defined as probability distribution from T to T, and the probability can be quantized by calculating the probability;
5. according to the invention, through analysis and research on the user logs of the dog search engine, the diversity index of the recommendation system obtained through experiments is found to realize the description of the diversity of the recommendation system.
Detailed Description
The present invention will be described in further detail with reference to the drawings and examples, in order to make the objects, technical solutions and advantages of the present invention more apparent. It should be understood that the specific embodiments described herein are for purposes of illustration only and are not intended to limit the scope of the invention.
Example 1
The quantification method of the diversity of the recommendation system comprises the following steps:
step 1, acquiring URL and user information from a log, and setting URL types in advance according to classification words, and storing related information in the same file;
step 2, compiling a program to classify and primarily screen URLs, and storing the URLs which can be classified and have clear classification items to form three graphs of category-URL-user;
step 3, importing the values in the obtained triples into a MySQL database, screening repeated data from the mySQL database, screening out the URL access times of the user for more than 2 times for the second time, and respectively exporting the URL access times according to categories to obtain three graphs of a plurality of categories;
step 4, programming the three graph ideas and calculating to obtain a Herfindahl diversity index and a calibrated Herfindahl diversity index, and calculating the calibrated diversity index of each category and the proportion of the calibrated diversity index in the total category to obtain the diversity index of the recommendation system:
wherein S represents the name of the recommendation system, T represents the set of categories of URLs, v represents a certain category in the T set, count (v) represents the total number of URLs under the v category, count (T) represents the total number of URLs of all categories in the T set, T is the set of users, u represents a certain user node in the T set, chd (v, u) represents the value of the calibrated Herfindahl diversity index of the category v, chd (S) represents the value of the calibrated Herfindahl diversity index of the recommendation system.
The construction method of the diversity index mainly comprises the steps of programming three graphs by Python according to the construction thought of the three graphs of the URL, reproducing the three graphs, and calculating the diversity index of the Herfindahl and the calibrated diversity index of the Herfindahl by combining the probability distribution of random walk.
Example 2
As shown in fig. 1, on the basis of example 1, the herford diversity index (Herfindahl diversity index) represents formally random walks with probability distributions, i.e. the herfordamhl index defining the T category and node u in the user of Γ is:
wherein T is a set of URL categories, T is a set of users, p represents probability, u represents a certain user node in the T set, v represents a certain category in the T set, hd (T, u) represents the value of the Herfindahl index of the user u in the set T.
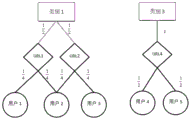
When the Herfindahl index is high, it indicates that the categories tend to be more evenly distributed; when the Herfindahl index is low, this class of audience is shown to be more concentrated. The value of the Herfindahl index is limited by the number of categories, which is reached when the distribution is uniform. In the three figures, the present application analyzes category 1 and category 3:
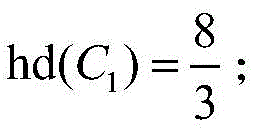
both category 1 and category 3 have access to two URLs, three diagrams for user 2 and user 4 are shown in fig. 1.
Class 1 (C)
1 ) Whose Hefydal coefficient is known by calculation
Class 3 (C)
3 ) Is of the Hd (C)
3 ) The values of
class 1 are larger for =2, which may indicate that
class 1 is more widely subject to a number of factors, as is the case. In this way, quantification of diversity is achieved.
Example 3
Based on example 2, the herfasahl diversity index calibrated in step 4 is: chd (T, u),
wherein Rand (T) represents a three-part graph formed by random access under a T set when a user accesses a URL, T is a set of URL categories, u represents a certain user node in a set of T, chd (T, u) represents a value of a calibrated herpandal diversity index of the set T, hd (Rand (T), u) represents a value of a herpandal index of the user u in the randomly generated set Rand (T), and hd (T, u) represents a value of a herpandal index of the user u in the set T.
In the random three-part graph forming process, the user access times are assumed to be constant, any URL is randomly selected to be accessed, and the calibrated diversity index can further reduce the difference of the Herfindamhl indexes generated for different amounts of categories in the user access process.
Example 4
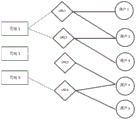
As shown in fig. 2 and 3, on the basis of
embodiment 1, the URL three-part graph is defined as a triplet b= (T, ∈e) by associating points on one independent set with points on another independent set, and is constructed according to information in the dog search engine log, specifically, T is defined as a set of URL categories, ∈is defined as a set of users,
is a collection of URL categories and user contact relationships; for each node v E T, defining its neighbor set N (v) = { u E T (u, v) E } and defining node u E T in a similar manner, neighbor set N (u) = { v E T (u, v) E }; the set size of adjacent points is called degree: d (u) = |n (u) |; also, a bipartite graph is defined to represent the relationship between URLs and categories, and based thereon, the two bipartite graphs are combined to form a three-part graph T= (T, X, ∈E) for analyzing the complete structure of user activities
1 ,E
2 ) Wherein T is the set of types of URLs, X is the set of URLs, T is the set of users, +.>
Is a set of URL types and URL relationships, +.>
Is a collection of URL and user relationships. The three graphs of the URL are shown in figure 2。
Setting a weight function for the related information: weight function for user and URL access times
The degree of weighting is defined as:
Analyzing the relation between the category and the user activity by analyzing the bi-directional projection of T through the three graphs, wherein the bi-directional projection is defined as Pr (T) = (T, ∈E)
Pr(T) ) Wherein
As shown in fig. 3; if the three graphs are weighted, the projection will give a weighting function +.>
It is defined as:
wherein T is a set of URL categories, u represents a certain user node in the set of T, v represents a certain category in the set of T, z represents a certain URL in the set of X,
weighting function representing a bi-directional projection between category v and user u +.>
Expressed in relation set E
2 In this regard, the weighting function of user u with respect to some term z in the URL set, N (v) represents the set of neighbors of v, N (u) represents the set of neighbors of u,
after the setting of the three graphs is completed, when the relationship between the user and the category is analyzed, the conventional distance quantification is abandoned, random walk in the three graphs is relied on, probability distribution of different URLs belonging to the category v is calculated, any node v epsilon T is defined, z epsilon X is defined, and the probability from z to v is defined as follows:
where T is the set of types of URLs and X is the set of URLs. v denotes a certain category in the T set, z denotes a certain URL in the X set, w (z, v) denotes a weighting function of the node z in the URL set to the category v, d w (z) represents the weighting of node z in the URL collection,
similarly, for any node z e X, u e T, the probability from u to z is defined as:
wherein X is the set of URLs, T is the set u of users representing a certain user node in the set of T, z represents a certain URL in the set X, w (u, z) represents a weighting function of the user u to the node z in the set of URLs, d w (u) represents the degree of weighting of the node u in the user set,
the probability of getting from u to v is:
wherein T is the set of URL types, X is the set of URLs, T is the set of users, u represents a certain user node in the set of T, z represents a certain URL in the set of X, and v represents a certain category in the set of T.
Example 5
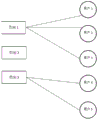
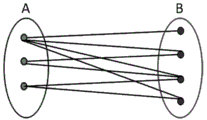
As shown in fig. 4 and fig. 5, on the basis of embodiment 1, the bipartite graph is also called a bipartite graph, and let g= (V, E) be an undirected graph, if the vertex V can be divided into two mutually disjoint subsets a and B, and two vertices i and j associated with each edge (i, j) in the graph respectively belong to the two different vertex sets (iin a, iin B), the bipartite graph G is called a bipartite graph, and as shown in fig. 4, the bipartite graph in fig. 1 can be denoted as g= (a, B, E). The three graphs are based on two graphs with the addition of the C set and by some kind of linkage, the three sets are linked together, assuming that an intermediate linkage C set is found between the a set and the B set, the three graphs are shown in fig. 5.
Test examples
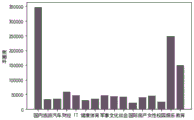
As shown in fig. 6-9, the data of this experiment were derived from the dog search laboratory, and 929588 users, 1801560 records and 17 categories were obtained by classifying word screening.
The relationship between the category of data and the number of URLs is shown in fig. 6. As can be seen from fig. 6, the information query amount for recruitment is small, and the most investigated class is domestic information and entertainment information. The recruitment is removed because less information is provided by the recruitment. And carrying out statistical analysis on the data, and screening out users with the access times of the website more than 2 times in the log. Finally, 902065 users, 715415 URLs and 16 categories are obtained.
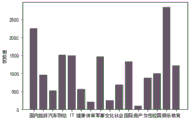
As can be seen from fig. 7, the diversity index of each class is similar to the distribution of the number of URLs, considering what factors the diversity of the Herfindah l may be related to. The content of the heradal index part calibrated in connection with the present application can be considered from a quantitative point of view.
As is apparent from fig. 8, the number of domestic, educational and entertaining categories is larger than that of other categories, so that the diversity index of the three categories is higher, which is the original intention that the introduction of the diversity index cannot be realized, and in addition, according to category analysis, the domestic and international categories can be found to be different from the other categories, so that the categories are divided into two groups, and different marks are used for representing the categories: one group is divided into two elements including domestic and foreign according to regions, and the other group is divided into other thirteen four elements according to contents. Therefore, in order to make the diversity score capture only diversity and not be affected by quantity, a method of improving the Herfindahl diversity index is adopted. The relationship of the calibrated heradal diversity (Calibrated Herfindahl diversity) to the number is shown in fig. 9. The calibrated hercule diversity index is constructed in a model-building manner of the hercule index calibrated according to the present application. It can be observed from fig. 9 that the smaller number of classes "traveling" has a similar diversity index to the larger number of classes "domestic" after the introduction of the random walk model. It can also be seen that: the interval range of the calibrated diversity index is mostly in the range of 0-0.7. The calibration value for the "social" class is too high, because this class is relatively small in number and there are multiple identical URL access records in the user's access records. It can be seen from the figure that this exponential presentation does not completely strip the effect of the amount, and that a greater amount of access to a category indicates a greater audience for that category, indicating that category may have a greater chance to appeal to a wider audience. The improvement index proposed by the present application is effective in reducing the influence of the amount of category on diversity to some extent.
Finally, calculating by using a formula (7), and obtaining the recommendation system score of the dog search engine as follows:
the method and the device realize quantification of diversity of the recommendation system and obtain diversity indexes of the recommendation system. The diversity index obtained through the model can be well used as an evaluation parameter of a recommendation system.
Comparative example
As shown in fig. 10-12, the herfashl index in this application is a quantification of a uniform distribution achieved by random walk, and in this comparative example, other diversity indices were tested and compared to the herfashl diversity index of this application:
the respective diversity index and the diversity index formula are shown in table 1.
TABLE 1 diversity index and diversity index formula
Experimental results as shown in fig. 10, richness diversity index theory derives from species richness, with higher diversity values in a greater number of categories. The Berger-Parker diversity index in fig. 11 will select the URL with the highest probability among the categories, and from the result, the overall diversity index will be still higher in the category with more visits. And is susceptible to extreme values because its calculation is related to the maximum value. As can be seen in fig. 12, similar to the first two figures, "domestic", "entertaining", "educational" still dominate in diversity, while the lesser number of "social", "international" diversity values are lower. It is shown that these three diversity indices do not represent the concept of diversity well, which cannot eliminate the effect of the amount on it, but the improved Herfindahl diversity index of the present application can effectively cut down the effect of the amount on it.
The foregoing description of the preferred embodiments of the invention is not intended to be limiting, but rather is intended to cover all modifications, equivalents, and alternatives falling within the spirit and principles of the invention.