Disclosure of Invention
The invention mainly aims to provide a flow velocity measuring method based on edge identification and maximum sequence density estimation, and aims to solve the problems that the conventional river flow velocity measuring method is long in time consumption and cannot be normally used under the condition of mountain torrents disasters.
In order to achieve the purpose, the technical scheme adopted by the invention is as follows:
a river channel flow velocity measurement method based on edge identification and maximum sequence density estimation is characterized by comprising the following steps:
step 1, erecting a camera and setting a site calibration point: arranging cameras and calibration points on two sides of a river bank to be detected;
step 2, measuring coordinates of the calibration points on the spot and measuring the size of the cross section of the river channel: calibrating the calibration point erected in the step 1 by using a total station to obtain the world coordinate of the calibration point, measuring the attitude parameter of the camera by using an auxiliary measuring instrument to obtain the pixel coordinate of the calibration point, and measuring the size of the cross section of the river channel by using the total station;
step 3, calibrating the camera: obtaining the pixel coordinates and the space coordinates of the calibration points after the step 2, establishing the relationship between two-dimensional pixel points and three-dimensional coordinate points through DLT linear transformation, analyzing a DLT linear equation according to the world coordinates of the site calibration points and the corresponding world coordinates, and finding the optimal solution to obtain the internal and external parameters calibrated by the camera;
(xi p,yi p)=f(xi 3D,yi 3D,zi 3D)
step 4, shooting a river video and generating a space-time image: shooting a river through an erected camera, drawing a speed measuring line in a video after the shooting is finished, and generating a corresponding space-time image through the speed measuring line;
step 5, space-time image preprocessing: the texture effect of the generated space-time image is not obvious, the texture characteristics of the space-time image are enhanced through histogram equalization, then the edge of the space-time image after equalization is identified through a Canny operator, a closed polygon outline is identified, and the identified sample is p ═ { p ═ p { (p } { (p) }iIn which p isiFor each polygon end point coordinate set
Step 6, slope of the local closed area: in order to obtain the slope of a speed measurement line of a spatio-temporal image, ridge regression analysis is performed on edge point rows constituting a closed polygon, and a linear slope sequence W of regression is obtained as { W }1,w2...wn};
Step 7, the inclination angle of the space-time pattern texture: on the basis of the step 6, carrying out estimation of an optimal subinterval on the obtained sequence W, and taking a sequence average value in the optimal subinterval as an estimation value of the flow speed;
step 8, river surface flow rate: according to the slope estimation value calculated in the previous step, the average speed of the speed measurement lines can be calculated by combining the movement distance of the river surface ripple texture pixel points in a fixed time and the frame rate of the camera, and the surface flow velocity of the river can be obtained by carrying out weighted average on a plurality of speed measurement lines.
Further, in step 2, a camera is installed at a suitable position of the river channel, at least 6 ground calibration boards are prepared, and the calibration hanging boards are arranged on two sides of the river channel, so that the space coordinates of the calibration boards are measured by using a total station under the condition that the positions of the calibration boards are not changed during calibration.
Further, in step 3, in order to determine a corresponding relationship between coordinates of a pixel point and three-dimensional coordinates, and determine parameters inside and outside a camera model, a DLT linear transformation method is introduced, the coordinates of the pixel point in an image captured by the camera are recorded as (u, v), the coordinates of a corresponding point in a three-dimensional space are recorded as (x, y, z), and undetermined parameters calibrated by the camera are recorded as liThe transformation formula is as follows:
and solving the equation through a preset calibration point to complete the transformation from the three-dimensional coordinate point of the image sequence to the coordinate of the image pixel point.
Further, in the step 4, a specific method for generating the spatio-temporal image is as follows:
the method comprises the steps of drawing the change of brightness of pixel points on a flow velocity line along the time on an image through the flow velocity line drawn along the flowing direction in an obliquely shot video, wherein the horizontal axis represents the length of the flow velocity line, and the vertical axis represents the time axis, so that the generated image is called a space-time image.
Further, in the step 5, the specific steps are as follows:
step 5.1, the image collected by the camera is three-channel RGB, and for convenient processing, the image is converted into gray processing, and the calculation mode is as follows:
step 5.2, histogram equalization, wherein the pixel point with the gray level of i has n
iA probability of
Setting s and r as the gray levels of the image before and after transformation, performing normalization processing, and introducing a transformation functionThe number T is as follows
The equalized pixel values can be calculated from the histogram before transformation;
step 5.3, Canny edge identification, firstly, filtering the image, and processing by adopting Gaussian filtering; secondly, solving the gradient direction and the gradient amplitude by using a Sobel operator, wherein the specific method is to convolute the pixel matrix and the operator matrix of the picture:
where F is the pixel matrix of the image and the identified closed polygon is used as the basis for subsequent maximum sequence density estimation.
Further, the specific steps in the step 6 are as follows:
step 6.1, for each p identified in step 5iPerforming ridge regression analysis, i.e.
Wherein Y is { Y ═ Y1,y2..yn},X=[x1,x2,...,xn]T w=[w1,w2....,wn]T;
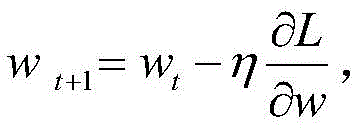
Step 6.2, the formula in the step 6.1 is iteratively solved by adopting gradient descent, namely
In the formula, eta is a step length parameter, and w obtained by solving
iThe tangent value of the angle representing the texture of the block can be considered, where
Further, the specific steps in step 7 are as follows:
w by point column regression analysis of each contour of step 6
iSlope sequence of composition w ═ (w)
1,w
2,..,w
n) Let ε be the allowable error, let the center value of the window be
Counting intervals by sliding windows
The number of internal samples, considering the interval covering the maximum number of samples N
Using the mean value in this interval
As an estimate of the tangent of the texture angle, wherein
Further, the specific steps in step 8 are as follows:
in the spatio-temporal image, the spatial-temporal image,
the maximum sequence density estimated value calculated in the
step 7
The calculated flow velocity is that the distance of the moving characteristic quantity moving along the velocity measurement line in the time T is S under the assumption of three-dimensional space, and meanwhile, the pixel point moves by i pixels in the k frame, so that the flow velocity of the velocity measurement line is S
Wherein fps is a photographic cameraThe frame rate of (a) is higher than the frame rate of (b),
is the tangent of the slope of the spatio-temporal image, P
xIs the spatial distance represented by the pixel; for the velocity v of different velocity lines
i(i ═ 1,2.. n), use
To calculate the average flow velocity of the river surface, where
iAnd selecting the weight coefficient according to the corresponding specification.
The invention has the beneficial effects that:
the invention can carry out non-contact flow measurement on the river, creates a new measurement mode, almost achieves real-time measurement after establishing the database, effectively avoids potential safety hazards caused by contact measurement to operators, and is particularly suitable for occasions with torrential rivers.
Detailed Description
The invention is illustrated below with reference to the accompanying drawings, and as shown in fig. 1 to 7, a river channel flow velocity measurement method based on edge identification and maximum sequence density estimation includes the following steps:
step 1, erecting a camera and setting a site calibration point. Selecting proper positions on both sides of the river bank, erecting and fixing cameras, setting calibration points in order to obtain the relationship between the pixel coordinates and the three-dimensional coordinates during the primary measurement, calibrating by using calibration plates as calibration points on both sides of a river bank, uniformly arranging site calibration points on both sides of the river, measuring world coordinates and camera attitude parameters of the calibration points by using a total station and other auxiliary measuring instruments, particularly installing a camera at a proper position of the river channel for better acquiring calibration data, preparing at least 6 ground calibration plates, calibration boards are arranged on two sides of a river channel, as shown in fig. 1, the left bank of the river channel is provided with calibration boards 1,2, 3 and 4, the right bank is provided with calibration boards 5, 6 and 7, seven calibration boards are provided in total, and a camera 8 is fixed on the right bank, so that the total station is used for measuring the space coordinates of the calibration boards under the condition that the positions of the calibration boards are not changed during calibration.
And 2, measuring coordinates of the calibration points on the spot and measuring the size of the cross section of the river channel. And (3) calibrating the calibration board erected in the step (1) by using a total station, measuring the coordinate of the calibration board in a three-dimensional space, and measuring the attitude parameter of the camera by using an auxiliary measuring instrument to obtain the pixel coordinate of the calibration point. And simultaneously, measuring the size of the cross section of the river channel.
And step 3, calibrating the camera. In order to determine the corresponding relation between the coordinates of the pixel points and the three-dimensional coordinates, the parameters inside and outside the camera model are determined, and a DLT linear transformation method is introduced. And (3) obtaining the pixel coordinates and the space coordinates of the calibration point after the steps 1 and 2, and establishing the relationship between the two-dimensional pixel point and the three-dimensional coordinate point through DLT linear transformation. And resolving a DLT linear equation according to the world coordinates of the site calibration point and the corresponding world coordinates, and finding an optimal solution to obtain the internal and external parameters calibrated by the camera.
(xi p,yi p)=f(xi 3D,yi 3D,zi 3D)
In the above formula, the first and second carbon atoms are,
is the coordinate of a two-dimensional pixel point,
are three-dimensional coordinates.
Specifically, if the coordinates of the pixel points in the image are recorded as (u, v), the coordinates of the corresponding points in the three-dimensional space are recorded as (x, y, z), and the undetermined parameters calibrated by the camera are recorded as li. According to transformation formulae
And solving the equation through a preset calibration point to complete the transformation from the three-dimensional coordinate point of the image sequence to the coordinate of the image pixel point.
And 4, shooting a river video and generating a space-time image. The river is shot through the erected camera, a speed measuring line (shown in figure 2) is drawn in a video after the shooting is finished, and a corresponding space-time image is generated through the speed measuring line.
A speed measurement line as shown in fig. 2 is drawn in a captured river video, and characteristics such as water surface ripples and ripples can be considered to move with water flow under the condition that disturbances such as wind are ignored. The resulting change in image intensity may reflect the surface flow velocity of the channel. The basic principle of the STIV flow measurement is that a space-time image is generated by plotting the change of the brightness of the pixel points on the flow velocity line with time on an image (as shown in fig. 3) through a flow velocity line (as shown in fig. 2) plotted along the flow direction in a video shot in an inclined manner, wherein the horizontal axis represents the length of the flow velocity line, and the vertical axis represents the time axis, so that the generated space-time image is called as the STIV image.
And 5, preprocessing the spatio-temporal image. The generated image texture effect is not obvious, and the texture features of the image are enhanced through histogram equalization. And then, carrying out edge identification on the equalized image through a Canny operator, identifying a closed polygon outline, and identifying the obtained sample as p ═ { p ═ piIn which p isiFor each polygon end point coordinate set
The specific method comprises the following steps:
step 5.1, the image collected by the camera is three-channel RGB, and for convenient processing, the image is converted into gray scale processing in a calculation mode
And 5.2, histogram equalization, wherein linear characteristics presented by the image texture are considered to be reflected on the degree change of the gray level. The histogram equalization method can be adopted to enhance local contrast characteristics under the condition of not influencing the overall contrast. The pixel point with gray scale i has n
iA probability of
n is the total number of pixel points. Let s and r be the gray levels of the images before and after transformation, and perform normalization processing, and introduce the transformation function T as follows
The equalized pixel values may be calculated from the histogram before the transformation. See figure 4 for an STIV image after histogram equalization
And 5.3, Canny edge identification, wherein in the step 4, in order to describe the angle characteristics of the texture, a Canny operator is introduced for edge identification. Firstly, filtering the image, wherein the Canny operator mainly works by depending on the brightness derivative of the image, and the unfiltered image has large noise and can cause large influence on the performance of the operator. The processing is usually performed by Gaussian filtering
Secondly, solving the gradient direction and the gradient amplitude by using a Sobel Operator (a convolution operation is carried out on the pixel matrix and the Operator matrix of the picture
Where F is the pixel matrix of the image, and the recognition result is shown in fig. 5, that is, the sample obtained by recognition is p ═ p
iIn which p is
iFor each polygon end point coordinate set
The identified closed polygons serve as a basis for subsequent maximum sequence density estimation.
And 6, locally sealing the slope of the interval. In order to obtain the slope of the speed measurement line of the spatio-temporal image, ridge regression analysis is performed on the edge point rows constituting the closed polygon. Finding the linear slope sequence W ═ W of regression1,w2...wn}. The overall processing steps are shown in FIG. 7, and the speed measuring line preprocessing process comprises the following specific steps
Step 6.1 is that in the STIV image, the proportion of noise is smaller than the proportion of the correct result, and therefore the sample obtained by edge recognition is p ═ { p ═ p
i},
For each p
iPerforming ridge regression analysis, i.e.
Wherein Y is { Y ═ Y1,y2..yn},X=[x1,x2,...,xn]T w=[w1,w2....,wn]T。
Step 6.2, the formula of the step 6.1 is iteratively solved by gradient descent, namely
Wherein eta is a step length parameter. Solved w
iThe tangent value of the angle representing this piece of texture can be considered.
And 7, dip angle of the space-time pattern texture. On the basis of step 6, the optimal subinterval of the obtained sequence W is estimated, and the average value of the sequence in the optimal subinterval is taken as the estimated value of the flow velocity, and the specific steps are as follows:
w by point column regression analysis of each contour of step 6
iSlope sequence of composition w ═ (w)
1,w
2,..,w
n). Let ε be the allowable error, center value of window be
Counting intervals by sliding windows
The number of inner samples. Considering the interval covering the maximum number of samples N
Using the mean value in this interval
As an estimate of the tangent of the texture angle, wherein
See fig. 6 for a detailed maximum sequence density estimate.
And 8, river surface flow velocity. According to the slope estimation value calculated in the previous step, the average speed of the speed measurement lines can be calculated by combining the movement distance of the river surface ripple texture pixel points in a fixed time and the frame rate of the camera, and the surface flow velocity of the river can be obtained by carrying out weighted average on a plurality of speed measurement lines; the method comprises the following specific steps:
in the case of an STIV image,
the maximum sequence density estimated value calculated in the
step 7
The calculated flow velocity assumes that the moving characteristic quantity moves along the velocity measurement line within the time T by the distance S in the three-dimensional space, and meanwhile, the pixel pointIf i pixels move in the k frame, the velocity of the velocity measurement line is
Wherein fps is the frame rate of the shooting camera and the unit is frame/s,
tangent of the slope of the STIV spatio-temporal image, P
xIs the spatial distance represented by the pixel.
For the velocity v of different velocity lines
i(i ═ 1,2.. n), use
To calculate the average flow velocity of the river surface, where
iFor the weight coefficients, they are selected according to the relevant specifications GB 50179-1993 and the like.