Disclosure of Invention
The present invention has been made in view of the above problems, and it is therefore an object of the present invention to provide a method, system and apparatus for heterogeneous diagram learning that overcomes or at least partially solves the above problems.
The embodiment of the invention provides an advertisement recall system, which comprises a system for acquiring relation expression among entities and an advertisement recall matching system;
the system for acquiring the relation expression between the entities is used for splitting a pre-constructed heterogeneous graph into subgraphs according to the types of edges, wherein one subgraph comprises one type of edge; the node types in the iso-graph include: at least one of advertisement, commodity and query word, wherein the type of the edge comprises at least one of clicking edge, co-clicking edge, collaborative filtering edge, content semantic similarity edge and attribute similarity edge;
sampling each sub-graph to obtain a sample set of each sub-graph, wherein each sample of the sample set comprises a source node, a positive node and at least one negative node;
inputting the sample set of the same batch of each sub-graph into a preset machine learning model for training to respectively obtain vector expression of a source node, vector expression of a positive node and vector expression of each negative node of each sample in the sample set of each sub-graph; optimizing parameters in the machine learning model by using a preset loss function based on the obtained vector expression of each node;
The method comprises the steps of performing aggregation learning on vector expressions of the same source nodes in different subgraphs by a preset aggregation model to obtain one vector expression of the same source nodes; optimizing parameters of an aggregation model by using a preset loss function based on a vector expression of the same source node and a vector expression of positive nodes and a vector expression of each negative node included in samples of each subgraph by the source node;
and repeating the flow to train the sample sets of all batches for preset times to obtain a low-dimensional vector expression of each node in the heterogeneous graph, wherein one node in the heterogeneous graph corresponds to one entity in the sample data.
The advertisement recall matching system is used for determining the matching degree among the query word nodes, the commodity nodes and the search advertisement nodes by using the low-dimensional vector expression of the query word nodes, the commodity nodes and the search advertisement nodes obtained by the system for obtaining the relation expression among the entities, and selecting the search advertisement which meets the set requirements with the matching degree of the commodity and the query word according to the matching degree.
In some alternative embodiments, the system for obtaining the expression of the relationship between entities samples each sub-graph to obtain a sample set of each sub-graph, including:
For each sub-graph, respectively performing random walk by taking a selected node as a starting point to obtain at least one node sequence corresponding to each sub-graph; obtaining a positive sample set corresponding to each sub-graph from the node sequence by using a preset sliding window, wherein one positive sample in the positive sample set comprises a source node and a positive node;
and sampling negative nodes once based on the positive sample set corresponding to each sub-graph to obtain a sample set corresponding to each sub-graph, wherein one sample in the sample set comprises a source node, a positive node and at least one negative node, the distribution of the negative nodes and the positive nodes is consistent, and the negative nodes and the preset attribute of the source node are relevant.
In some optional embodiments, the system for obtaining the relationship expression between entities inputs the sample set of the same batch of each sub-graph into a preset machine learning model for training, and obtains the vector expression of the source node, the vector expression of the positive node and the vector expression of each negative node of each sample set of each sub-graph respectively, including:
inputting source nodes, positive nodes, negative nodes and attribute information of each node included in each sample in a sample set into a machine learning model aiming at the sample set of the same batch of each subgraph;
Mapping sparse features of nodes included in the sample into dense features through an embedding layer of the machine learning model;
the method comprises the steps that the dense features of a source node are trained through a corresponding machine learning model network to obtain vector expressions of the source node, and the dense features of a positive node and a negative node are trained through a corresponding machine learning model to obtain vector expressions of the positive node and each negative node.
In some optional embodiments, the system for obtaining the expression of the relationship between the entities uses a preset loss function to optimize parameters in the machine learning model based on the obtained vector expression of each node, including:
according to the vector expression of the source node, the vector expression of the positive node and the vector expression of each negative node of each sample obtained through training, the cosine distances between the source node and the positive node as well as between the source node and the cosine distances between the source node and between source node and each negative node are calculated;
and optimizing parameters in the machine learning model by a preset loss function based on the cosine distance.
In some optional embodiments, the system for obtaining the expression of the relationship between the entities performs aggregation learning on the vector expressions of the same source node in different subgraphs through a preset aggregation model to obtain a vector expression of the same source node, which includes:
Determining the weight of the vector expression of the source node obtained by training from each subgraph according to each vector expression of the source node obtained by training each subgraph and a corresponding learning weight factor;
and carrying out weighted summation on the vector expressions trained by the source node from each subgraph by using the determined weights to obtain a vector expression aggregated by the source node.
In some optional embodiments, the system for obtaining the expression of the relationship between the entities uses a preset loss function to optimize parameters in the machine learning model based on the obtained vector expression of each node, including:
according to the vector expression of the source node, the vector expression of the positive node and the vector expression of each negative node of each sample obtained through training, the cosine distances between the source node and the positive node as well as between the source node and the cosine distances between the source node and between source node and each negative node are calculated;
and optimizing parameters in the machine learning model by a preset loss function based on the cosine distance.
The embodiment of the invention also provides a method for obtaining the relation expression between the entities, which comprises the following steps:
splitting a pre-built heterogeneous graph into sub-graphs according to the types of edges, wherein one sub-graph comprises one type of edge;
sampling each sub-graph to obtain a sample set of each sub-graph, wherein each sample of the sample set comprises a source node, a positive node and at least one negative node;
Inputting the sample set of the same batch of each sub-graph into a preset machine learning model for training to respectively obtain vector expression of a source node, vector expression of a positive node and vector expression of each negative node of each sample in the sample set of each sub-graph; optimizing parameters in the machine learning model by using a preset loss function based on the obtained vector expression of each node;
the method comprises the steps of performing aggregation learning on vector expressions of the same source nodes in different subgraphs by a preset aggregation model to obtain one vector expression of the same source nodes; optimizing parameters of an aggregation model by using a preset loss function based on a vector expression of the same source node and a vector expression of positive nodes and a vector expression of each negative node included in samples of each subgraph by the source node;
and repeating the flow to train the sample sets of all batches for preset times to obtain a low-dimensional vector expression of each node in the heterogeneous graph, wherein one node in the heterogeneous graph corresponds to one entity in the sample data.
In some alternative embodiments, sampling for each sub-graph results in a sample set for each sub-graph, including:
For each sub-graph, respectively performing random walk by taking a selected node as a starting point to obtain at least one node sequence corresponding to each sub-graph; obtaining a positive sample set corresponding to each sub-graph from the node sequence by using a preset sliding window, wherein one positive sample in the positive sample set comprises a source node and a positive node;
and sampling negative nodes once based on the positive sample set corresponding to each sub-graph to obtain a sample set corresponding to each sub-graph, wherein one sample in the sample set comprises a source node, a positive node and at least one negative node, the distribution of the negative nodes and the positive nodes is consistent, and the negative nodes and the preset attribute of the source node are relevant.
In some optional embodiments, a positive sample set corresponding to each sub-graph is obtained from the node sequence by using a preset sliding window, and specifically includes:
and aiming at each node in the sequence, acquiring other nodes which are positioned in the range of the sliding window when the node is positioned in the sliding window according to the preset size of the sliding window, and respectively forming sample pairs with the acquired other nodes and the node to obtain the positive sample set.
In some alternative embodiments, sampling of negative nodes from positive nodes, obtaining for each pair of source nodes and positive nodes a corresponding at least one negative node that is consistent with the distribution of positive nodes, the negative nodes having a correlation with the source nodes.
In some alternative embodiments, sampling negative nodes from positive nodes, obtaining at least one corresponding negative node for each pair of source nodes and positive nodes, the negative nodes being consistent with the distribution of positive nodes, the negative nodes having a correlation with the source nodes, includes:
counting the positive node pairs in the sample set to obtain categories of each positive node and the occurrence times of the same positive node in different positive samples as the distribution weight of the positive nodes;
and selecting positive nodes under the category from the counted positive nodes according to category information of the source nodes, determining probability of the obtained positive nodes as negative nodes according to the distribution weight, and selecting the negative nodes meeting the requirements of the source node correlation according to the probability.
In some optional embodiments, inputting the same batch of sample sets of each sub-graph into a preset machine learning model for training, respectively obtaining vector expression of a source node, vector expression of a positive node and vector expression of each negative node of each sample in the sample set of each sub-graph, including:
Inputting source nodes, positive nodes, negative nodes and attribute information of each node included in each sample in a sample set into a machine learning model aiming at the sample set of the same batch of each subgraph;
mapping sparse features of nodes included in the sample into dense features through an embedding layer of the machine learning model;
the method comprises the steps that the dense features of a source node are trained through a corresponding machine learning model network to obtain vector expressions of the source node, and the dense features of a positive node and a negative node are trained through a corresponding machine learning model to obtain vector expressions of the positive node and each negative node.
In some alternative embodiments, optimizing parameters in the machine learning model using a preset loss function based on the obtained vector expression of each node includes:
according to the vector expression of the source node, the vector expression of the positive node and the vector expression of each negative node of each sample obtained through training, the cosine distances between the source node and the positive node as well as between the source node and the cosine distances between the source node and between source node and each negative node are calculated;
and optimizing parameters in the machine learning model by a preset loss function based on the cosine distance.
In some optional embodiments, a preset aggregation model performs aggregation learning on vector expressions of the same source node in different subgraphs to obtain one vector expression of the same source node, and includes:
Determining the weight of the vector expression of the source node obtained by training from each subgraph according to each vector expression of the source node obtained by training each subgraph and a corresponding learning weight factor;
and carrying out weighted summation on the vector expressions trained by the source node from each subgraph by using the determined weights to obtain a vector expression aggregated by the source node.
In some alternative embodiments, optimizing parameters in the machine learning model using a preset loss function based on the obtained vector expression of each node includes:
according to the vector expression of the source node, the vector expression of the positive node and the vector expression of each negative node of each sample obtained through training, the cosine distances between the source node and the positive node as well as between the source node and the cosine distances between the source node and between source node and each negative node are calculated;
and optimizing parameters in the machine learning model by a preset loss function based on the cosine distance.
The embodiment of the invention also provides a system for acquiring the relation expression between the entities, which comprises the following steps: registration means, storage means, calculation means, and parameter exchange means;
a storage device for storing the data of the different patterns;
the computing device is used for acquiring the data of the heterograms from the storage device through the registering device, and learning the heterograms by adopting the method for acquiring the relation expression among the entities to obtain the low-dimensional vector expression of each node in the heterograms.
Parameter exchange means for parameter interaction with the computing means.
The technical scheme provided by the embodiment of the invention has the beneficial effects that at least:
sampling the sub-graphs based on the sub-graphs after the splitting of the heterogeneous graphs, training and learning a sample set obtained by sampling, and fusing the learning results of all the learned sub-graphs to obtain the learning results of the heterogeneous graphs, so that the complex heterogeneous graphs are learned; the problem of explosive growth of training parameters is effectively avoided by learning the subgraph of the isomerism graph disassembly, meanwhile, the problem that the number of neighbors grows exponentially along with the number of layers is also effectively avoided, the data processing amount in the isomerism graph learning process is greatly reduced, the calculation magnitude of the data processing amount is reduced to be within the magnitude range which can be supported by processing equipment, the hardware requirement on isomerism graph learning equipment is reduced, and the speed and the efficiency of the isomerism graph learning are greatly improved. The heterogeneous graph learning method is used in advertisement searching scenes, the entity relation in the advertisement searching scenes is mined, advertisement recall is accurately achieved by using a large amount of information, the quality of advertisement recall is improved, the whole advertisements are used as candidates, enough advertisements can be recalled under any flow, and the realization of advertisement rewriting and advertisement screening can be completed in one step in a vector mode.
Additional features and advantages of the invention will be set forth in the description which follows, and in part will be obvious from the description, or may be learned by practice of the invention. The objectives and other advantages of the invention will be realized and attained by the structure particularly pointed out in the written description and claims thereof as well as the appended drawings.
The technical scheme of the invention is further described in detail through the drawings and the embodiments.
Detailed Description
Exemplary embodiments of the present disclosure will be described in more detail below with reference to the accompanying drawings. While exemplary embodiments of the present disclosure are shown in the drawings, it should be understood that the present disclosure may be embodied in various forms and should not be limited to the embodiments set forth herein. Rather, these embodiments are provided so that this disclosure will be thorough and complete, and will fully convey the scope of the disclosure to those skilled in the art.
In order to solve the problem that in the prior art, when the heterogeneous graph is learned, training parameters are exponentially increased, neighbor sampling is exponentially increased along with the increase of the layer number, so that equipment cannot support operation of such a large order, the embodiment of the invention provides a method which can well solve the problem, effectively reduces the relation expression quantity among the data acquisition entities in the heterogeneous graph learning process, and has high processing speed and high efficiency.
Graph learning is widely used in the field of mining various data relationships, for example, in a search advertisement platform for mining correlations between search requests and advertisements, click-Through-Rate (CTR), and the like. That is, the method of the invention can be used in the field of advertisement search and used for recall of searched advertisements. Searching advertisements refers to determining related keywords by advertisers according to the content, characteristics and the like of products or services of the advertisers, writing advertisement content and pricing advertisements placed in search results corresponding to the keywords autonomously. Search advertisement recall refers to choosing the most relevant advertisement from a collection of massive advertisements by some algorithm or model.
Existing search advertisement recall techniques either screen for "high quality" advertisements based on how well the query word matches the advertiser bid term (bid), the advertiser bid term price, and the user's statistical preferences for advertisements; or adding historical behavior data of each user, and carrying out personalized matching recall on the advertisements.
The inventor finds that the existing recall technology only weights the matching degree of advertisements and query words, or only weights the recall advertisement benefits, and lacks an integrated model to combine the recall technology and the query words. Because the quality of advertisement recall is important to searching advertisement benefits and user experience, the inventor provides a graph learning technology which is used for obtaining relation expression among entities in the advertisement recall process, and more advertisement recall sets with high quality and more concern of users can be obtained.
The method and system for obtaining relational expressions between entities, and the specific implementation for an advertising recall system, are described in detail below with particular embodiments.
Example 1
The first embodiment of the invention provides a method for obtaining a relation expression between entities, the flow of which is shown in figure 1, comprising the following steps:
step S101: splitting a pre-built heterogeneous graph into sub-graphs according to the types of edges, wherein one sub-graph comprises one type of edges.
Because of complexity of the heterograms and bulkiness of data, data volume increases exponentially in the processing process, when the heterograms are processed, the heterograms are split into sub-graphs, when the heterograms are split, the sub-graphs are split according to types of edges, one sub-graph is corresponding to one type of edge, and types of nodes in the sub-graphs can be different. Preferably, all nodes and one type of edges in the iso-graph are included in one subgraph.
Step S102: sampling each sub-graph to obtain a sample set of each sub-graph, wherein each sample of the sample set comprises a source node, a positive node and at least one negative node;
for each sub-graph, respectively performing random walk by taking a selected node as a starting point to obtain at least one node sequence corresponding to each sub-graph; obtaining a positive sample set corresponding to each sub-graph from the node sequence by using a preset sliding window, wherein one positive sample in the positive sample set comprises a source node and a positive node;
And sampling negative nodes once based on the positive sample set corresponding to each sub-graph to obtain a sample set corresponding to each sub-graph, wherein one sample in the sample set comprises a source node, a positive node and at least one negative node, the distribution of the negative nodes and the positive nodes is consistent, and the negative nodes and preset attributes of the source node are correlated.
The random walk algorithm can adopt a deepwalk, node2vec learning algorithm.
Obtaining a positive sample set corresponding to each sub-graph from the node sequence by using a preset sliding window, wherein the positive sample set specifically comprises: and aiming at each node in the sequence, acquiring other nodes which are positioned in the range of the sliding window when the node is positioned in the sliding window according to the preset size of the sliding window, and respectively forming sample pairs with the acquired other nodes to obtain a positive sample set.
And when negative node sampling is carried out, sampling negative nodes from positive nodes, and obtaining at least one corresponding negative node for each pair of source nodes and positive nodes, wherein the distribution of the negative nodes and the positive nodes is consistent, and the negative nodes and the source nodes have correlation. Specifically, counting positive node pairs in a sample set to obtain categories of each positive node and the occurrence times of the same positive node in different positive samples as distribution weights of the positive nodes; and selecting positive nodes under the category from the counted positive nodes according to category information of the source nodes, determining probability of the obtained positive nodes as negative nodes according to the distribution weight, and selecting the negative nodes meeting the requirements of the source node correlation according to the probability.
Setting the number of times of wandering when the node is taken as a starting point for each node in each subgraph, carrying out corresponding times of wandering for each node to obtain a series of node sequences taking the starting point node as a source node, and extracting positive sample pairs according to the obtained node sequences to obtain a positive sample set. And after the positive sample set is obtained, negative node sampling is carried out according to the sampling principle of the negative nodes, and at least one negative node is sampled for each positive sample pair, so that one sample comprising one source node, one positive node and at least one negative node is obtained.
Step S103: and inputting the sample set of the same batch of each sub-graph into a preset machine learning model for training, and respectively obtaining the vector expression of the source node, the vector expression of the positive node and the vector expression of each negative node of each sample in the sample set of each sub-graph.
Inputting source nodes, positive nodes, negative nodes and attribute information of each node included in each sample in a sample set into a machine learning model aiming at the sample set of the same batch of each subgraph;
mapping sparse features of nodes included in the sample into dense features through an embedding layer of the machine learning model;
The method comprises the steps that the dense features of a source node are trained through a corresponding machine learning model network to obtain vector expressions of the source node, and the dense features of a positive node and a negative node are trained through a corresponding machine learning model to obtain vector expressions of the positive node and each negative node.
Step S104: and optimizing parameters in the machine learning model by using a preset loss function based on the obtained vector expression of each node.
According to the vector expression of the source node, the vector expression of the positive node and the vector expression of each negative node of each sample obtained through training, the cosine distances between the source node and the positive node as well as between the source node and the cosine distances between the source node and between source node and each negative node are calculated; the preset loss function optimizes parameters in the machine learning model based on cosine distances.
And aiming at the learning result of each sample in the subgraph, calculating the cosine distance between the vector expression of the source node in the sample and the vector expression of the positive node included in the sample, and the cosine distance between the source node and the vector expression of each negative node, and inputting each cosine distance obtained by calculation into a loss function to obtain an optimized vector.
In the step, parameters of the machine learning model corresponding to each sub-graph are optimized according to the learning result of the machine learning model corresponding to each sub-graph on the sample data of one batch. The machine learning model after parameter optimization is used for learning samples of the next batch, so that the result of sample learning of the previous batch can influence sample learning of the next batch.
Step S105: and carrying out aggregation learning on vector expressions of the same source nodes in different subgraphs by a preset aggregation model to obtain one vector expression of the same source node.
In this step, aggregation of vector expressions of the same source node in different subgraphs is achieved. Determining the weight of the vector expression of the source node obtained by training from each subgraph according to each vector expression of the source node obtained by training each subgraph and a corresponding learning weight factor; and carrying out weighted summation on the vector expressions trained by the source node from each subgraph by using the determined weights to obtain a vector expression aggregated by the source node.
Step S106: the parameters of the aggregate model are optimized using a predetermined penalty function based on a vector representation of the same source node and a vector representation of positive nodes and a vector representation of each negative node that the source node includes in the samples of each sub-graph.
According to the vector expression of the source node, the vector expression of the positive node and the vector expression of each negative node of each sample obtained through training, the cosine distances between the source node and the positive node as well as between the source node and the cosine distances between the source node and between source node and each negative node are calculated; and optimizing parameters in the machine learning model by a preset loss function based on the cosine distance.
The vector expressions of the same source nodes in different subgraphs are aggregated, samples containing the source nodes are obtained from a sample set of each subgraph aiming at each source node, cosine distances between the vector expressions of the source nodes and positive node vector expressions contained in the samples and cosine distances between the source nodes and vector expressions of negative nodes are calculated respectively aiming at each obtained sample, and the calculated cosine distances are input into a loss function to obtain an optimized vector.
In the step, the parameters of the learning result of the sample data of one batch are optimized according to the machine learning models corresponding to different subgraphs. The machine learning model after parameter optimization is used for learning samples of the next batch, so that the result of sample learning of the previous batch can influence sample learning of the next batch.
Step S107: repeating the above flow to train the sample sets of all batches for preset times to obtain a low-dimensional vector expression of each node in the heterogram, wherein one node in the heterogram corresponds to one entity in the sample data.
Training the sample sets of different batches generated by the heterogeneous graph for preset times, and updating the previous training result by using the previous training result to obtain a final low-dimensional vector expression of each node in the heterogeneous graph.
In the method of the embodiment, sub-graphs are sampled based on sub-graphs after the splitting of the heterogeneous graphs, training and learning are carried out on a sample set obtained by sampling, and learning results of all the learned sub-graphs are fused to obtain learning results of the heterogeneous graphs, so that the complex heterogeneous graphs are learned; the problem of explosive growth of training parameters is effectively avoided by learning the subgraph of the isomerism graph disassembly, meanwhile, the problem that the number of neighbors grows exponentially along with the number of layers is also effectively avoided, the data processing amount in the isomerism graph learning process is greatly reduced, the calculation magnitude of the data processing amount is reduced to be within the magnitude range which can be supported by processing equipment, the hardware requirement on isomerism graph learning equipment is reduced, and the speed and the efficiency of the isomerism graph learning are greatly improved. The heterogeneous graph learning method is used in advertisement searching scenes, the entity relation in the advertisement searching scenes is mined, advertisement recall is accurately achieved by using a large amount of information, the quality of advertisement recall is improved, the whole advertisements are used as candidates, enough advertisements can be recalled under any flow, and the realization of advertisement rewriting and advertisement screening can be completed in one step in a vector mode.
Example two
The second embodiment of the present invention provides a specific implementation process of a method for obtaining a relational expression between entities, which is illustrated by taking a process of implementing advertisement recall in a search advertisement scene as an example, and the flow of the method is shown in fig. 2, and includes the following steps:
step S201: constructing an anisotropic pattern.
Taking an advertisement searching scene as an example, constructing a large-scale heterogram for the searching recall scene according to a user log and related commodity and advertisement data, taking the large-scale heterogram as a rich searching interaction diagram of the advertisement searching scene, and taking the constructed heterogram as a subsequent diagram data input.
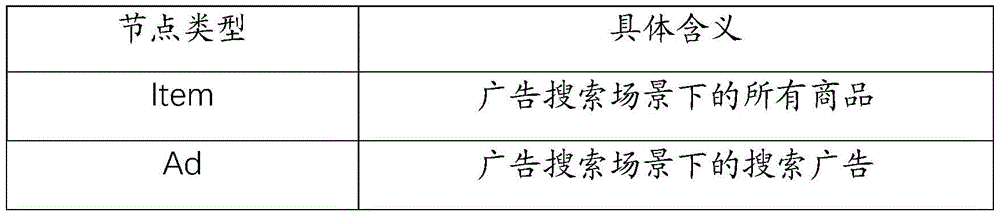
An example of the constructed iso-graph is shown with reference to fig. 3, where the iso-graph includes several joints such as Query1, query2, item1, item2, item3, item4, and Ad1, and edges connecting different nodes, the iso-graph includes multiple types of nodes such as Query, item, ad to represent different entities in the search scene, and the iso-graph includes multiple types of edges to represent multiple relationships between the entities. Such as click relationships between queries and items, items being pre-click relationships of ads, etc. The node type and its specific meaning may be shown in table 1 below, and the type of edge and its meaning may be shown in table 2 below.
TABLE 1
The Query nodes and the Item nodes are used as user intention nodes to characterize personalized search intention of a user, and the Ad nodes are advertisements put by advertisers.
TABLE 2
Wherein:
the user behavior edge represents the user's historical behavior preference, e.g., a "click edge" may be built between a Query node and an Item node or between a Query node and an Ad node and represent clicks between a Query and an Item/Ad using the number of clicks as an edge weight; for another example, a co-click edge (session edge) may be established, representing an Item or Ad co-clicked with a Query with a session; for another example, collaborative filtering edges (cf edges) may also be established to represent collaborative filtering relationships between different nodes. In the advertisement searching scene, the behavior of the user characterizes a dynamic change relation. The hot nodes (such as the nodes of the high-frequency Query) can be displayed and clicked more, so that the nodes have denser edge relations and larger edge weights, and the cold nodes and the new nodes have relatively sparse variable relations and smaller edge weights, so that the user behavior edges can better describe the hot nodes.
Content similarity edges (semmantic edges) are used to determine similarity between client nodes, such as: edges are created between Item nodes, using the text similarity of their titles as becoming weight. The content similarity side reflects a static relation among nodes, is more stable, and can well describe the relation between the cold door node and the new node.
Attribute similarity edges (domain edges) represent overlapping copies of domains between nodes, e.g., brands, categories, etc.
Step S202: splitting a pre-built heterogeneous graph into sub-graphs according to the types of edges, wherein one sub-graph comprises one type of edge;
each edge in the iso-graph may act as a relationship between nodes. For example, the headline text similarity between item and ad characterizes the semantic similarity between the two; the click edge represents that they were clicked by the same user under the same query. In one aspect, each edge may separately delineate a partial relationship between nodes; on the other hand, multiple different edge complements may more characterize a richer and robust relationship. Thus, the present invention proposes a subgraph-based solution for iso-patterning, each subgraph comprising one type of edge.
For the different patterns, different subgraphs are respectively constructed for each type of edge. Each sub-graph contains only one edge and may contain all or part of the nodes. In a search advertisement scenario, three different subgraphs may be constructed from different edges. Specifically, a user behavior subgraph can be constructed according to the search and click behaviors of the user; a text similarity subgraph can be constructed according to the text similarity among the query, item titles and advertisement titles; co-occurrence relationship subgraphs can be constructed from click co-occurrence relationships of queries, items, and ads. The sub-diagrams of the construction are shown in fig. 4, 5 and 6.
The user behavior sub-graph shown in fig. 4 comprises user behavior edges and all nodes, the text similar sub-graph shown in fig. 5 comprises content similar edges and all nodes, and the common relation sub-graph shown in fig. 6 comprises attribute similar edges and all nodes.
Step S203: and sampling each sub-graph to obtain a sample set of each sub-graph, wherein each sample of the sample set comprises a source node, a positive node and at least one negative node.
For each subgraph, random walk with Node2Vec produces positive sample pairs, and negative nodes are produced following two principles of negative sampling, resulting in a large number of samples: (src_node, { neg_node } K, edge_type), wherein src_node represents a source node, pos_node represents a positive node, { neg_node } K represents K negative nodes obtained by negative sampling, and edge_type represents an edge type of this sub-graph. I.e. each sample contains one source node src_node, one positive node pos_node, K negative nodes neg_node.
The process of sampling for each sub-graph can be divided into two links, a positive sampling link and a negative sampling link. Wherein:
the positive sampling link generates positive samples in a walk mode. A walk mode of Node2Vec may be adopted. Performing a walk on the iso-graph generates a positive sample. Node2vec Walk is a search between DFS and BFS and has proven to be very effective in network embedding (Network Embedding). Given a heterogeneous graph g= (V P ,E Q ) From each node V e V P The wandering is started. For each edge E q Pi using Node2vec Walk q And (3) performing secondary wandering, wherein each wandering obtains a sequence with the length tau: v 1 ->v 2 ->...->v τ For each sequence, a positive sample pair is obtained by sliding a window:
(src_node,pos_node,edge_type)
as shown in the sub-graph examples of fig. 4, 5 and 6, the graph includes three nodes, query is a query word of a user, item is a commodity, and ad is a search advertisement. If query1 is taken as a starting point, a Node sequence can be obtained by performing walk along a certain type of edge in a Node2Vec manner, for example: query1- > ad1- > query2- > item1- > item2. From this sequence, a series of positive sample pairs (src_node, pos_node) are obtained through a sliding window. If the sliding window size is set to 3, when the node query1 is located in the sliding window, since the sliding window size is 3, there may be ad1 and query2 at the node of the sliding window, so that the pair of samples (query 1, ad 1), (query 1, query 2) may be obtained, when the node ad1 is located in the sliding window, since the sliding window size is 3, there may be query1, query2 and item1 at the node of the sliding window, so that the pair of samples (ad 1, query 1), (ad 1, query 2), (ad 1, item 1) may be obtained, and so on, from this node sequence, the following positive pair of samples may be obtained: (query 1, ad 1), (query 1, query 2), (ad 1, query 1), (ad 1, query 2), (ad 1, item 1), (query 2, ad 1), (query 2, query 1), (query 2, item 2), (item 1, query 2), (item 1, ad 1), (item 1, item 2), (item 2, item 1), (item 2, and query 2).
For each node, a number of walks is set, i.e. the number of walks starting from the node. For the sequence obtained after each node walk, a series of positive sample pairs are obtained according to the steps described above.
The negative sampling step performs negative sampling according to two principles. For each positive sample pair (positive pair), K negative nodes are generated using negative sampling: (src_node, { neg_node } K, edge_type).
In the advertisement search scenario, each node has rich attributes (Side Information) to help describe the node. For example: item price, brand, etc. Compared with the node ID, the attributes have good generalization capability, and can help to improve the stability of the model. Since the advertisement recall scene is sensitive to the distance of the vector, two principles of negative sampling are proposed:
consistency principle: negative nodes obtained by negative sampling are required to have consistent distribution with positive nodes. If there is a different distribution of positive and negative nodes, the model will tend to "lazily" remember what the positive and negative nodes are, rather than learn the relationships between the nodes. Therefore, we use the Alias Method for weighted negative sampling to ensure that the positive and negative nodes are distributed consistently.
Correlation principle: there should be a weak correlation between the negative node and the source node. If the negative node and the source node are completely irrelevant, the model can be caused to be too easily and respectively sample positive and negative; when used online, the model cannot better separate the best advertisement from the next best advertisement. Therefore, we use category information to ensure that there is a weak correlation between the negative sample and the source node.
After walking for each node in the full graph, all positive sample pairs (src_node) are obtained. Then, the distribution of all positive nodes pos_nodes is counted, so as to obtain the frequency of each positive node pos_node. According to the principle of distribution consistency, sampling is performed according to the distribution of pos_nodes during negative sampling, namely sampling is performed according to the weights of pos_nodes. Meanwhile, according to a correlation principle, weak correlation between the source node src_node and the negative node can be ensured, and in the scene of searching advertisements by an E-commerce, category information can be used for ensuring the weak correlation. For example, the category of the statistically derived positive node and the frequency are as follows: (query 1, cat 1, 100), (query 2, cat 2, 200), (item 1, cat 1, 50), (item 2, cat 2, 50), (item 3, cat 1, 100), (item 4, cat 1, 150), (ad 1, cat 1, 150).
Then, for the positive sample pair < ad1, item1>, the category of ad1 is cat 1, so according to the correlation principle, sampling is done in item nodes of category cat 1, and there are (item 1, cat 1, 50), (item 3, cat 1, 100), (item 4, cat 1, 150) satisfying this condition. Since positive nodes cannot be the same as negative nodes, excluding (item 1, cat 1, 50), negative sampling is performed from (item 3, cat 1, 100), (item 4, cat 1, 150). According to the principle of distribution consistency, the probability of taking item3 as a negative node is 100/(100+150) =0.4, and the probability of taking item4 as a negative node is 150/(100+150) =0.6.
The selection is performed according to the category of the source node, a consistency principle is embodied, and a correlation principle is embodied according to the weight calculation probability.
Step S204: and inputting the sample set of the same batch of each subgraph into a preset machine learning model for training.
When the sample is learned, a model network corresponding to the subgraph is used, and the sample and the attribute of the sample are input into the model network for learning.
An example of a machine learning model of a subgraph is shown in FIG. 7, an example of a subgraph is shown in the lowest dashed box in FIG. 7, the subgraph is walked (walked) to obtain source nodes (src) and positive nodes (pos), and negative nodes (neg) are obtained by negative node sampling 1 、neg 2 、……、neg k ) The obtained data of each node includes a node identification (node id) and attribute information (attr) 1 、attr 2 、……、attr n ). Relevant data of a source node, a positive node and a negative node are input into a shared embedded layer (shared layer) for training learning, and sparse features of the nodes are mapped into dense features. Each node in the layer learns via a corresponding EMB model.
Step S205: and respectively obtaining the vector expression of the source node, the vector expression of the positive node and the vector expression of each negative node of each sample in the sample set of each sub-graph.
After obtaining the chip characteristics of each node, the dense characteristics of the source node pass through a neural network
To obtain a source node vector (X
src ) Positive node and K negative nodes pass through another neural network +.>
Respectively obtain positive node vectors (X)
pos ) And the negative node vectors +.>
And learning each sample to obtain the vector expression of the source node, the vector expression of the positive node and the vector expression of each negative node of each sample.
Step S206: and optimizing parameters in the machine learning model by using a preset loss function based on the obtained vector expression of each node.
Vector expression (X
src ) Vector expression of positive node (X
pos ) And a vector for each negative nodeExpression of
Respectively calculating vector expressions (X)
src ) Vector representation with positive node (X
pos ) Vector expression of each negative node->
According to the cosine distances obtained by calculation, obtaining the optimized parameter expression (O) of the machine learning model of the subgraph
rel ) The principle of obtaining the optimized parameters is to make the distances between the source node and the positive node as close as possible by calculating cosine distances between the source node and the positive node and cosine distances between the source node and the negative node respectively.
Step S204-step S206 described above, learning of the sample set of subgraphs is implemented through the model network of subgraphs as shown in fig. 7:
1) Training samples (src_node, { neg_node } K, edge_type) are obtained through walking and negative sampling, and the attribute of the node is obtained through interaction with the graph storage engine. The node attributes include ID features and other attributes such as title text information, store information, brand information, etc. (node_id, attr1, attr2, attrn …)
2) The source node, the positive node, and the negative node enter a shared layer (shared layer). This layer is an EMB (Embedding lookup layer) with the purpose of mapping sparse ID features to dense features.
3) After passing through the EMB layer, the source node passes through a DNN network alone, which is called
The positive node and the negative node share a DNN network, called +.>
Each node gets a vector expression through DNN network, and represents it as x
src 、x
pos 、x
neg1 And … …, etc.,
4) Calculating cosine distances between the source node vector expression and the positive node and the negative node so as to ensure that the source node vector expression is connected with the positive nodeThe points are as close as possible. The optimization target is the corresponding O rel 。
Step S204-step S206 described above, construct a machine learning model of the subgraph based on the Relevance (release) target:
given an iso-pattern g= (V
P ,E
Q ) P nodes and edges in Q are included. V e V for source node of p-th type
P And edge E of the q-th type
q Learning a DNN network
Wherein FC represents a fully connected layer, w and b are full connection weights and biases to be learned, ELU is an exponential linear unit activation function,
the resulting vector expression is learned.
To ensure that the vectors of the same node obtained by vector expression (Embedding) of different types of edges can be mapped to the same low-dimensional space, all target nodes (namely positive nodes and negative nodes) share the same DNN network in all types of edge relations
Wherein FC represents a fully connected layer, w and b are full connection weights and biases to be learned, ELU is an exponential linear unit activation function,
The resulting vector expression is learned.
Thus, p+p DNN networks are concurrently cooperatively learned. Wherein, P.Q networks are used for the source node and P networks are used for the destination node.
Given the q-th type of edge, V ε V
P Representing the source node, V' ∈v
P' Representing the positive node point of the network,
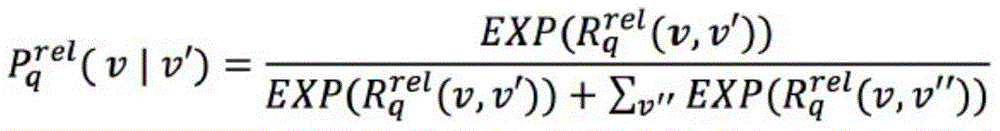
representing a negative node. Similarity between nodes is characterized using Cosine distance, and Softmax cross entropy Loss is used as release target O
rel :
Where v' represents a positive node and v "represents a negative node.
Step S207: and carrying out aggregation learning on vector expressions of the same source nodes in different subgraphs by a preset aggregation model to obtain one vector expression of the same source node.
The principle of merging the learning results of the multiple sub-graphs is schematically shown in fig. 8, the results of the multiple sub-graphs can be merged through an attention mechanism, the same node can obtain different vector expressions in different sub-graphs, and then the vector expressions of the different sub-graphs are merged into a unified expression through the attention mechanism.
Referring to FIG. 8, vector expressions of the same node are obtained in different subgraphs
Etc., fusion is carried out, and vector expression of the fused node is obtained through attention mechanism fusion +. >
Wherein (1)>
For v node, the edge type is q
1 Vector expression derived from subgraphs of->
And->
V nodes are respectively q in edge type
2 And Q.
And after carrying out fusion processing on each node in the heterogram, obtaining fused vector expression when each node is used as a source node.
Step S208: based on a vector representation of the same source node and a vector representation of positive nodes and a vector representation of each negative node included by the source node in the samples of each sub-graph, parameters of the aggregate model are optimized using a preset penalty function.
Expressing the fused source node vector according to the sample of the source node
Vector expressions (X
pos ) Vector expression of each negative node->
Performing cosine distance calculation, and obtaining optimized parameter expression (O) of the aggregation model according to each cosine distance obtained by calculation
att ) This optimization target is the corresponding O
att . The principle of obtaining the optimized parameters is to make the distance between the source node and the positive node be the same by calculating the cosine distances between the source node and the positive node and the cosine distances between the source node and the negative node respectivelyAs close as possible.
Step S208: repeating the above flow to train the sample sets of all batches for preset times to obtain a low-dimensional vector expression of each node in the heterogram, wherein one node in the heterogram corresponds to one entity in the sample data.
When the current batch of sample sets are trained and learned to obtain the vector expression of each node, the system parameters updated by the previous batch of results are used for training and the learning results of the previous batch of sample sets are replaced, so that the previous learning can influence the later learning and the last learning result is used as the reference, and the learning results can reflect the characteristics of all samples.
Step S207-step S208 described above, build an aggregate model based on Attention (Attention) objectives:
for a source node V e V
P Q low-dimensional vectors can be obtained by each type of edge
Through the Attention mechanism, the weight of each vector is automatically learned, and Q vectors are combined into a vector +.>
Wherein lambda is
pq (v) Representing the weight of the p-th type node v on the q-th type edge, z
pq The parameter to be learned is a vector, which represents the aggregation weight of the p-th node corresponding to the q-th edge. If z
pq And
if the inner product of (c) is large, then v considers the q-th side informative. Furthermore, if two nodes have similar vectors, indicating that they are closely related in the graph, there will be a similar weight distribution.
Likewise using the Cosine distance and Softmax cross entropy Loss as the Attention target O att :
Where v' represents a positive node and v "represents a negative node.
Based on the same inventive concept, the embodiment of the invention also provides a system device for acquiring the relation expression between the entities, and the system can be arranged in network equipment, cloud equipment of cloud or server equipment of architecture, user equipment and other equipment in a network. The structure of the system is shown in fig. 9, comprising: registration means 903, storage means 901, computing means 902 and parameter exchange means 904.
A storage device 901 for storing data of the iso-composition;
the calculating device 902 is configured to obtain the data of the iso-graph from the storage device through the registering device 903, learn the iso-graph by using the method for obtaining the relationship expression between the entities, and obtain a low-dimensional vector expression of each node in the iso-graph.
Parameter exchange means 904 for interacting parameters with computing means 902.
The computing device 902 obtains data of each node and edge from the storage device through the registration device 903, including:
the storage device 901 stores data of each node and each edge in the iso-graph.
The computing device 902 sends a data query request to the registration device 903, where the data query request includes information about nodes and edges to be queried; receiving a query result returned by the registration device 903, wherein the query result comprises storage device information for storing data of nodes and edges; the data of each node and edge is acquired from the corresponding storage device 901 based on the storage device information.
Based on the same inventive concept, the embodiment of the invention also provides an advertisement recall system, which is shown by referring to fig. 10, and comprises a system 101 for acquiring the relation expression between entities and an advertisement recall matching system 102;
a system 101 for obtaining a relational expression between entities, configured to split a pre-constructed heterogeneous graph into sub-graphs according to types of edges, where a sub-graph includes an edge of a type; the node types in the iso-graph include: at least one of advertisement, commodity and query word, wherein the type of the edge comprises at least one of clicking edge, co-clicking edge, collaborative filtering edge, content semantic similarity edge and attribute similarity edge;
sampling each sub-graph to obtain a sample set of each sub-graph, wherein each sample of the sample set comprises a source node, a positive node and at least one negative node;
inputting the sample set of the same batch of each sub-graph into a preset machine learning model for training to respectively obtain vector expression of a source node, vector expression of a positive node and vector expression of each negative node of each sample in the sample set of each sub-graph; optimizing parameters in the machine learning model by using a preset loss function based on the obtained vector expression of each node;
The method comprises the steps of performing aggregation learning on vector expressions of the same source nodes in different subgraphs by a preset aggregation model to obtain one vector expression of the same source nodes; optimizing parameters of an aggregation model by using a preset loss function based on a vector expression of the same source node and a vector expression of positive nodes and a vector expression of each negative node included in samples of each subgraph by the source node;
and repeating the flow to train the sample sets of all batches for preset times to obtain a low-dimensional vector expression of each node in the heterogeneous graph, wherein one node in the heterogeneous graph corresponds to one entity in the sample data.
The advertisement recall matching system 102 is configured to determine a matching degree between the query word node, the commodity node and the search advertisement node by using the low-dimensional vector expressions of the query word node, the commodity node and the search advertisement node obtained by the system for obtaining the relation expression between entities, and select a search advertisement matching with the commodity and the query word according to the matching degree.
The system for acquiring relationship expression among entities 101 samples each sub-graph to obtain a sample set of each sub-graph, including:
For each sub-graph, respectively performing random walk by taking a selected node as a starting point to obtain at least one node sequence corresponding to each sub-graph; obtaining a positive sample set corresponding to each sub-graph from the node sequence by using a preset sliding window, wherein one positive sample in the positive sample set comprises a source node and a positive node;
and sampling negative nodes once based on the positive sample set corresponding to each sub-graph to obtain a sample set corresponding to each sub-graph, wherein one sample in the sample set comprises a source node, a positive node and at least one negative node, the distribution of the negative nodes and the positive nodes is consistent, and the negative nodes and the preset attribute of the source node are relevant.
The system for acquiring the relationship expression among the entities 101 inputs the sample set of the same batch of each sub-graph into a preset machine learning model for training to respectively obtain the vector expression of the source node, the vector expression of the positive node and the vector expression of each negative node of each sample set of each sub-graph, and the system comprises the following steps:
inputting source nodes, positive nodes, negative nodes and attribute information of each node included in each sample in a sample set into a machine learning model aiming at the sample set of the same batch of each subgraph;
Mapping sparse features of nodes included in the sample into dense features through an embedding layer of the machine learning model;
the method comprises the steps that the dense features of a source node are trained through a corresponding machine learning model network to obtain vector expressions of the source node, and the dense features of a positive node and a negative node are trained through a corresponding machine learning model to obtain vector expressions of the positive node and each negative node.
The system for acquiring the relationship expression between entities 101 optimizes parameters in the machine learning model by using a preset loss function based on the obtained vector expression of each node, and comprises:
according to the vector expression of the source node, the vector expression of the positive node and the vector expression of each negative node of each sample obtained through training, the cosine distances between the source node and the positive node as well as between the source node and the cosine distances between the source node and between source node and each negative node are calculated;
and optimizing parameters in the machine learning model by a preset loss function based on the cosine distance.
The system for acquiring the relation expression among the entities 101 acquires the relation expression among the entities, and performs aggregation learning on the vector expressions of the same source nodes in different subgraphs through a preset aggregation model to acquire one vector expression of the same source node, and the method comprises the following steps:
Determining the weight of the vector expression of the source node obtained by training from each subgraph according to each vector expression of the source node obtained by training each subgraph and a corresponding learning weight factor;
and carrying out weighted summation on the vector expressions trained by the source node from each subgraph by using the determined weights to obtain a vector expression aggregated by the source node.
The system for acquiring the relationship expression between entities 101 optimizes parameters in the machine learning model by using a preset loss function based on the obtained vector expression of each node, and comprises:
according to the vector expression of the source node, the vector expression of the positive node and the vector expression of each negative node of each sample obtained through training, the cosine distances between the source node and the positive node as well as between the source node and the cosine distances between the source node and between source node and each negative node are calculated;
and optimizing parameters in the machine learning model by a preset loss function based on the cosine distance.
Optionally, the advertisement recall matching system determines a matching degree between the query term node, the commodity node and the search advertisement node, including:
converging the low-dimensional vector expression of the query word node and the low-dimensional vector expression of the commodity node clicked by the user under the same query word by using an attention mechanism to obtain the low-dimensional vector expression of the virtual request node; the virtual request node is a virtual node constructed by a query word node and commodity nodes clicked by a user in front under the query word;
And determining the matching degree among the query word node, the commodity node and the search advertisement node according to the low-dimensional vector expression of the virtual request node and the low-dimensional vector expression of the search advertisement node.
Optionally, the advertisement recall matching system selects a search advertisement matching the matching degree of the commodity and the query word to meet the set requirement according to the matching degree, and the advertisement recall matching system comprises:
and selecting the search advertisement with the distance meeting the set requirement according to the cosine distance between the low-dimensional fusion information vector of the virtual request node and the low-dimensional fusion information vector of the search advertisement node.
The embodiment of the invention also provides a computer readable storage medium, on which computer instructions are stored, which is characterized in that the method for obtaining the relation expression between entities is realized when the instructions are executed by a processor.
The embodiment of the invention also provides a heterogeneous chart learning device, which comprises: the system comprises a memory, a processor and a computer program stored in the memory and capable of running on the processor, wherein the processor realizes the method for acquiring the relation expression between the entities when executing the program.
The specific manner in which the various devices and modules perform the operations in relation to the systems of the above-described embodiments have been described in detail in relation to the embodiments of the method and will not be described in detail herein.
Unless specifically stated otherwise, terms such as processing, computing, calculating, determining, displaying, or the like, may refer to an action and/or process of one or more processing or computing systems, or similar devices, that manipulates and transforms data represented as physical (e.g., electronic) quantities within the processing system's registers or memories into other data similarly represented as physical quantities within the processing system's memories, registers or other such information storage, transmission or display devices. Information and signals may be represented using any of a variety of different technologies and techniques. For example, data, instructions, commands, information, signals, bits, symbols, and chips that may be referenced throughout the above description may be represented by voltages, currents, electromagnetic waves, magnetic fields or particles, optical fields or particles, or any combination thereof.
It should be understood that the specific order or hierarchy of steps in the processes disclosed are examples of exemplary approaches. Based on design preferences, it is understood that the specific order or hierarchy of steps in the processes may be rearranged without departing from the scope of the present disclosure. The accompanying method claims present elements of the various steps in a sample order, and are not meant to be limited to the specific order or hierarchy presented.
In the foregoing detailed description, various features are grouped together in a single embodiment for the purpose of streamlining the disclosure. This method of disclosure is not to be interpreted as reflecting an intention that the claimed embodiments of the subject matter require more features than are expressly recited in each claim. Rather, as the following claims reflect, invention lies in less than all features of a single disclosed embodiment. Thus the following claims are hereby expressly incorporated into this detailed description, with each claim standing on its own as a separate preferred embodiment of this invention.
Those of skill would further appreciate that the various illustrative logical blocks, modules, circuits, and algorithm steps described in connection with the embodiments disclosed herein may be implemented as electronic hardware, computer software, or combinations of both. To clearly illustrate this interchangeability of hardware and software, various illustrative components, blocks, modules, circuits, and steps have been described above generally in terms of their functionality. Whether such functionality is implemented as hardware or software depends upon the particular application and design constraints imposed on the overall system. Skilled artisans may implement the described functionality in varying ways for each particular application, but such implementation decisions should not be interpreted as causing a departure from the scope of the present disclosure.
The steps of a method or algorithm described in connection with the embodiments disclosed herein may be embodied directly in hardware, in a software module executed by a processor, or in a combination of the two. A software module may reside in RAM memory, flash memory, ROM memory, EPROM memory, EEPROM memory, registers, hard disk, a removable disk, a CD-ROM, or any other form of storage medium known in the art. An exemplary storage medium is coupled to the processor such the processor can read information from, and write information to, the storage medium. In the alternative, the storage medium may be integral to the processor. The processor and the storage medium may reside in an ASIC. The ASIC may reside in a user terminal. The processor and the storage medium may reside as discrete components in a user terminal.
For a software implementation, the techniques described herein may be implemented with modules (e.g., procedures, functions, and so on) that perform the functions described herein. These software codes may be stored in memory units and executed by processors. The memory unit may be implemented within the processor or external to the processor, in which case it can be communicatively coupled to the processor via various means as is known in the art.
The foregoing description includes examples of one or more embodiments. It is, of course, not possible to describe every conceivable combination of components or methodologies for purposes of describing the aforementioned embodiments, but one of ordinary skill in the art may recognize that many further combinations and permutations of various embodiments are possible. Accordingly, the embodiments described herein are intended to embrace all such alterations, modifications and variations that fall within the scope of the appended claims. Furthermore, as used in the specification or claims, the term "comprising" is intended to be inclusive in a manner similar to the term "comprising," as interpreted when employed as a transitional word in a claim. Furthermore, any use of the term "or" in the specification of the claims is intended to mean "non-exclusive or".