Detailed Description
The invention is further illustrated with reference to the figures and examples.
As shown in FIG. 1, the invention provides a method for detecting and analyzing abnormal behavior individuals and groups of students based on unsupervised clustering and community discovery algorithm, which mainly comprises the following steps:
step 1: extraction of key features of abnormal behaviors of students
The method comprises the steps of extracting student activity behavior characteristics from four dimensions of time, space, activity rules and social situations; wherein the behavior activity rule comprises AvgCardose (average number of usage of student cards) and TransMoney (transaction amount of student cards); consumption law characteristics include HotTimeFre (peak consumption), NorUseFre (number of normal consumption); the temporal dimensional features include LocDiff (location entropy of activity), and the spatial dimensional features include TimeDiff (time entropy of activity); social situation characteristics include MatSocLength (personal social network size), MatSocFre (personal social frequency). And finally, constructing an activity characteristic sequence for each individual based on the 8-dimensional key activity characteristic indexes so as to quantify the behavior rules of the individual in the process of calibration.
The AvgCarduse (average student card use times) is the ratio of the use times of the individual one-card to the average use times, the use of the one-card is used as an important index of an activity record of the individual in a limited activity place, the activity frequency of the individual in a given interval can be definitely obtained, the activity of the individual is stronger when the AvgCarduse value of the individual is larger, and the activity of the individual is lower when the AvgCarduse value is smaller.
TransMoney (student card transaction amount) is the size of transaction amount of an individual in a given time interval, the transaction amount refers to simple output of the amount, and as all consumption of the student individual in a campus is campus card expenditure, the consumption degree of one individual can determine the consumption level of the individual in the given time interval.
HotTimeFre (consumption in peak time period) is the frequency of consumption of an individual in the peak time period, the activity place and the activity place of a student in a daily period are approaching, the consumption frequency in the peak time period can represent the degree of the daily travel regularity of the student, and a person carrying out specified activities in the conventional time can be considered to be regularly developed. Students with low index are very easy to have self-closing condition.
NorUseFre (normal consumption times) records the normal activity item days of an individual during a school, various earmark machines and consumption machines exist in a campus to provide various life activities of students, three meals a day are used as the activity basis of the students, and the index can describe the regulation degree of the students during the school.
LocDiff (entropy of activity place) is a characteristic index based on place dispersion degree, which is provided by the invention, and the main purpose of the LocDiff is to measure the disturbance degree of students active in different places, and the calculation formula is shown as formula (1), wherein L is
uIs the overall campus activity area accessed by individual u. O is
l,u={o∈L
u&o e L is the particular site parcel visited by individual u. I P
uAnd | is the total number of accesses of u in a particular area. P
u(l) Is the probability that individual u accesses a particular campus activity area l,
generally, the degree of location dispersion represents the degree of activity of a person under regular work and rest, and when the value is shown to be maximum or minimum, the probability of being a potentially abnormal individual is higher.
TimeDiff (activity time entropy) is a characteristic index based on time dispersion degree, which is provided by the invention, and the main purpose of the TimeDiff is to measure the disturbance degree of students performing activities at different times, and the calculation formula is shown in formula (2), wherein T is
uIs the overall time period distribution when an individual u visits a campus activity area. O is
t,u={o∈T
u&o e T is a specific time period T for individual u to visit a site. I P
uAnd | is the total number of accesses of u in a particular period. P
u(t) is the probability that individual u visits a certain campus activity area during a certain time period t,
generally, when extreme values of the secondary features are extremely large, the time abnormality of students is higher, and the possibility of abnormality is higher.
MatSocLength (personal social network size) is a characteristic index for measuring the social range of students, which is provided by the invention and aims to measure the number of social partners of an individual and a common campus activity event, the campus activity is calculated by arranging the campus activities in sequence, the campus activities comprise canteen consumption, supermarket consumption, library consumption and shower consumption, and D is { S ═ S { (S consumption)z,Tz,LzIn which SzThe symbol refers to the school number where the campus activity takes place; t isz,LzRespectively representing the location and time at which the Z event occurred. The method comprises the steps of determining one individual and another individual, considering that a certain social relationship exists in a small probability calculation formula (3) when common student events occur for multiple times under the condition of excluding small probability, adding screening small probability events to prior factors of cross-domain and cross-grade students by using prior knowledge, and constructing a social network according to the theoretical course, wherein the length of the social network can measure the activity degree of one person and other persons in the activity behavior, and finding out that an orphaner exists in a campus.
MatSocFre (personal social frequency) is a characteristic index for measuring the social frequency of students, which is provided by the invention and aims to measure the number of times that an individual interacts with other people in the network, and an individual with too small social network or too small social frequency can be considered as abnormal of the individual.
By extracting the characteristics of individual students existing in the campus, the limited range of the extracted characteristics is determined. After the characteristics are determined, because the relevance between the characteristics is presented back on the numerical value or the behavior rule, and the influence of the input high-dimensional data on the result of the next step is considered, the method uses the Pearson correlation coefficient to screen the characteristics, screens the characteristics with strong relevance between the characteristics and the characteristics by using the relevance between the data, and leaves the characteristics with strong independence as the identification of the individual. The Pearson correlation coefficient is specifically calculated as shown in formula (4), wherein
σAσBRepresents the standard deviation of the A feature and the B feature
For the mean value of the features, the correlation coefficient metric is used to take the value at [0,100 ]]Wherein the higher the correlation, the higher the correlation coefficient. The specific screening results are shown in the attached graph.
Step 2: student abnormal class extraction based on unsupervised clustering mode
As the individuals present different distribution characteristics on the campus activities, the scheme adopts a K-Means algorithm to perform cluster analysis. The algorithm has higher computing performance and grouping precision and is widely favored by learners at present, and the working principle of the algorithm is as follows: according to the similarity of individual campus activity feature dimensions, individuals with similar feature rules are gathered into one class, and finally k different feature rule classes are obtained. If only an individual with abnormal characteristic rules is contained in a certain class, the class is called an abnormal class; if a certain class is mixed with abnormal individuals and normal individuals, the class is called a mixed class.
The convergence condition of the K-Means algorithm is that the accumulated dissimilarity of the individual features in all the classes is minimum, and the clustering evaluation index SSE can be used for quantitative representation. SSE refers to the cumulative sum of the distances of any sample point from the center point within the classes of all classes. Generally, SSE is inversely proportional to the degree of intra-class aggregation, and the smaller the SSE, the greater the degree of intra-class aggregation, the better the clustering effect. The SSE is calculated according to the formula (6). Wherein x is any sample point of the ith class and represents the characteristics of the ith classA signature sequence of any individual under the pattern category; c. CiThe cluster center of the ith class represents a typical characteristic sequence under the characteristic mode class of the ith class; dist (x, c)i) Is x and ciRepresents the dissimilarity degree between the characteristic sequence of the selected individual in the i-th class of characteristic patterns and the typical characteristic sequence.
Since the K-Means algorithm requires a preset number of clusters K. The conditions for this value to be optimal are that the cumulative dissimilarity of the individuals within all classes is minimal and that the cumulative dissimilarity between all classes is maximal. The invention uses a hierarchy-based clustering algorithm to determine an initial K value as a clustering effect reference. The inter-class coupling can be quantitatively expressed by a cluster evaluation index SSB using the inter-class cumulative dissimilarity. SSB refers to the cumulative sum of the euclidean distances of the centroid within all classes to the centroid of the full volume data set. Generally, SSB is proportional to the degree of separation between classes, and when SSB is larger, the degree of separation between classes is larger, and the clustering effect is better. The SSB is calculated in the formula (7). Wherein c is the centroid of the whole volume data set, representing the cluster center of the whole individual; m isiIs the number of samples in the ith class and represents the number of all individuals under the ith class of feature.
The invention adopts relative abnormal operator ROCF (relative outlier cluster factor) to judge the abnormal degree of each class of campus individuals obtained by unsupervised clustering, the working principle of the algorithm is that on the basis that the abnormal individuals are small-probability events, the classes with abnormal mutation are regarded as small-probability existing classes, and the small-probability existing classes are regarded as abnormal classes; in contrast, in the coincidence class, there are a large number of normal individuals, and therefore the individual capacity is greater than the number of abnormal individuals. After the clustering conclusion is obtained according to the clustering effect based on the idea, the relative change rate of the number in the class according to the abnormal class and the adjacent mixed class generates mutation, thatCorresponding mutations in ROCF (i) also occur. Based on this, the cluster categories are combined into a set S, and S ═ S
i(i ═ 1,2, …, k); will S
iIs defined as the class size | S
iL. Arranging the classes in the S according to the ascending order of the class sizes, aiming at two abnormal classes S with continuous volumes and adjacent mixed classes S
i+1Using TL (S)
i) To quantize the representation class S
iAnd S
i+1Relative rate of change over a volume-like range, and
then, class c
iRelative anomaly factor ROCF (S)
i) Is about the relative rate of change TL (S) of the volume class
i) The calculation method of the exponential function of (4) is shown in equation (8).
ROCF (S) is shown by the formula (8)
i) Is between [0,1]Range, when ROCF (S)
i) The larger, class S
iThe higher the degree of abnormality of (a). When abnormal class S
iAnd mixed class S
i+1Adjacent, class S
iRelative anomaly factor ROCF (S)
i) Will obviously approach to 1, can effectively represent the class S
iThe abnormality-like abnormality of (1). Multiple groups of experimental results show that when ROCF (S)
i) When the critical threshold value is exceeded by 0.1,
means from S
iTo S
i+1The class S in the set S has larger volume change
1To S
i(i>1) Are all abnormal classes and all individuals within these classes will be labeled as abnormal individuals. Providing ROCF (S)
i) Less than 0.1 of the critical threshold value,
means from S
iTo S
i+1Has a small volume change, and is identified as S
iAnd not an exception class.
And step 3: group-based abnormal individual behavior analysis based on local abnormal factor algorithm
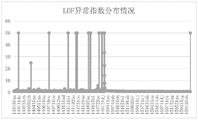
The unsupervised clustering result under the characteristic feature selection can be obtained through the steps, wherein abnormal classes and mixed classes exist in the obtained classes through clustering. All individuals in the class are marked as abnormal individuals aiming at the abnormal class, the individual characteristics mentioned in the step 1 are used as calculation indexes aiming at the mixed class, and the individuals in the mixed class are judged by using a density-based measurement method LOF (local outlier factor). The LOF algorithm is a density-based algorithm, and the idea is to calculate Kth short distances of all points, calculate local density, and obtain an outlier index of an individual point by comparing the reciprocal of the local density with the average value of the local density, wherein the calculation formula is shown as formula (9).
The molecular part comprises the average value of local densities of all the points, the closer the ratio is to 1 by the quotient of the average value and the reachable density of the point, the closer the ratio is to 1, the closer the density of the individual point is to the normal point, when the ratio is less than 1, the density of the point is higher than that of other points, and when the ratio is more than 1, the density of the point is higher than that of other neighborhood points, the point can be considered as an abnormal point.
In the method, whether the individual is abnormal or not is determined by calculating the LOF of the individual, individual verification is carried out in the mode of combining the abnormal individual with other data of a campus, investigating and consulting and the like in the research, a corresponding LOF threshold value is set according to a small probability event factor, the individual above the threshold value is regarded as an abnormal behavior individual, and the abnormal behavior individual is marked.
And 4, step 4: abnormal population detection based on spatiotemporal correlation analysis
The abnormal individuals with the labels can be obtained through the work, the abnormal group detection based on the time-space correlation analysis is carried out in the step, and as students may have the same abnormal behaviors in the campus, the automatic detection function of the abnormal groups is realized through the method, and the function provides a more scientific and convenient judgment basis for campus managers.
Firstly, measuring the degree of association of two or more individuals, selecting a proper operator to calculate the similarity, and referring to the similarity with high dimension presented by the two individuals in time and space. The invention adopts two types of operators to measure the similarity of campus individuals, wherein the first one measures the behavior rule by utilizing characteristic indexes, and the calculation formula is shown as a formula (10)
pAnd m
qThe euclidean distance featSim (p, q), where,
or
Represents m
pOr m
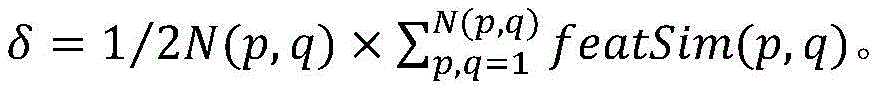
qSo that the similarity of p and q mobile patterns mobSim (p, q) can be expressed as an exponential inverse function of the difference of the two mobile patterns featSim (p, q), where δ is a power balance operator for ensuring that mobSim (p, q) is between [0,1 [ ]]Within a range of and
the second is a common operator ActSim (p, q) based on space-time activities, and the calculation formula is shown in formula (11), where ActNum is the total number of all student interactions divided by a certain time difference (J ═ 10min), act (PQ) is the frequency of the same interaction events of two students in the same activity sequence, and len (a)kpq) Is the total number of individuals in this common sequence in the case of Act (pq) occurrence.
Constructing an analysis graph G based on space-time correlation by measuring two similarity operators, wherein G is (V, E), wherein V, E respectively refers to points and edges in the space-time correlation analysis graph, the points represent two relatively independent individuals, the edges connect the two individuals, and E is obtained when p ', q' is belonged to Vp′q′And E, constructing a space-time association analysis graph by using the similarity metric values in the steps as the weight of the association analysis graph, so that the construction of a campus space-time association analysis network is facilitated, and a basis can be provided for abnormal group discovery.
The invention adopts a BGLL algorithm based on modularity Q optimal to detect the association degree of different individuals under different edge weight quantization modes, the algorithm is one of the community division algorithms which are considered to be the fastest at present due to the high running speed of the algorithm, the principle adopts the idea of optimal modularity Q to divide modules, and the calculation formula is shown as a formula (12). Where W (p, q) is a weight referring to the connecting edge of nodes p 'and q', kp′Or kq′Refers to the sum of the edge weights of all neighboring nodes p 'or q', and m is the sum of all weights in the network. The aggregation in the module and the dispersion among the groups are measured by measuring the size of the modularity.
Firstly, all points in a space-time association graph are taken as independent individual communities, nodes adjacent to the points and the modularity of the associated nodes in the communities are calculated in an iterative mode, and if a new node is added in the communities to obtain non-negative modularity, the new node is proved to be consistent with the communities. And screening an adding scheme which enables the modularity to be maximum according to conditions, enabling the modularity of the network to be maximum, and forming high aggregation community modules with respective target points and communities after one iteration. And then, dividing the partial community generated in the first step into a new individual point, which is equivalent to the original association diagram, and performing second iteration in the first step until the modularity is not increased any more.
Example 1:
selecting one-card dining room consumption data, bathroom shower data, supermarket consumption data and library consumption data of students in high schools, such as Beijing, as original data, wherein the time comprises 3 months to 7 months in 2015, and 590 ten thousand pieces of text data are contained.
The method for detecting and analyzing abnormal behavior individuals and groups of students based on unsupervised clustering and community discovery algorithm comprises the following steps:
step 1: extraction of key features of abnormal behaviors of students
As described above, the above features are extracted for the basic individuals in the whole population, wherein the student attribute dimension includes student id (student card number), avgcardose (student card average number of usage), and TransMoney (student card transaction amount); consumption law characteristics include HotTimeFre (peak consumption), NorUseFre (number of normal consumption); the spatio-temporal dimensional features include LocDiff (location entropy of activity), TimeDiff (time entropy of activity); social activity characteristics include MatSocLength (personal social network size), MatSocFre (personal social frequency).
Step 2: student abnormal class extraction based on unsupervised clustering mode
On the basis of feature extraction, an unsupervised clustering mode is selected for extracting abnormal classes of students, a K-Means algorithm is used for carrying out clustering analysis on selected samples, and the K is assigned to carry out judgment on the clustering number. Individuals with the same or similar characteristic patterns in a high-dimensional space are classified into one class in a clustering mode, the clustering effect is measured according to the intra-class aggregation degree and the inter-class aggregation degree, if all the individuals in the class are abnormal student samples, the class is called as an abnormal class, and if not, the class is a mixed class. In the step, whether the divided class is an abnormal class is judged through a ROCF (relative outlier cluster factor) relative abnormal algorithm.
And step 3: group-based abnormal individual behavior analysis based on local abnormal factor algorithm
Based on the extracted abnormal class and the mixed class, analyzing the individuals in the class one by one, calculating the abnormal index of the individuals which belong to the abnormal class and are determined to be abnormal individuals by using a density-based LOF operator, measuring the numerical value of the abnormal index according to a statistical analysis method and an actual verification method, calculating the LOF abnormal factor by dividing different K short distances, and using different specified abnormal index samples.
And 4, step 4: abnormal population detection based on spatiotemporal correlation analysis
Based on the theory and verification, abnormal individuals with high abnormal possibility can be obtained, and students with similar space-time patterns and attribute characteristic rules in a large-scale student range are called potential abnormal students. According to daily behavior activities of students in a school, similarity operators are used for measuring similarity of the students under space-time activities as feature measurement, similarity among abnormal behavior individuals is measured in a multi-dimensional mode on the basis of abnormal high students, a space-time correlation analysis graph is constructed, edges represent similar correlation connection, and weights represent similar correlation indexes. And automatically detecting the potential abnormal population by adopting a GBLL algorithm based on modularity optimization.
The above description is only a preferred embodiment of the present invention, and is not intended to limit the present invention in any way, and all simple modifications, equivalent variations and modifications made to the above embodiment according to the technical spirit of the present invention still belong to the protection scope of the technical solution of the present invention.