Disclosure of Invention
The invention aims to provide a compressed sensing radar imaging simulation method which has the advantages of high calculation precision and saving calculation memory requirement and calculation time and can provide important reference data for compressed sensing synthetic aperture radar imaging simulation analysis.
The technical scheme for realizing the purpose of the invention is as follows:
a compressed sensing radar imaging algorithm based on subspace tracking comprises the following steps:
firstly, setting scanning parameters such as frequency and angle, calculating corresponding target model by using a physical optical method to obtain scattered field data serving as original signals
;
Secondly, reading echo data, and performing undersampling on the echo data, wherein interval sampling is adopted, namely the number of sampling points is reduced to half of the original number;
thirdly, designing sparse basis function according to undersampled echo signal
,
,
;
N a The number of original sampling points satisfying the Nyquist sampling theorem in azimuth direction, and
N r then the number of sampling points in the distance direction is obtained to obtain a sparse matrix
In general, a radar imaging method for a target area by adopting a compressed sensing theory is to directly decode and reconstruct received echo data;
the fourth step, establish the corresponding equation
Wherein
For observing matrix
And sparse matrix
The product of (a) and (b),
as the original signal
In the observation matrix
Then solving an equation by adopting a compressed sensing reconstruction algorithm to obtain a backscattering coefficient
Here, a subspace tracking algorithm is employed, in each iteration, replacing a single atom by a subspace spanned by a plurality of atoms, and approximating the signal by an orthogonal projection of the signal onto the subspace. Because a plurality of best-matched time-frequency atoms are selected during each iteration, the probability of occurrence of an over-matching phenomenon can be effectively reduced. The orthogonal projection on the subspace is used for approximating the signal, so that the residual energy reduction speed is accelerated, the orthogonal projection can be obtained through a least square algorithm, the calculation complexity is not greatly increased, and the convergence speed is accelerated. Finally according to
The reconstructed echo is obtained and the reconstructed echo is obtained,
the above sparse matrix.
And fifthly, combining the echo data reconstructed by the subspace tracking method with the existing imaging algorithm, performing range direction compression on the echo data, and performing imaging by adopting a back projection algorithm.
Compared with the prior imaging technology, the invention has the following remarkable advantages: (1) the sampling rate is reduced. The compressed sensing technology is applied to the synthetic aperture radar imaging, and the sampling rate breaks through the limit of the Nyquist criterion; (2) the imaging result is stable. The compressed sensing reconstruction algorithm adopts a subspace tracking algorithm, and has an obvious effect compared with a common orthogonal matching tracking algorithm; (3) the noise resistance is enhanced. After noise is added into the echo, the imaging result after the compressed sensing technology is better than the traditional imaging effect; (4) the accurate calculation result can be used as an important reference for compressed sensing synthetic aperture radar imaging simulation, and experimental test cost is saved.
The present invention is described in further detail below with reference to the attached drawing figures.
Drawings
Fig. 1 is a schematic diagram of conventional codec theory.
Fig. 2 is a block diagram of codec theory based on compressed sensing.
Fig. 3 is a schematic diagram comparing the flow of the conventional radar imaging method and the CS method.
FIG. 4 is a subspace tracking algorithm flow chart.
Fig. 5 is a flowchart of an orthogonal matching pursuit algorithm.
FIG. 6 is a schematic diagram of a compressed sensing radar imaging simulation.
Fig. 7 is a schematic diagram of an inverse synthetic aperture radar imaging model.
Fig. 8 is a flowchart of the backprojection algorithm.
FIG. 9 is an X-band double-output imaging result diagram (no noise condition), (a) a double-output model diagram; (b) full-sampling traditional algorithm imaging results; (c) an OMP algorithm imaging result with a sampling rate of 50%; (d) and (c) imaging the result by the SP method with the same data volume.
FIG. 10 is a graph of X-band double-alive imaging results (noisy case), (a) full-sampled conventional algorithmic imaging results; (b) the imaging result of the traditional algorithm with full sampling and SNR =10 dB; (c) imaging results of SP algorithm with 50% sampling rate; (d) SP method imaging results at 50% sampling rate and SNR =10 dB; (e) an OMP algorithm imaging result with a sampling rate of 50%; (f) OMP method imaging results at 50% sampling rate and SNR =10 dB.
FIG. 11 is a diagram showing the result of imaging of a certain warhead in Ku band, (a) a diagram showing a model of the warhead; (b) full-sampling traditional algorithm imaging results; (c) an OMP algorithm imaging result with a sampling rate of 50%; (d) and (c) imaging the result by the SP method with the same data volume.
Detailed Description
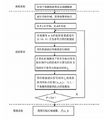
According to the compressed sensing radar imaging algorithm based on subspace tracking, echo data are obtained by adopting a physical optical method and are subjected to undersampling. Then designing sparse basis functions according to the form of echo signals. Secondly, a corresponding compressed sensing reconstruction algorithm is called to restore the signal. And finally, imaging the image by adopting a traditional imaging method. The method can ensure the imaging quality and reduce the sampling rate, thereby relieving the hardware pressure.
Referring to fig. 2, a theoretical block diagram of coding and decoding based on compressed sensing, it can be clearly seen that, compared with fig. 1, compressed sensing radar sampling and coding occur simultaneously, and the nyquist sampling criterion does not need to be satisfied. Fig. 4 is a flowchart of a subspace tracking algorithm, and fig. 5 is a flowchart of an orthogonal matching tracking algorithm. Fig. 4 and 5 show specific operation flowcharts of two algorithms, and it is seen from the flowchart of fig. 4 that the input parameters of the subspace tracking algorithm include the estimation of the sparsity K and the improvement of the orthogonal matching tracking algorithm in the optimization process, so that the stability of solving the optimization equation to obtain the optimal solution is increased, the imaging quality is improved, and the running time can be accelerated. By way of example, it is also shown that the subspace algorithm is better than the orthogonal matching pursuit algorithm in terms of noise immunity. With reference to fig. 6, the method of the invention based on compressed sensing synthetic aperture radar imaging simulation analysis comprises the following steps:
firstly, establishing a geometric model of a target to be measured, and setting relevant parameters of the target: initial frequency, frequency interval, bandwidth, initial angle, angle interval and angle range, and calculating the target return by physical optical methodWave data as a raw signal
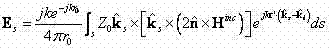
. The physical optical method starts from the Stratton-Chu formula, and introduces a physically reasonable high-frequency hypothesis: the contribution of a certain point on the object to the scattered field of other points of the object is very small compared with the incident field, so that the coupling effect among the sub scattering units is ignored, and the solving process is simplified. According to the physical optical approximate condition and the far field approximate condition, a basic formula of a physical optical method for solving the far field scattering field is as follows:
wherein,
r 0is the distance from the origin of coordinates to the viewpoint,
r' is the position vector of the source point,
kin terms of the wave number, the number of waves,
is the incident direction of the electromagnetic wave,
is the direction in which the electromagnetic wave is scattered,
is the external phasor of the incident plane,
Z 0as the impedance in free space is to be,
Y 0in order to be a free-space admittance,
Jand
Mrepresenting the equivalent induced current and magnetic current, respectively, of the surface of the object. Due to existence of relational expression
Thus, either of the above two equations can be used to calculate the far field. For metal meshThe induced magnetic current is 0 and the induced current is
. Thus, far-field scattering can be reduced to
Thereby obtaining the echo data of the target.
And secondly, undersampling the echo, wherein the common downsampling method is realized by reducing the distance direction sampling rate or the pulse repetition frequency, and the sampling rate of 50% is used for sampling data at intervals along the distance direction.
Thirdly, designing sparse basis function according to undersampled echo data
,
,
;
N a The number of original sampling points satisfying the Nyquist sampling theorem in azimuth direction, and
N r then the number of sampling points in the distance direction is obtained to obtain a sparse matrix
(ii) a From received undersampled echo signals
Structural sparse foundation
Is composed of
R B Is the shortest distance from the radar route to the target, namely the vertical distance, j is an imaginary unit,
in order to be a fast time,
is a slow time
t c In the form of a transverse time,
γin order to adjust the frequency of the frequency,
and
respectively a rectangular window function and an azimuth window function of the transmitted signal.
The original signal
Is projected onto a set of measurement vectors
To obtain a measured value
Written in the form of a matrix
,
Referred to as an observation matrix, in which
xIs that
A column vector of the dimension(s),
yis that
The column vector of the dimension, the observation matrix, is typically taken as a gaussian matrix.
Fourthly, establishing a corresponding equation according to the contentSolving an equation by adopting a subspace tracking algorithm in a compressed sensing reconstruction algorithm, wherein the method comprises the following specific steps:
first, calculate
The position corresponding to the medium maximum value is recorded as
,
Represents the transpose of matrix a;
two, calculating residual vector
Where + represents the pseudo-inverse of the matrix;
III, if
If yes, quitting; otherwise, it orders
Calculating
Get it
The position corresponding to the largest element is recorded as
Calculating a new residual vector
. If it is
Quit, otherwise, order
And substituting for recalculation. According to
The reconstructed echo is obtained and the reconstructed echo is obtained,
the above sparse matrix.
And fifthly, combining the echo data reconstructed by the subspace tracking method with the existing imaging algorithm, compressing the reconstructed echo data in a distance direction, and imaging by adopting a back projection algorithm. The back projection algorithm comprises the following specific steps:
1. performing Fourier inverse transformation on the distance direction of the frequency domain data obtained by reconstruction to obtain time domain data, namely performing pulse compression on the distance direction;
2. and performing superposition processing on the time domain data subjected to pulse compression through time alignment to realize azimuth focusing, thereby obtaining the pixel value of each point in the imaging area, namely the desired imaging graph.
In order to verify the effectiveness of the method, simulation experiments are compared with other methods by combining different targets.
1. Comparison of imaging results by double overview (noise free case)
Fig. 9 shows a result diagram of X-band double-generic imaging, where the number of distance sampling points is 41, the number of azimuth sampling points is 1441, and the scanning angle is 360 °. The graph (a) shows a double-generic model graph, the graph (b) shows an imaging result graph of a conventional BP algorithm, the graph (c) shows an imaging result graph in which a CS-theoretical OMP algorithm is applied and a distance-to-sampling rate is 50% of the graph (b), and the graph (d) shows an imaging result graph in which a CS-theoretical SP algorithm is applied and a distance-to-sampling rate is 50% of the graph (b).
2. Comparison of imaging results by double output (noisy conditions)
Fig. 10 shows an imaging result of double overview in the Ku band case, where the distance direction sampling points are 61, the azimuth direction sampling points are 1441, and the scanning angle is 360 °. Fig. (a) shows an imaging result graph of a conventional BP algorithm, fig. (b) shows an imaging result graph of a conventional synthetic aperture radar with SNR =10dB, fig. (c) shows an imaging result graph with a range-wise sampling rate of 50% of fig. (a) by applying a CS-theory SP algorithm, and a range-wise sampling rate of 50% of fig. (a) with SNR =10dB, fig. (e) shows an imaging result graph with a range-wise sampling rate of 50% of fig. (a) by applying a CS-theory OMP algorithm, and fig. (f) shows an imaging result graph with a range-wise sampling rate of 50% of fig. (a) by applying a CS-theory OMP algorithm, and a range-wise sampling rate of 50% of fig. (a) with SNR =10 dB.
3. Comparison of imaging results for a warhead
Fig. 11 shows an image of the result of the imaging of a certain warhead in the Ku band, where the distance direction sampling points are 61, the azimuth direction sampling points are 721, and the scanning angle is 360 °. The diagram (a) shows a model diagram of a warhead, the diagram (b) shows an imaging result diagram of a conventional BP algorithm, the diagram (c) shows an imaging result diagram in which a CS theory OMP algorithm is applied and a distance-to-sampling rate is 50% of the diagram (b), and the diagram (d) shows an imaging result diagram in which a CS theory SP is applied and a distance-to-sampling rate is 50% of the diagram (b).