Alcoholic beverages industry in the U.S. - Statistics & Facts
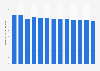
Beer, wine, and liquor store sales in the United States reached 72.29 billion U.S. dollars in 2024, reflecting steady retail demand across all three major categories. Total alcoholic drinks consumption volume stood at 31.81 billion liters and is forecast to contract to 31.59 billion liters by 2030, pointing to a gradual moderation in U.S. drinking habits.
Spirits overtake beer in market share as category revenue softens
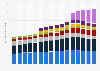
Spirits accounted for 42.4 percent of U.S. alcohol market share in 2025, edging ahead of beer at 41.8 percent — a marked reversal from their respective positions of 28.7 percent and 55.5 percent in 2000. Despite this structural shift, spirits supplier gross revenue declined to 36.41 billion U.S. dollars in 2025 from 37.65 billion U.S. dollars in 2022, indicating that pricing power alone is not compensating for volume losses.
Digital, craft, and no-alcohol formats capture incremental demand
Online alcoholic drinks revenue reached 23.49 billion U.S. dollars in 2024, up from 8.4 billion U.S. dollars in 2017, as e-commerce became a firmly established purchasing channel. Within beer, craft beer production volume held a 13.3 percent share of total U.S. beer output, flat for the second consecutive year. Athletic led all non-alcoholic beer brand sales in the United States in 2025, accumulating approximately 112 million U.S. dollars, pointing to sustained consumer appetite for low- and no-alcohol formats.
GLP-1 drug adoption adds a structural threat to volume growth
Per capita alcohol consumption in the United States reached 2.48 gallons of ethanol in 2023, a figure that projections suggest could fall sharply with wider adoption of GLP-1 medications. GLP-1 use among 25 percent of the obese and overweight U.S. population is projected to reduce alcohol demand by 14 percent by volume, adding a structural headwind to an industry already contending with a broader consumer moderation trend.