Matej Mikulic
Research expert covering health, pharma & medtech
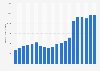
With 2025 total sales of 61.5 billion francs, Swiss company Roche operates at a scale that typically supports sustained investment capacity. Continued year-on-year sales expansion would usually translate into greater flexibility to fund late-stage development and lifecycle management while buffering competitive pressure and currency-driven volatility. The divisional split reinforces this resilience: in 2025, Pharmaceuticals generated about 48 billion Swiss francs in sales while Diagnostics contributed about 14 billion. A Pharma-led earnings engine with a meaningful second pillar tends to reduce dependence on any single demand pattern—even though Pharmaceuticals will remain the primary driver of valuation and sentiment.
Concentration is notable but still within a “franchise portfolio” profile. In 2025, Ocrevus, Hemlibra, and Vabysmo together represented exactly one third of total pharmaceutical sales, meaning strong execution from a few brands can carry near-term delivery, while any stumble would need to be offset by broader launches and indications. On mix, oncology remained the largest therapeutic area at 32% of pharma revenues in 2025. The continued decline in oncology share over recent years implies that incremental growth increasingly needs to come from other areas (e.g., hematology) to keep the portfolio balanced.
Roche’s innovation stance remains clearly the company's focus. R&D expenditure reached 13.4 billion Swiss francs in 2025, increasing versus the previous year, which supports the interpretation that Roche is prioritizing portfolio renewal over pure near-term margin optimization. Pipeline breadth underpins this: as of January 2026, Roche reported 40 NMEs and six additional indications in Phase I, and projects progressing toward registration—helpful cushioning when mature products face erosion, but also a reminder that clinical and regulatory cadence remains a key swing factor for outlook and investor confidence.
Roche’s outlook looks steady but execution-dependent: with growth returning at group level, investor focus is likely to stay on whether upcoming launches and label expansions can broaden the portfolio while competition rises in the largest therapy areas. Concentration remains manageable but worth monitoring. In 2025, Roche’s top three products (Ocrevus, Hemlibra, Vabysmo) accounted for exactly one third of total pharmaceutical sales—large enough that continued franchise momentum matters for delivery, but not so high that the equity story rests on a single asset.
Two Roche-specific overlays stand out. First, the company’s Pharmaceuticals business is U.S.-skewed, which increases sensitivity to U.S. access and pricing policy, including the Inflation Reduction Act’s Medicare drug price negotiation rollout. Second, on trade/tariffs, Roche’s risk is less about end-demand and more about operational friction (inputs, cross-border steps, compliance). Roche’s stated U.S. manufacturing investment plans can provide optionality to localise parts of the supply chain, although tariffs can still raise complexity and costs across multi-step pharma production networks.

Detailed statistics
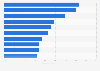
Major 50 pharmaceutical companies - Rx sales and R&D spending 2024

Detailed statistics
Roche Group's total sales 2006-2025

Detailed statistics
Largest M&A pharmaceutical deals ever as of 2024
Major 50 pharmaceutical companies - Rx sales and R&D spending 2024
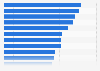
Leading 50 global pharmaceutical companies by prescription sales and R&D spending in 2024 (in billion U.S. dollars)

Leading 10 biotech and pharmaceutical companies based on market cap 2026
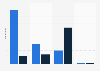
Leading 10 biotech and pharmaceutical companies worldwide as of February 2026, by market capitalization (in billion U.S. dollars)
Pharmaceutical companies — revenue from top 3 products 2024
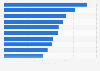
Revenue share from major pharmaceutical companies' top 3 products in 2024
Roche Group's total sales 2006-2025
Total sales of the Roche Group from 2006 to 2025 (in million Swiss francs)

Roche Group's number of employees 2007-2025
Number of Roche Group employees from 2007 to 2025

Roche Group's net income 2007-2025
Roche Group's net income from 2007 to 2025 (in million Swiss francs)

Operating profit of the Roche Group 2007-2025
Operating profit of the Roche Group from 2007 to 2025 (in million Swiss francs)

Free cash flow of the Roche Group 2015-2025
Free cash flow of the Roche Group from 2015 to 2025 (in billion Swiss francs)

Roche Holding total assets 2021-2025
Total assets of Roche Holding from 2021 to 2025 (in billion Swiss francs)

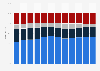
Roche Group's total sales by division 2013-2025
Total sales of the Roche Group from 2013 to 2025, by division (in million Swiss francs)
Distribution of Roche's Pharmaceuticals division revenues 2014-2025
Distribution of Roche's Pharmaceuticals division revenues from 2014 to 2025, by region

Revenue share of Roche's Pharmaceuticals division by therapy area 2013-2025
Revenue distribution of Roche's Pharmaceuticals division from 2013 to 2025, by therapeutic area

Roche's major pharmaceutical drugs 2022-2025, by revenue
Leading drugs of the pharmaceutical company Roche from 2022 to 2025, by revenue (in million Swiss francs)

Roche's three major pharmaceutical drugs 2021-2025, by sales share
Sales share of Roche Group's three major drugs from 2021 to 2025

Diagnostics sales of Roche by customer area 2023-2025
Diagnostics sales of Roche from 2023 to 2025, by customer area (in million Swiss francs)

Pfizer revenue 2006-2025
Revenue of Pfizer from 2006 to 2025 (in million U.S. dollars)

Novartis' revenue 2007-2025
Novartis AG's total revenue from 2007 to 2025 (in billion U.S. dollars)

Johnson & Johnson revenue 2005-2025
Revenue of Johnson & Johnson from 2005 to 2025 (in million U.S. dollars)
Bristol-Myers Squibb's revenue 2006-2025
Bristol-Myers Squibb's revenue from 2006 to 2025 (in million U.S. dollars)

AbbVie revenue 2010-2025
Revenue of AbbVie from 2010 to 2025 (in million U.S. dollars)

Total global pharmaceutical R&D spending 2016-2030
Total global spending on pharmaceutical research and development from 2016 to 2030 (in billion U.S. dollars)

Roche's expenditure on research and development 2011-2025
Roche's expenditure on research and development from 2011 to 2025 (in million Swiss francs)

Top pharma companies worldwide 2025, by size of R&D pipeline
Leading 15 pharmaceutical companies worldwide by size of R&D pipeline as of 2025
Top pharma companies worldwide by number of originated drugs 2025
Leading 15 pharmaceutical companies worldwide by number of originated drugs as of 2025

Alliances U.S. and Europe biotech companies by total potential value 2024
Select biotech alliances involving U.S. and/or European companies by total potential value in 2024 (in million U.S. dollars)
Development pipeline of Roche Group 2026, by phase
Development pipeline of the Roche Group as of January 2026, by phase
Sales forecast of major pharmaceutical companies worldwide 2030
Sales forecast of leading pharmaceutical companies worldwide in 2030 (in billion U.S. dollars)

Sales share at risk of pharmaceuticals due to patent expiries U.S. 2022
Sales share of leading pharmaceutical products at risk in the U.S. due to approaching drug patent expiries between 2022 and 2028

Forecasted sales of top hemophilia products worldwide 2026
Forecasted sales of leading hemophilia products worldwide in 2026 (in million U.S. dollars)

AI readiness of big pharma companies 2025
Index of AI readiness of select big pharma companies as of 2025
Feel free to contact us anytime. We will respond to your inquiry as quickly as possible.