
Matej Mikulic
Research expert covering health, pharma & medtech

Detailed statistics
Key economic figures on the pharmaceutical industry China 2017-2024

Detailed statistics
Market size of biopharmaceuticals in China 2013-20225
Detailed statistics
Number of COVID-19 vaccine doses produced in China 2021-2022

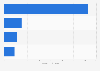
Global pharmaceutical market - revenue distribution 2010-2024, by region
Distribution of global pharmaceutical market revenue from 2010 to 2024, by region

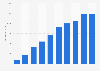
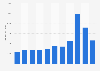
Total operating revenue of China's pharmaceutical industry 2013-2024
Total operating revenue of the pharmaceutical industry in China from 2013 to 2024 (in billion yuan)

Breakdown of pharmaceutical industry revenue in China 2021, by segment
Distribution of revenue in the pharmaceutical industry in China in 2021, by segment

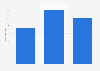
Breakdown of profit in the pharmaceutical industry in China 2021, by segment
Distribution of profit in the pharmaceutical industry in China in 2021, by segment

Monthly production volume of chemical API in China 2020-2025
Monthly production volume of chemical active pharmaceutical ingredient (API) in China from July 2020 to July 2025 (in 1,000 metric tons)

Monthly production volume of TCM patent drugs in China 2020-2025
Monthly production volume of traditional Chinese patent medicine in China from August 2020 to May 2025 (in 1,000 metric tons)
Value of investments in the pharmaceutical industry in China 2019-2021
Total value of investments in the pharmaceutical industry in China from 2019 to 2021 (in billion yuan)

Number of drug approval applications submitted in China 2018-2024
Number of applications for drug evaluations submitted in China from 2018 to 2024, by category

Number of approved drug evaluation applications in China 2021, by type of application
Number of drug evaluation applications granted approval in China in 2021, by type of application

Number of IND applications of innovative drugs approved in China 2018-2024
Number of Investigational New Drug (IND) applications for innovative drugs granted approval in China from 2018 to 2024, by drug type

Number of NDA of innovative drugs approved in China 2018-2024
Number of New Drug Applications (NDA) for innovative drugs granted approval in China from 2018 to 2024, by drug type

Number of chemical drug applications with technical reviews approved in China 2024
Number of approved registration applications for chemical drugs subjected to technical reviews in China in 2024, by type of application

Therapeutic areas for approved chemical drug IND applications in China 2024
Distribution of therapeutic areas for approved chemical drug Investigational New Drug (IND) applications in China in 2024
Therapeutic areas for approved chemical drug NDA in China 2024
Distribution of therapeutic areas for approved chemical drug New Drug Applications (NDA) in China in 2024

Number of technically reviewed biopharmaceutical applications approved in China 2024
Number of approved evaluation applications for biopharmaceuticals subjected to technical reviews in China in 2024, by type of application

Therapeutic areas for approved biopharmaceutical IND applications in China 2024
Distribution of therapeutic areas for approved biopharmaceutical Investigational New Drug (IND) applications in China in 2024

Therapeutic areas for approved biopharmaceutical NDA in China 2024
Distribution of therapeutic areas for approved biopharmaceutical New Drug Applications (NDA) in China in 2024

Number of TCM applications with technical reviews approved in China 2024
Number of approved registration applications for traditional Chinese medicine (TCM) subjected to technical reviews in China in 2024, by type of application
Application number of foreign innovative drug types submitted in China 2016-2022
Application number of foreign innovative drug types submitted in China from 2016 to 2022

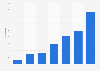
End market sales value of pharmaceutical industry in China 2012-2024
End market sales value of pharmaceutical industry in China from 2012 to 2023, with estimate of 2024 (in billion yuan)

Drug sales revenue distribution in China 2024, by sales channel
Distribution of drug sales revenue in China in 2024, by sales channel

Sales revenue of medicaments via public hospitals in China 2011-2024
Sales revenue of medicine through public hospitals as end sales channel in China from 2011 to 2023, with estimate of 2024 (in billion yuan)

Sales revenue of medicaments via retail pharmacies in China 2011-2024
Sales revenue of medicine through online and physical retail pharmacies as end sales channel in China from 2011 to 2023, with estimate of 2024 (in billion yuan)

Sales revenue of medicaments via physical retail pharmacies in China 2011-2024
Sales revenue of medicine through physical retail pharmacies as end sales channel in China from 2011 to 2023, with estimate of 2024 (in billion yuan)

Sales revenue of medicaments via online retail pharmacies in China 2011-2024
Sales revenue of medicine through online retail pharmacies as end sales channel in China from 2011 to 2023, with estimate of 2024 (in billion yuan)
Export value of medicinal and pharmaceutical products from China 2013-2023
Export value of medicinal and pharmaceutical products from China between 2013 and 2023 (in million U.S. dollars)
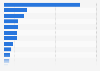
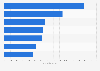
Leading biotech and pharmaceutical companies on the Fortune China 500 ranking 2024
Leading Chinese biotech and pharmaceutical companies on the Fortune China 500 ranking in 2024, by revenue (in billion U.S. dollars)
Largest Chinese pharmaceutical companies 2025, by profit
Largest Chinese pharmaceutical companies as compiled by the Forbes Global 2000 ranking as of June 2025, by profit (in million U.S. dollars)

Largest Chinese pharmaceutical companies 2025, based on market value
Largest Chinese pharmaceutical companies as compiled by the Forbes Global 2000 ranking as of June 2025, based on market value (in billion U.S. dollars)*

Annual revenue of Shanghai Pharmaceuticals 2011-2024
Annual revenue of Shanghai Pharmaceutical Group (SPGC) from 2011 to 2024 (in billion yuan)

Annual revenue of Sinopharm 2010-2024
Annual revenue of Sinopharm Group Co., Ltd. from 2010 to 2024 (in billion yuan)

Annual revenue of Jiangsu Hengrui Pharmaceuticals 2015-2024
Annual revenue of Jiangsu Hengrui Pharmaceuticals Co., Ltd. from 2015 to 2024 (in billion yuan)

Annual revenue of Sinovac Biotech Ltd. 2016-2023
Annual revenue of Sinovac Biotech Ltd. between 2016 and 2023 (in million U.S. dollars)
Feel free to contact us anytime. We will respond to your inquiry as quickly as possible.


