
Manya Rathore
Research expert covering India

Detailed statistics
Premature deaths related to air pollution in the European Union 2022, by pollutant

Detailed statistics
Most polluted capital cities based on PM2.5 concentration in Europe 2024

Detailed statistics
Industrial air pollution costs in the European Union 2012-2021

Global annual deaths due to PM2.5 and ozone air pollution
Annual attributable deaths as a result of long term exposure to fine particulate matter (PM2.5) and ozone air pollution worldwide (in millions)

EU-27 urban population exposed to air pollution concentrations above standards 2022
Share of the urban population of the European Union exposed to air pollution levels above EU standards and WHO guidelines in 2022, by pollutant
Most polluted capital cities based on PM2.5 concentration in Europe 2024
Average fine particulate matter (PM2.5) concentrations in capital cities in Europe in 2024 (in micrograms per cubic meter of air)
Premature deaths related to air pollution in the European Union 2022, by pollutant
Number of premature deaths attributable to short-term exposure to air pollution in the European Union (EU-27) in 2022, by pollutant
Industrial air pollution costs in the European Union 2012-2021
Economic costs of air pollution from the largest industrial plants in the European Union (EU-27) from 2012 to 2021 (in billion euros)
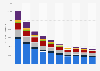
Air pollutant emissions in the European Union (EU-27) 1990-2023, by pollutant
Total emissions of selected air pollutants in the European Union (EU-27) from 1990 to 2023 (in 1,000 metric tons)

Air pollutant emission change in the EU-27 1990-2022, by pollutant
Percent change in air pollutant emissions in the European Union (EU-27) from 1990 to 2022

Black carbon emissions in the European Union (EU-27) 2000-2022
Black carbon emissions in the European Union (EU-27) from 2000 to 2022 (in 1,000 metric tons)

PM2.5 emissions in the European Union (EU-27) 2000-2022, by member state
PM2.5 emissions in the European Union (EU-27) in 2000 and 2022, by member state (in 1,000 metric tons)

PM10 emissions in the European Union (EU-27) 2000-2022, by member state
PM10 emissions in the European Union (EU-27) in 2000 and 2022, by member state (in gigagrams)

Breakdown of air pollutant emissions in the EU-27 2022, by sector
Distribution of selected air pollutant emissions in the European Union (EU-27) 2022, by sector

PM2.5 particle emissions in the European Union 2000-2022, by sector
Total particulate matter emissions (PM2.5) in the European Union (EU-27) from 2000 to 2022, by sector (in 1,000 metric tons)

Nitrogen oxide emissions in the European Union 1990-2022, by sector
Total nitrogen oxide (NOx) emissions in the European Union (EU-27) from 1990 to 2022, by sector (in 1,000 metric tons)

Change in transport sector air pollutant emissions in the EU-27 1990-2022, by mode
Variations in air pollution from transportation modes in the European Union (EU-27) from 1990 to 2022, by pollutant type

External costs of industrial air pollution in the European Union 2012-2021, by sector
Economic costs of air pollution from the largest industrial plants in the European Union (EU-27) from 2012 to 2021, by sector (in million euros)

Percentage of urban population exposed to air pollutants in the EU-27 2000-2021
Share of urban population exposed to pollutant concentrations above EU air quality standards in the European Union from 2000 to 2021, by pollutant type

Share of population facing air pollution above WHO limits in Europe 2022, by country
Share of European population that lives in areas where fine particle (PM2.5) concentrations are above WHO recommended limits in 2022, by country

Annual average number of PM2.5 unclean air days in Europe 2003-2019, by country
Annual average number of days when average levels of fine particulate matter (PM2.5) exceeded World Health Organization maximum daily limits in Europe 2003-2019, by country

Most polluted cities based on PM2.5 concentration in Europe 2024
Average PM2.5 concentration in the most polluted cities in Europe in 2024 (in micrograms per cubic meter of air)

Average PM2.5 levels in the most populated cities in Europe 2021-2022
Average concentration of fine particles (PM2.5) in the most populated cities in Europe from 2021 to 2022 (in micrograms per cubic meter of air)

Average PM2.5 concentrations in the least polluted cities in Europe 2021-2022
Average concentration of fine particles (PM2.5) in the least polluted cities in Europe from 2021 to 2022 (in micrograms per cubic meter of air)

Annual deaths attributable to PM2.5 exposure in the European Union 2005-2021
Number of premature deaths attributable to fine particulate matter (PM2.5) exposure in the European Union from 2005 to 2021

Premature deaths attributable to PM2.5 exposure in Europe 2022, by cause
Mortality due to exposure to fine particulate matter (PM2.5) in Europe in 2022, by cause

Deaths attributable to PM2.5 exposure in Europe 2022, by country
Number of premature deaths attributable to fine particulate matter (PM2.5) exposure in Europe in 2022, by country

Deaths attributable to nitrogen dioxide exposure in Europe 2022, by country
Number of premature deaths attributable to nitrogen dioxide (NO₂) exposure in Europe in 2022, by country

Deaths per 100,000 inhabitants due to PM2.5 pollution in Europe 2005-2022, by country
Number of premature deaths attributable to fine particulate matter (PM2.5) exposure in Europe in 2005 and 2022, by country (per 100,000 inhabitants)
Feel free to contact us anytime. We will respond to your inquiry as quickly as possible.


