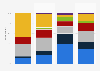
In 2024, Germans aged 10 to 19 went to the cinema an average of *** times. The same figure was reported for the age groups 20 to 29 and 30 to 39. Among those aged 60 and over, cinema attendance showed the highest increase compared to the year before.
Profit from the additional features of your individual account
Currently, you are using a shared account. To use individual functions (e.g., mark statistics as favourites, set
statistic alerts) please log in with your personal account.
If you are an admin, please authenticate by logging in again.
Learn more about how Statista can support your business.
FFA. (May 14, 2025). Average number of visits to the cinema per year in Germany from 2001 to 2024, by age group [Graph]. In Statista. Retrieved May 09, 2026, from https://www.statista.com/statistics/387845/cinema-visits-per-year-by-age-group-germany/
FFA. "Average number of visits to the cinema per year in Germany from 2001 to 2024, by age group." Chart. May 14, 2025. Statista. Accessed May 09, 2026. https://www.statista.com/statistics/387845/cinema-visits-per-year-by-age-group-germany/
FFA. (2025). Average number of visits to the cinema per year in Germany from 2001 to 2024, by age group. Statista. Statista Inc.. Accessed: May 09, 2026. https://www.statista.com/statistics/387845/cinema-visits-per-year-by-age-group-germany/
FFA. "Average Number of Visits to The Cinema per Year in Germany from 2001 to 2024, by Age Group." Statista, Statista Inc., 14 May 2025, https://www.statista.com/statistics/387845/cinema-visits-per-year-by-age-group-germany/
FFA, Average number of visits to the cinema per year in Germany from 2001 to 2024, by age group Statista, https://www.statista.com/statistics/387845/cinema-visits-per-year-by-age-group-germany/ (last visited May 09, 2026)
Average number of visits to the cinema per year in Germany from 2001 to 2024, by age group [Graph], FFA, May 14, 2025. [Online]. Available: https://www.statista.com/statistics/387845/cinema-visits-per-year-by-age-group-germany/