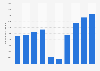
| Characteristic | Percentage change in transactions compared to the same month in 2019 |
|---|---|
| - | - |
| - | - |
| - | - |
| - | - |
| - | - |
| - | - |
| - | - |
| - | - |
| - | - |
| - | - |
| - | - |
| - | - |
| - | - |
| - | - |
| - | - |
| - | - |
| - | - |
| - | - |
| - | - |
| - | - |
| - | - |
| - | - |
| - | - |
| - | - |
| - | - |
| - | - |
| - | - |
| - | - |
| - | - |
| - | - |
| - | - |
| - | - |
| - | - |
| - | - |
| - | - |
| - | - |
| - | - |
| - | - |
| - | - |
| - | - |
| - | - |
| - | - |
| - | - |
| - | - |
| - | - |
| - | - |
| - | - |
| - | - |
| - | - |
| - | - |
| - | - |
The chart is not accessible to screen readers. Please switch to the table view to access the data.
Download
Source
Release date
May 2024
More information
Region
Worldwide
Survey time period
January 2020 to March 2024
Supplementary notes
Figures refer to the number of transactions made by consumers on cruises (while on-board and for booking).
Citation formats