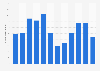
| Characteristic | Number of visitors in thousands |
|---|---|
| - | - |
| - | - |
| - | - |
| - | - |
| - | - |
| - | - |
| - | - |
The chart is not accessible to screen readers. Please switch to the table view to access the data.
Download
Source
Release date
July 2020
More information
Region
Brazil
Survey time period
2013 to 2019
Supplementary notes
Figures preceding 2018 come from earlier reports.
Figures have been rounded.
Citation formats