Figure 2 – uploaded by Arturo Harker Roa

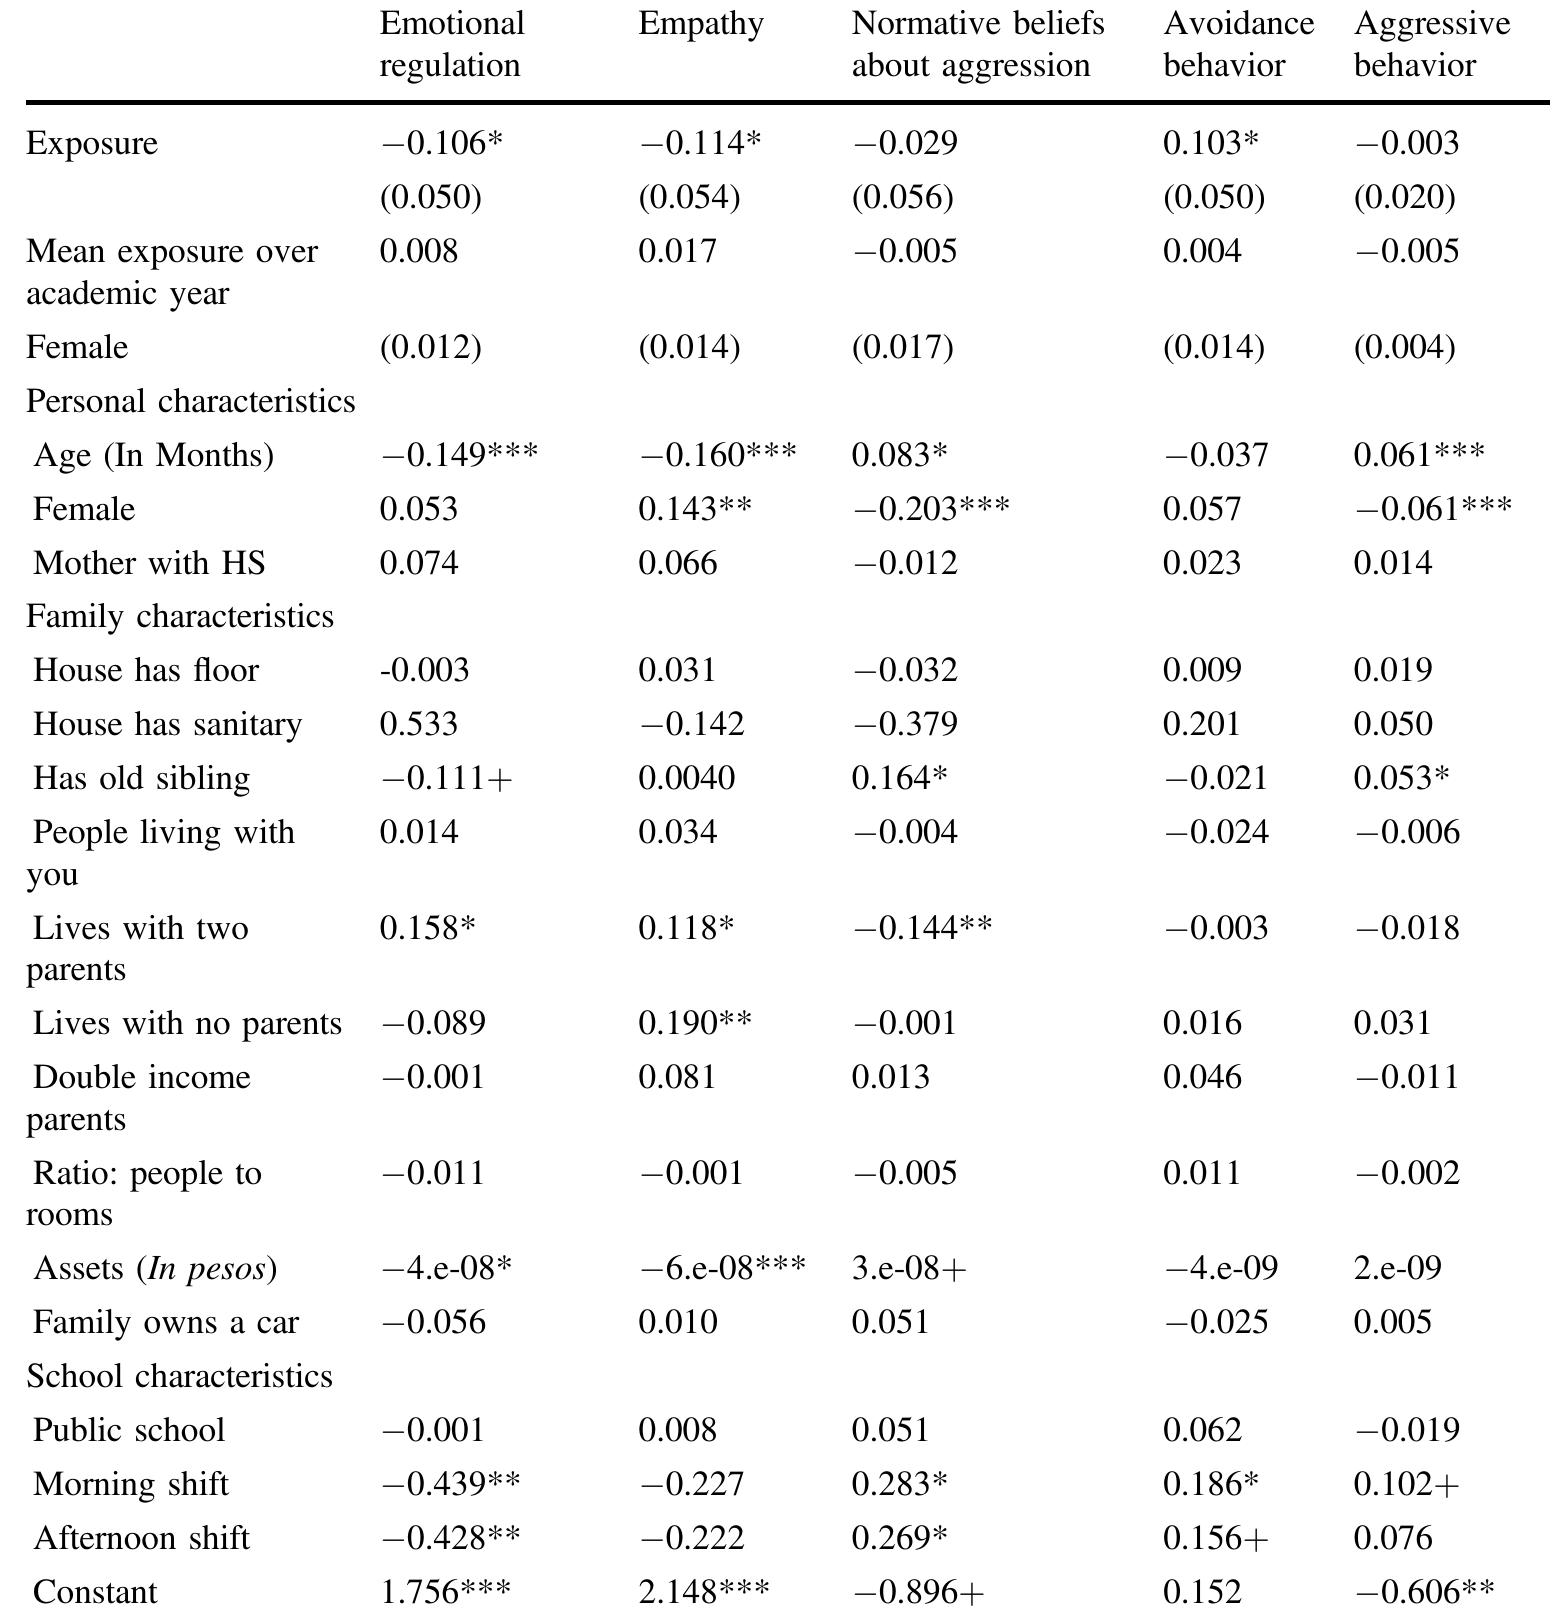
Figure 2 Observed patterns of change in geographical sensitivity find- ings. Each line represents the estimated effect of Exposure for one of the our main outcomes according to different geographical radiuses around school grounds (from 250 to 700, on a 50-m interval) These endogenous differences became more salient when considering the results in the context of a taxonomy of estimations where different controls are added sequentially to the model (See tables S2 to S6, available in the appen- dix). While the sequential addition of groups of controls


