CN110033484B - High canopy density forest sample plot tree height extraction method combining UAV image and TLS point cloud - Google Patents
High canopy density forest sample plot tree height extraction method combining UAV image and TLS point cloud Download PDFInfo
- Publication number
- CN110033484B CN110033484B CN201910321231.5A CN201910321231A CN110033484B CN 110033484 B CN110033484 B CN 110033484B CN 201910321231 A CN201910321231 A CN 201910321231A CN 110033484 B CN110033484 B CN 110033484B
- Authority
- CN
- China
- Prior art keywords
- point
- point cloud
- key
- image
- points
- Prior art date
- Legal status (The legal status is an assumption and is not a legal conclusion. Google has not performed a legal analysis and makes no representation as to the accuracy of the status listed.)
- Expired - Fee Related
Links
Images


Classifications
-
- G—PHYSICS
- G06—COMPUTING OR CALCULATING; COUNTING
- G06F—ELECTRIC DIGITAL DATA PROCESSING
- G06F18/00—Pattern recognition
- G06F18/20—Analysing
- G06F18/22—Matching criteria, e.g. proximity measures
-
- G—PHYSICS
- G06—COMPUTING OR CALCULATING; COUNTING
- G06F—ELECTRIC DIGITAL DATA PROCESSING
- G06F18/00—Pattern recognition
- G06F18/20—Analysing
- G06F18/25—Fusion techniques
- G06F18/251—Fusion techniques of input or preprocessed data
-
- G—PHYSICS
- G06—COMPUTING OR CALCULATING; COUNTING
- G06T—IMAGE DATA PROCESSING OR GENERATION, IN GENERAL
- G06T7/00—Image analysis
- G06T7/60—Analysis of geometric attributes
-
- G—PHYSICS
- G06—COMPUTING OR CALCULATING; COUNTING
- G06T—IMAGE DATA PROCESSING OR GENERATION, IN GENERAL
- G06T7/00—Image analysis
- G06T7/60—Analysis of geometric attributes
- G06T7/64—Analysis of geometric attributes of convexity or concavity
-
- G—PHYSICS
- G06—COMPUTING OR CALCULATING; COUNTING
- G06V—IMAGE OR VIDEO RECOGNITION OR UNDERSTANDING
- G06V10/00—Arrangements for image or video recognition or understanding
- G06V10/40—Extraction of image or video features
- G06V10/46—Descriptors for shape, contour or point-related descriptors, e.g. scale invariant feature transform [SIFT] or bags of words [BoW]; Salient regional features
- G06V10/462—Salient features, e.g. scale invariant feature transforms [SIFT]
-
- G—PHYSICS
- G06—COMPUTING OR CALCULATING; COUNTING
- G06T—IMAGE DATA PROCESSING OR GENERATION, IN GENERAL
- G06T2207/00—Indexing scheme for image analysis or image enhancement
- G06T2207/10—Image acquisition modality
- G06T2207/10028—Range image; Depth image; 3D point clouds
-
- G—PHYSICS
- G06—COMPUTING OR CALCULATING; COUNTING
- G06T—IMAGE DATA PROCESSING OR GENERATION, IN GENERAL
- G06T2207/00—Indexing scheme for image analysis or image enhancement
- G06T2207/10—Image acquisition modality
- G06T2207/10032—Satellite or aerial image; Remote sensing
- G06T2207/10044—Radar image
-
- G—PHYSICS
- G06—COMPUTING OR CALCULATING; COUNTING
- G06T—IMAGE DATA PROCESSING OR GENERATION, IN GENERAL
- G06T2207/00—Indexing scheme for image analysis or image enhancement
- G06T2207/20—Special algorithmic details
- G06T2207/20212—Image combination
- G06T2207/20221—Image fusion; Image merging
-
- G—PHYSICS
- G06—COMPUTING OR CALCULATING; COUNTING
- G06T—IMAGE DATA PROCESSING OR GENERATION, IN GENERAL
- G06T2207/00—Indexing scheme for image analysis or image enhancement
- G06T2207/30—Subject of image; Context of image processing
- G06T2207/30181—Earth observation
- G06T2207/30188—Vegetation; Agriculture
Landscapes
- Engineering & Computer Science (AREA)
- Theoretical Computer Science (AREA)
- Physics & Mathematics (AREA)
- Computer Vision & Pattern Recognition (AREA)
- General Physics & Mathematics (AREA)
- Data Mining & Analysis (AREA)
- Bioinformatics & Cheminformatics (AREA)
- Evolutionary Biology (AREA)
- Evolutionary Computation (AREA)
- Bioinformatics & Computational Biology (AREA)
- General Engineering & Computer Science (AREA)
- Artificial Intelligence (AREA)
- Life Sciences & Earth Sciences (AREA)
- Geometry (AREA)
- Multimedia (AREA)
- Image Analysis (AREA)
Abstract
Description
技术领域technical field
本发明涉及森林树高研究技术领域,特别是一种结合UAV影像和TLS点云的高郁闭森林样地树高提取方法。The invention relates to the technical field of forest tree height research, in particular to a tree height extraction method of a high canopy closed forest sample plot combining UAV images and TLS point clouds.
背景技术Background technique
森林是陆地上面积分布最广、组成结构最复杂且物质资源最丰富的生态系统,能够及时清晰的了解森林信息变化情况,高效地进行森林资源管理是非常重要的,所以国内外开展了大量的森林资源调查的工作。树高是森林结构的重要参数,是估算森林蓄积量等其它参数的基础。Forest is the ecosystem with the widest distribution, the most complex structure and the richest material resources on land. It is very important to be able to understand the changes of forest information in a timely manner and to manage forest resources efficiently. The work of forest resources survey. Tree height is an important parameter of forest structure and the basis for estimating other parameters such as forest stock.
在普通的森林区域,TLS可以提供精细的森林直立面结构数据并可精确估算树高等参数。随着航空遥感技术的发展,低成本无人机(Unmanned Aerial Vehicle: UAV)由于其灵活和机动性,其配备的传感器可以实时获取高空间、时间分辨率的像片数据,通过运动结构多视图立体摄影(SfM-MVS)的技术方法可将获取的具有一定重叠度的序列像片数据生成三维点云数据(Ullman,1979;Lowe,2004; Dandois,2013)。从三维立体视角观察整个森林的概况,通过获取精细的地面点数据,为树高等参数的估算提供前提条件(Kattenborn等,2014)。In common forest areas, TLS can provide detailed forest upright structure data and can accurately estimate tree height parameters. With the development of aerial remote sensing technology, low-cost unmanned aerial vehicle (Unmanned Aerial Vehicle: UAV), due to its flexibility and mobility, is equipped with sensors that can acquire high spatial and temporal resolution image data in real time. The technical method of stereo photography (SfM-MVS) can generate three-dimensional point cloud data from acquired sequence photo data with a certain degree of overlap (Ullman, 1979; Lowe, 2004; Dandois, 2013). The overview of the entire forest is observed from a three-dimensional perspective, and by obtaining fine ground point data, it provides preconditions for the estimation of tree height parameters (Kattenborn et al., 2014).
然而在高郁闭度的森林区域,UAV影像点云无法穿透冠层到达地面,对于无法获取地面点的区域,其树高等参数的估算受到限制。而在同一区域进行TLS点云数据获取时,由于复杂的森林结构或扫描仪自身条件限制等原因,其区域内树木信息不能被完整扫描,部分单木冠层信息会严重缺失。Jung(2016)将在不同角度方向存在数据缺失的TLS点云和ALS点云进行结合,提高了森林单木树高、冠幅等参数的估算精度。但是ALS点云获取成本较高,且实时性较差。However, in the forest area with high canopy closure, the UAV image point cloud cannot penetrate the canopy to reach the ground, and the estimation of the tree height parameter is limited for the area where the ground point cannot be obtained. However, when acquiring TLS point cloud data in the same area, due to the complex forest structure or the limitations of the scanner's own conditions, the tree information in the area cannot be completely scanned, and some single tree canopy information will be seriously missing. Jung (2016) combined the TLS point cloud and ALS point cloud with missing data in different angles and directions, which improved the estimation accuracy of parameters such as tree height and crown width in the forest. However, the acquisition cost of ALS point cloud is high and the real-time performance is poor.
发明内容SUMMARY OF THE INVENTION
有鉴于此,本发明的目的是提出一种结合UAV影像和TLS点云的高郁闭森林样地树高提取方法,可实现同时从林下和冠层两个方向来测量森林样地参数,为更全面、更精确的估算亚热带高郁闭度森林样地的树高提供了一种新的途径。In view of this, the purpose of the present invention is to propose a tree height extraction method of high canopy closed forest plot combining UAV image and TLS point cloud, which can measure the parameters of the forest plot from the understory and the canopy at the same time, It provides a new way for more comprehensive and accurate estimation of tree height in subtropical high canopy closure forest plots.
本发明采用以下方案实现:一种结合UAV影像和TLS点云的高郁闭森林样地树高提取方法,具体包括以下步骤:The present invention adopts the following scheme to realize: a kind of tree height extraction method of high canopy closed forest sample plot combining UAV image and TLS point cloud, specifically comprises the following steps:
步骤S1:同时获取高郁闭度森林样地无人机(UAV)影像点云与该样地的地面激光雷达(TLS)点云数据并生成数字表面模型(DSM);Step S1: Simultaneously obtain the point cloud of the unmanned aerial vehicle (UAV) image of the forest plot with high canopy closure and the point cloud data of the ground lidar (TLS) of the plot, and generate a digital surface model (DSM);
步骤S2:估算高郁闭度森林样地无人机(UAV)影像点云与该样地的地面激光雷达(TLS)点云数据的数字表面模型DSM上所有点的曲率,存储DSM所有点云尺度不变的局部邻近点,将曲率值高于其邻近点曲率值的点作为关键点;Step S2: Estimate the curvature of all points on the digital surface model DSM of the high-canopy forest plot unmanned aerial vehicle (UAV) image point cloud and the ground Lidar (TLS) point cloud data of the plot, and store all the point clouds of the DSM For scale-invariant local neighboring points, the points whose curvature value is higher than that of their neighboring points are regarded as key points;
步骤S3:建立关键点描述符区域,生成无人机影像点云和地面激光雷达样地点云的DSM描述符SIFT;Step S3: establish a key point descriptor area, and generate the DSM descriptor SIFT of the UAV image point cloud and the ground lidar sample point cloud;
步骤S4:匹配最相似的关键点描述符,进行关键点坐标转换,实现无人机影像点云和地面激光雷达样地点云数据匹配融合;Step S4: Match the most similar key point descriptors, perform key point coordinate transformation, and realize the matching and fusion of the UAV image point cloud and the ground lidar sample point cloud data;
步骤S5:基于无人机影像点云和地面激光雷达样地点云的融合数据,进行样地地面点分割,建立样地冠层高度模型CHM;Step S5: based on the fusion data of the UAV image point cloud and the ground lidar sample point cloud, the ground points of the sample plot are segmented, and the CHM model of the canopy height of the sample plot is established;
步骤S6:基于冠层高度模型CHM,采用改进的局部最大值算法提取样地的单木树高。Step S6: Based on the canopy height model CHM, the tree height of a single tree in the plot is extracted by using the improved local maximum algorithm.
本发明结合无人机影像和地面激光雷达点云的森林样地树高提取方法:同时获取高郁闭度森林样地无人机(UAV:Unmanned aerial vehicle)影像点云与该样地的地面激光雷达(TLS:Terrestrial Laser Scanning)点云数据。通过尺度不变特征变换(SIFT)特征点匹配算法实现两种数据匹配融合。基于融合的点云数据,采用改进的局部极大值算法提取样地的单木树高。本发明可实现同时从林下和冠层两个方向来测量森林样地参数,为更全面、更精确的估算亚热带高郁闭度森林样地的树高提供了一种新的途径。The invention combines the UAV image and the ground laser radar point cloud to extract the tree height of the forest sample plot: simultaneously obtains the image point cloud of the unmanned aerial vehicle (UAV: Unmanned aerial vehicle) image of the high canopy closure forest sample plot and the ground of the sample plot. Lidar (TLS: Terrestrial Laser Scanning) point cloud data. The two kinds of data matching and fusion are realized through the scale-invariant feature transform (SIFT) feature point matching algorithm. Based on the fused point cloud data, an improved local maxima algorithm was used to extract the height of a single tree in the plot. The invention can measure the parameters of the forest plot from the under-forest and canopy directions at the same time, and provides a new way for more comprehensive and accurate estimation of the tree height of the subtropical high canopy closure forest plot.
进一步地,步骤S1中,设置森林样地的郁闭度值大于0.7;进行无人机影像数据采集时,影像航向和旁向重叠度分别设置为大于等于30%和大于等于70%,影像分辨率为设置为小于等于3cm;对得到的UAV像对,利用运动结构多视图立体摄影(SfM-MVS)技术和算法生成三维点云数据。Further, in step S1, the canopy closure value of the forest plot is set to be greater than 0.7; when collecting UAV image data, the image heading and side overlap are set to be greater than or equal to 30% and greater than or equal to 70%, respectively, and the image resolution is greater than or equal to 70%. The rate is set to be less than or equal to 3cm; for the obtained UAV image pairs, three-dimensional point cloud data is generated by using the Motion Structure Multi-View Stereo Photography (SfM-MVS) technology and algorithm.
进一步地,步骤S2具体包括以下步骤:Further, step S2 specifically includes the following steps:
步骤S21:估算两种点云数据的数字表面模型DSM上所有点的表面曲率,利用协方差的特征分析有3个特征向量eμ和其对应的特征值λμ;其中eμ定义一个局部三维正交参考坐标系,而λμ定义每个eμ的大小;根据每点的特征值λ0、λ1、λ2,将局部DSM表面量化为一个近似曲面的曲率,计算公式如下:Step S21: estimating the surface curvature of all points on the digital surface model DSM of two kinds of point cloud data, using the feature analysis of covariance to have 3 eigenvectors e μ and its corresponding eigenvalue λ μ ; wherein e μ defines a local three-dimensional Orthogonal reference coordinate system, and λ μ defines the size of each e μ ; according to the eigenvalues λ 0 , λ 1 , λ 2 of each point, the local DSM surface is quantified into an approximate curvature of the surface, and the calculation formula is as follows:


式中,λ0表示候选关键点的表面法线,即是在三维表面上局部切平面的最小变化方向;In the formula, λ 0 represents the surface normal of the candidate key point, that is, the minimum change direction of the local tangent plane on the three-dimensional surface;
步骤S22:步骤S21中各个点的邻近点云半径范围是不确定的,在0-1之间的归一化点云坐标系统中,半径尺度范围是0.1-0.5,增量是0.05,将最大曲率值作为关键点邻近点云的半径值;如果候选点的曲率值大于其相邻点云范围内所有点的曲率值,那么将该候选点作为一个关键点。Step S22: The radius range of the adjacent point cloud of each point in step S21 is uncertain. In the normalized point cloud coordinate system between 0 and 1, the radius scale range is 0.1-0.5, and the increment is 0.05. The curvature value is used as the radius value of the adjacent point cloud of the key point; if the curvature value of the candidate point is greater than the curvature value of all points in the range of its adjacent point cloud, the candidate point is regarded as a key point.
进一步地,步骤S3具体包括以下步骤:Further, step S3 specifically includes the following steps:
步骤S31:计算每个关键点的方向,依照这个方向再做进一步的计算;利用关键点邻域像素的梯度方向分布特性为每个关键点指定方向参数,使算子具备旋转不变性;其中,点(x,y)处梯度的模值和方向计算公式分别如下:Step S31: Calculate the direction of each key point, and perform further calculations according to this direction; specify a direction parameter for each key point by using the gradient direction distribution characteristics of the pixels in the neighborhood of the key point, so that the operator has rotation invariance; wherein, The calculation formulas of the modulus value and direction of the gradient at the point (x, y) are as follows:


式中,L所用的尺度为每个关键点各自所在的尺度;In the formula, the scale used by L is the scale of each key point;
步骤S32:每个关键点有三个信息:位置、所处尺度以及方向,以关键点为中心,确定一个SIFT特征区域;Step S32: each key point has three pieces of information: position, scale and direction, and a SIFT feature area is determined with the key point as the center;
步骤S33:在关键点邻域内,对其中点的梯度做高斯加权;其中邻域分为4×4 个子区域,每个子区域生成一个描述子,一个描述子中涉及8个方向,最终每个关键点形成128维的SIFT特征向量。Step S33: In the neighborhood of the key point, apply Gaussian weighting to the gradient of its point; the neighborhood is divided into 4×4 sub-regions, each sub-region generates a descriptor, and one descriptor involves 8 directions, and finally each key The points form a 128-dimensional SIFT feature vector.
进一步地,步骤S4具体包括以下步骤:Further, step S4 specifically includes the following steps:
步骤S41:采用关键点特征向量的欧式距离作为两幅图像中关键点的相似性判定度量,两个样地的数据分别生成相应的描述子,将两图中所有尺度的描述子进行分配,在描述符特征空间中,利用关键点与其第一和第二最邻近点的欧氏距离来匹配每个关键点;Step S41: using the Euclidean distance of the feature vector of the key points as the similarity judgment measure of the key points in the two images, the data of the two sample plots respectively generate corresponding descriptors, and assign the descriptors of all scales in the two images, In the descriptor feature space, use the Euclidean distance of the keypoint to its first and second closest neighbors to match each keypoint;
步骤S42:在描述符空间使用最邻近点特征匹配时,如果两个图像关键点之间的相对距离dist1小于用户设置的阈值,即在边界内搜索不到另一幅图像的最邻近关键点,则关键点的描述符D1不能与另外一幅图像关键点描述符Dtrue匹配;如果边界内只有一个可匹配的点,该点即可作为最佳匹配的点;Step S42: When the descriptor space uses the nearest neighbor point feature matching, if the relative distance dist 1 between the two image key points is less than the threshold set by the user, that is, the nearest neighbor key point of another image cannot be searched within the boundary. , the descriptor D 1 of the key point cannot match the key point descriptor D true of another image; if there is only one matching point within the boundary, this point can be used as the best matching point;
步骤S43:在描述符空间使用最邻近点特征匹配时,如果在一定的边界范围内,


步骤S44:在描述符空间使用最邻近点特征匹配时,如果在一定的边界范围内,


步骤S45:在确认匹配点以后,使用RANSAC方法剔除错误匹配的点;Step S45: after confirming the matching points, use the RANSAC method to eliminate the wrongly matched points;
步骤S46:估算无人机影像点云和地面激光雷达样地点云表面对应关键点的尺度因子、旋转角和平移位移,进行两种数据的坐标转换。Step S46: Estimate the scale factor, rotation angle and translation displacement of the corresponding key points on the surface of the drone image point cloud and the ground lidar sample point cloud, and perform coordinate conversion of the two kinds of data.
进一步地,步骤S44中,所述用户定义的值τ取0.3。Further, in step S44, the user-defined value τ takes 0.3.
进一步地,步骤S5具体包括以下步骤:Further, step S5 specifically includes the following steps:
步骤S51:利用无人机影像点云和地面激光雷达点云的融合数据生成的DSM,与样地的数字高程模型DEM做差值运算获得冠层高度模型CHM;Step S51: using the DSM generated by the fusion data of the drone image point cloud and the ground lidar point cloud, and the digital elevation model DEM of the sample plot to perform a difference calculation to obtain the canopy height model CHM;
步骤S52:基于融合数据的树冠高度模型CHM,将获取的初始样地单木树顶点结果作为候选树顶点;Step S52: Based on the canopy height model CHM of the fusion data, the obtained initial sample plot single-tree tree vertex result is used as the candidate tree vertex;
步骤S53:采用自适应的动态窗口对获取的树顶点进行判断,若当前顶点为对应窗口区域的最大值则保存,否则删除。Step S53: Use an adaptive dynamic window to judge the acquired tree vertices, if the current vertex is the maximum value of the corresponding window area, save it, otherwise delete it.
进一步地,步骤S52中,所述动态窗口的大小通过计算潜在顶点八个剖面方向半方差值的变化值来自适应的确定,其公式计算如下:Further, in step S52, the size of the dynamic window is adaptively determined by calculating the change values of the semi-variance values of the eight cross-section directions of the potential vertices, and the formula is calculated as follows:

式中,γ(h)为经验半方差值,xi为影像的像元位置,h为两个像元的空间分割距离,Z(xi)为对应影像xi处的像元值,N为在一定分隔距离下像元对的对数。In the formula, γ(h) is the empirical semivariance value, x i is the pixel position of the image, h is the spatial division distance between two pixels, Z( xi ) is the pixel value at the corresponding image x i , N is the logarithm of cell pairs at a certain separation distance.
与现有技术相比,本发明有以下有益效果:本发明有效解决了单一数据在高郁闭度森林样地参数提取的弊端,可实现同时从林下和冠层两个方向来测量森林样地参数,为更全面、更精确的估算亚热带高郁闭度森林样地的树高提供了一种新的途径。Compared with the prior art, the present invention has the following beneficial effects: the present invention effectively solves the drawbacks of single data extraction in high canopy closure forest sample plots, and can simultaneously measure forest samples from two directions of understory and canopy. It provides a new way for more comprehensive and accurate estimation of tree height in subtropical high canopy density forest plots.
附图说明Description of drawings
图1为本发明实施例的方法流程示意图。FIG. 1 is a schematic flowchart of a method according to an embodiment of the present invention.
图2为本发明实施例的研究样地,编号为0310。FIG. 2 is the research plot of the embodiment of the present invention, numbered 0310.
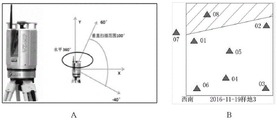
图3为本发明实施例的激光扫描仪及其在样地中的位置图。其中A为RIEGL VZ-400地面激光扫描仪及其扫描视场的示意图,B为各扫描站扫描仪在样地中的位置分布图。FIG. 3 is a diagram of a laser scanner and its position in the sample plot according to an embodiment of the present invention. Among them, A is the schematic diagram of the RIEGL VZ-400 ground laser scanner and its scanning field of view, and B is the position distribution map of the scanners of each scanning station in the sample plot.
图4为本发明实施例的点云数据。其中A为地面激光雷达(TLS)点云数据,B为无人机(UAV)影像点云数据。FIG. 4 is point cloud data according to an embodiment of the present invention. Among them, A is the ground-based lidar (TLS) point cloud data, and B is the unmanned aerial vehicle (UAV) image point cloud data.
图5为本发明实施例的编号0310样地TLS点云、UAV影像点云生成的数字地面模型(DSM)、两种数据检测到的匹配点对示意图。其中(a)为编号0310样地TLS 点云,(b)为UAV影像点云生成的数字地面模型(DSM),(c)为两种数据检测到的匹配点对示意图。FIG. 5 is a schematic diagram of a TLS point cloud of sample number 0310, a digital ground model (DSM) generated by a UAV image point cloud, and a matching point pair detected by the two kinds of data according to an embodiment of the present invention. Among them, (a) is the TLS point cloud of the No. 0310 sample plot, (b) is the digital ground model (DSM) generated by the point cloud of the UAV image, and (c) is a schematic diagram of the matching point pairs detected by the two kinds of data.
图6为本发明实施例的单木点云数据及融合数据。FIG. 6 shows single-wood point cloud data and fusion data according to an embodiment of the present invention.
图7为本发明实施例的四个模型示意图。其中A为基于单一TLS点云数据生成的数字表面模型(DSM),B为基于单一TLS点云数据生成的数字高程模型(DEM),C 为基于融合数据获取的数字表面模型(DSM),D为基于融合数据利用DSM与DEM 的差值生成样地树冠高度模型(CHM)。FIG. 7 is a schematic diagram of four models according to an embodiment of the present invention. Among them, A is the digital surface model (DSM) generated based on a single TLS point cloud data, B is a digital elevation model (DEM) generated based on a single TLS point cloud data, C is a digital surface model (DSM) based on fusion data acquisition, D The canopy height model (CHM) for the plot was generated using the difference between DSM and DEM based on fused data.
图8为本发明实施例的检测样地树顶点及单木树高值,绿色点表示单木树顶点的位置及相应单木的树高。FIG. 8 shows the tree vertices and individual tree height values of the detection plot according to the embodiment of the present invention, and the green dots represent the positions of the individual tree vertices and the tree heights of the corresponding single trees.
图9为本发明实施例的估算结果对比图。其中A为基于单一TLS点云估算的树高与野外实测单木树高的对比图,B为基于融合数据估算的树高与野外实测单木树高的对比图。FIG. 9 is a comparison diagram of estimation results according to an embodiment of the present invention. Among them, A is the comparison chart of the tree height estimated based on a single TLS point cloud and the field measured single tree height, and B is the comparison chart of the tree height estimated based on the fusion data and the field measured single tree height.
具体实施方式Detailed ways
下面结合附图及实施例对本发明做进一步说明。The present invention will be further described below with reference to the accompanying drawings and embodiments.
应该指出,以下详细说明都是示例性的,旨在对本申请提供进一步的说明。除非另有指明,本文使用的所有技术和科学术语具有与本申请所属技术领域的普通技术人员通常理解的相同含义。It should be noted that the following detailed description is exemplary and intended to provide further explanation of the application. Unless otherwise defined, all technical and scientific terms used herein have the same meaning as commonly understood by one of ordinary skill in the art to which this application belongs.
需要注意的是,这里所使用的术语仅是为了描述具体实施方式,而非意图限制根据本申请的示例性实施方式。如在这里所使用的,除非上下文另外明确指出,否则单数形式也意图包括复数形式,此外,还应当理解的是,当在本说明书中使用术语“包含”和/或“包括”时,其指明存在特征、步骤、操作、器件、组件和 /或它们的组合。It should be noted that the terminology used herein is for the purpose of describing specific embodiments only, and is not intended to limit the exemplary embodiments according to the present application. As used herein, unless the context clearly dictates otherwise, the singular is intended to include the plural as well, furthermore, it is to be understood that when the terms "comprising" and/or "including" are used in this specification, it indicates that There are features, steps, operations, devices, components and/or combinations thereof.
如图1所示,本实施例提供了一种结合UAV影像和TLS点云的高郁闭森林样地树高提取方法,具体包括以下步骤:As shown in FIG. 1 , this embodiment provides a method for extracting tree heights from high canopy closed forest plots combining UAV images and TLS point clouds, which specifically includes the following steps:
步骤S1:同时获取高郁闭度森林样地无人机(UAV)影像点云与该样地的地面激光雷达(TLS)点云数据并生成数字表面模型(DSM);Step S1: Simultaneously obtain the point cloud of the unmanned aerial vehicle (UAV) image of the forest plot with high canopy closure and the point cloud data of the ground lidar (TLS) of the plot, and generate a digital surface model (DSM);
步骤S2:估算高郁闭度森林样地无人机(UAV)影像点云与该样地的地面激光雷达(TLS)点云数据的数字表面模型DSM上所有点的曲率,存储DSM所有点云尺度不变的局部邻近点,将曲率值高于其邻近点曲率值的点作为关键点;Step S2: Estimate the curvature of all points on the digital surface model DSM of the high-canopy forest plot unmanned aerial vehicle (UAV) image point cloud and the ground Lidar (TLS) point cloud data of the plot, and store all the point clouds of the DSM For scale-invariant local neighboring points, the points whose curvature value is higher than that of their neighboring points are regarded as key points;
步骤S3:建立关键点描述符区域,生成无人机影像点云和地面激光雷达样地点云的DSM描述符SIFT;Step S3: establish a key point descriptor area, and generate the DSM descriptor SIFT of the UAV image point cloud and the ground lidar sample point cloud;
步骤S4:匹配最相似的关键点描述符,进行关键点坐标转换,实现无人机影像点云和地面激光雷达样地点云数据匹配融合;Step S4: Match the most similar key point descriptors, perform key point coordinate transformation, and realize the matching and fusion of the UAV image point cloud and the ground lidar sample point cloud data;
步骤S5:基于无人机影像点云和地面激光雷达样地点云的融合数据,进行样地地面点分割,建立样地冠层高度模型CHM;Step S5: based on the fusion data of the UAV image point cloud and the ground lidar sample point cloud, the ground points of the sample plot are segmented, and the CHM model of the canopy height of the sample plot is established;
步骤S6:基于冠层高度模型CHM,采用改进的局部最大值算法提取样地的单木树高。Step S6: Based on the canopy height model CHM, the tree height of a single tree in the plot is extracted by using the improved local maximum algorithm.
在本实施例中,步骤S1中,设置森林样地的郁闭度值大于0.7;进行无人机影像数据采集时,影像航向和旁向重叠度分别设置为大于等于30%和大于等于70%,影像分辨率为设置为小于等于3cm;对得到的UAV像对,利用运动结构多视图立体摄影(SfM-MVS)技术和算法生成三维点云数据。In this embodiment, in step S1, the canopy closure value of the forest plot is set to be greater than 0.7; when collecting UAV image data, the image heading and side overlap are set to be greater than or equal to 30% and greater than or equal to 70%, respectively , and the image resolution is set to be less than or equal to 3 cm; for the obtained UAV image pairs, the three-dimensional point cloud data is generated by using the Motion Structure Multi-View Stereo Photography (SfM-MVS) technology and algorithm.
在本实施例中,步骤S2具体包括以下步骤:In this embodiment, step S2 specifically includes the following steps:
步骤S21:估算两种点云数据的数字表面模型DSM上所有点的表面曲率,利用协方差的特征分析有3个特征向量eμ和其对应的特征值λμ;其中eμ定义一个局部三维正交参考坐标系,而λμ定义每个eμ的大小;根据每点的特征值λ0、λ1、λ2,将局部DSM表面量化为一个近似曲面的曲率,计算公式如下:Step S21: estimating the surface curvature of all points on the digital surface model DSM of two kinds of point cloud data, using the feature analysis of covariance to have 3 eigenvectors e μ and its corresponding eigenvalue λ μ ; wherein e μ defines a local three-dimensional Orthogonal reference coordinate system, and λ μ defines the size of each e μ ; according to the eigenvalues λ 0 , λ 1 , λ 2 of each point, the local DSM surface is quantified into an approximate curvature of the surface, and the calculation formula is as follows:


式中,λ0表示候选关键点的表面法线,即是在三维表面上局部切平面的最小变化方向;In the formula, λ 0 represents the surface normal of the candidate key point, that is, the minimum change direction of the local tangent plane on the three-dimensional surface;
步骤S22:步骤S21中各个点的邻近点云半径范围是不确定的,在0-1之间的归一化点云坐标系统中,半径尺度范围是0.1-0.5,增量是0.05,将最大曲率值作为关键点邻近点云的半径值;如果候选点的曲率值大于其相邻点云范围内所有点的曲率值,那么将该候选点作为一个关键点。Step S22: The radius range of the adjacent point cloud of each point in step S21 is uncertain. In the normalized point cloud coordinate system between 0 and 1, the radius scale range is 0.1-0.5, and the increment is 0.05. The curvature value is used as the radius value of the adjacent point cloud of the key point; if the curvature value of the candidate point is greater than the curvature value of all points in the range of its adjacent point cloud, the candidate point is regarded as a key point.
在本实施例中,步骤S3具体包括以下步骤:In this embodiment, step S3 specifically includes the following steps:
步骤S31:计算每个关键点的方向,依照这个方向再做进一步的计算;利用关键点邻域像素的梯度方向分布特性为每个关键点指定方向参数,使算子具备旋转不变性;其中,点(x,y)处梯度的模值和方向计算公式分别如下:Step S31: Calculate the direction of each key point, and perform further calculations according to this direction; specify a direction parameter for each key point by using the gradient direction distribution characteristics of the pixels in the neighborhood of the key point, so that the operator has rotation invariance; wherein, The calculation formulas of the modulus value and direction of the gradient at the point (x, y) are as follows:


式中,L所用的尺度为每个关键点各自所在的尺度;In the formula, the scale used by L is the scale of each key point;
步骤S32:每个关键点有三个信息:位置、所处尺度以及方向,以关键点为中心,确定一个SIFT特征区域;Step S32: each key point has three pieces of information: position, scale and direction, and a SIFT feature area is determined with the key point as the center;
步骤S33:在关键点邻域内,对其中点的梯度做高斯加权;其中邻域分为4×4 个子区域,每个子区域生成一个描述子,一个描述子中涉及8个方向,最终每个关键点形成128维的SIFT特征向量。Step S33: In the neighborhood of the key point, apply Gaussian weighting to the gradient of its point; the neighborhood is divided into 4×4 sub-regions, each sub-region generates a descriptor, and one descriptor involves 8 directions, and finally each key The points form a 128-dimensional SIFT feature vector.
在本实施例中,步骤S4具体包括以下步骤:In this embodiment, step S4 specifically includes the following steps:
步骤S41:采用关键点特征向量的欧式距离作为两幅图像中关键点的相似性判定度量,两个样地的数据分别生成相应的描述子,将两图中所有尺度的描述子进行分配,在描述符特征空间中,利用关键点与其第一和第二最邻近点的欧氏距离来匹配每个关键点;Step S41: using the Euclidean distance of the feature vector of the key points as the similarity judgment measure of the key points in the two images, the data of the two sample plots respectively generate corresponding descriptors, and assign the descriptors of all scales in the two images, In the descriptor feature space, use the Euclidean distance of the keypoint to its first and second closest neighbors to match each keypoint;
步骤S42:在描述符空间使用最邻近点特征匹配时,如果两个图像关键点之间的相对距离dist1小于用户设置的阈值,即在边界内搜索不到另一幅图像的最邻近关键点,则关键点的描述符D1不能与另外一幅图像关键点描述符Dtrue匹配;如果边界内只有一个可匹配的点,该点即可作为最佳匹配的点;Step S42: When the descriptor space uses the nearest neighbor point feature matching, if the relative distance dist 1 between the two image key points is less than the threshold set by the user, that is, the nearest neighbor key point of another image cannot be searched within the boundary. , the descriptor D 1 of the key point cannot match the key point descriptor D true of another image; if there is only one matching point within the boundary, this point can be used as the best matching point;
步骤S43:在描述符空间使用最邻近点特征匹配时,如果在一定的边界范围内,


步骤S44:在描述符空间使用最邻近点特征匹配时,如果在一定的边界范围内,


步骤S45:在确认匹配点以后,使用RANSAC方法剔除错误匹配的点;Step S45: after confirming the matching points, use the RANSAC method to eliminate the wrongly matched points;
步骤S46:估算无人机影像点云和地面激光雷达样地点云表面对应关键点的尺度因子、旋转角和平移位移,进行两种数据的坐标转换。Step S46: Estimate the scale factor, rotation angle and translation displacement of the corresponding key points on the surface of the drone image point cloud and the ground lidar sample point cloud, and perform coordinate conversion of the two kinds of data.
在本实施例中,步骤S44中,所述用户定义的值τ取0.3。In this embodiment, in step S44, the user-defined value τ takes 0.3.
在本实施例中,步骤S5具体包括以下步骤:In this embodiment, step S5 specifically includes the following steps:
步骤S51:利用无人机影像点云和地面激光雷达点云的融合数据生成的DSM,与样地的数字高程模型DEM做差值运算获得冠层高度模型CHM;Step S51: using the DSM generated by the fusion data of the drone image point cloud and the ground lidar point cloud, and the digital elevation model DEM of the sample plot to perform a difference calculation to obtain the canopy height model CHM;
步骤S52:基于融合数据的树冠高度模型CHM,将获取的初始样地单木树顶点结果作为候选树顶点;Step S52: Based on the canopy height model CHM of the fusion data, the obtained initial sample plot single-tree tree vertex result is used as the candidate tree vertex;
步骤S53:采用自适应的动态窗口对获取的树顶点进行判断,若当前顶点为对应窗口区域的最大值则保存,否则删除。Step S53: Use an adaptive dynamic window to judge the acquired tree vertices, if the current vertex is the maximum value of the corresponding window area, save it, otherwise delete it.
在本实施例中,步骤S52中,所述动态窗口的大小通过计算潜在顶点八个剖面方向半方差值的变化值来自适应的确定,其公式计算如下:In this embodiment, in step S52, the size of the dynamic window is adaptively determined by calculating the change values of the semi-variance values of the eight cross-section directions of the potential vertices, and the formula is calculated as follows:

式中,γ(h)为经验半方差值,xi为影像的像元位置,h为两个像元的空间分割距离,Z(xi)为对应影像xi处的像元值,N为在一定分隔距离下像元对的对数。In the formula, γ(h) is the empirical semivariance value, x i is the pixel position of the image, h is the spatial division distance between two pixels, Z( xi ) is the pixel value at the corresponding image x i , N is the logarithm of cell pairs at a certain separation distance.
特别的,本实施例选择的高郁闭度森林样地位于福建省将乐县,样地为1亩、边长为25.82×25.82m的正方形固定森林样地,样地编号为0310。在固定样地中分别获取UAV影像和TLS点云数据。图2为研究区域及0310样地侧视图和俯视图的实景照片。由图可看出,该样地样木较为密集,郁闭度较高。In particular, the forest plot with high canopy density selected in this example is located in Jiangle County, Fujian Province. UAV images and TLS point cloud data were acquired in fixed plots, respectively. Figure 2 is a real photo of the side view and top view of the study area and the 0310 plot. It can be seen from the figure that the sample trees in this plot are relatively dense and the canopy closure is high.
在2016年11月,运用RIEGL VZ-400地面激光扫描仪采集样地的TLS点云数据,其扫描仪的扫描视场是100°×360°(垂直×水平),图3中的A是RIEGL VZ-400地面激光扫描仪及其扫描视场的示意图。图3中的B中的三角形为各扫描站扫描仪在样地中的位置,共8站数据,均匀分布在样地中心和四周。在2016年 11月,完成了0310样地的UAV影像数据的采集,影像航向和旁向重叠度分别设置为30%和70%,影像分辨率为2.5cm。In November 2016, the RIEGL VZ-400 terrestrial laser scanner was used to collect the TLS point cloud data of the sample plot. The scanning field of view of the scanner was 100°×360° (vertical×horizontal). A in Figure 3 is RIEGL Schematic of the VZ-400 terrestrial laser scanner and its scanning field of view. The triangle in B in Figure 3 is the position of the scanner of each scanning station in the sample plot. There are 8 stations in total, which are evenly distributed in the center and surrounding of the sample plot. In November 2016, the collection of UAV image data of the 0310 plot was completed. The image heading and lateral overlap were set to 30% and 70%, respectively, and the image resolution was 2.5 cm.
图4中的A和B分别是编号0310样地获取的TLS点云和UAV影像点云数据。由图可看出,该样地的两种点云数据都在不同的角度存在缺失,TLS点云其地面数据可以精细获取,但是部分单木树冠点云未扫描完整,UAV影像点云是缺失林冠下层信息,为获取精确的样地树高,通过以上步骤,将两种点云数据进行匹配(图 5),得到融合后的点云数据,获取更加完整的描述该森林样地(图6)。A and B in Figure 4 are the TLS point cloud and UAV image point cloud data obtained from sample number 0310, respectively. It can be seen from the figure that the two kinds of point cloud data of the plot are missing at different angles. The ground data of the TLS point cloud can be obtained in detail, but some single tree canopy point clouds are not scanned completely, and the UAV image point cloud is missing. For the information of the lower forest canopy, in order to obtain the accurate tree height of the sample plot, through the above steps, the two point cloud data were matched (Figure 5), and the fused point cloud data was obtained to obtain a more complete description of the forest plot (Figure 6). ).
图7中的A、B是样地基于单一TLS点云数据生成的数字表面模型(DSM)和数字高程模型(DEM),图7中的C基于融合数据获取的数字表面模型(DSM),由图可看出,融合前后生成的DSM差别明显,弥补了单一TLS点云数据树木冠层点云数据的缺失。图7中的D基于融合数据利用DSM与DEM的差值生成样地树冠高度模型(CHM)。A and B in Fig. 7 are the Digital Surface Model (DSM) and Digital Elevation Model (DEM) generated based on a single TLS point cloud data. C in Fig. 7 is based on the Digital Surface Model (DSM) obtained from the fusion data. It can be seen from the figure that the DSM generated before and after the fusion is obviously different, which makes up for the lack of the tree canopy point cloud data of the single TLS point cloud data. D in Figure 7 uses the difference between DSM and DEM to generate the canopy height model (CHM) of the plot based on the fusion data.
通过以上步骤检测样地树顶点及单木树高值如图8所示,绿色点表示单木树顶点的位置,并标注了其高度值来展示相应单木的树高。The tree vertices and single tree height values of the sample plots detected by the above steps are shown in Figure 8. The green dots represent the position of the single tree vertices, and the height values are marked to show the tree height of the corresponding single tree.
图9中的A为本实施案例中基于单一TLS点云估算的树高与野外实测单木树高的对比图,图9中的B为本实施案例中基于融合数据估算的树高与野外实测单木树高的对比图,对比发现基于融合数据估算的树高相关性明显增强。A in Figure 9 is a comparison diagram of the tree height estimated based on a single TLS point cloud in the implementation case and the measured single tree height in the field, and B in Figure 9 is the tree height estimated based on the fusion data in the implementation case and the field measurement. The comparison chart of the tree height of a single tree shows that the correlation of the tree height estimated based on the fusion data is significantly enhanced.
下表是基于融合数据估算样地的平均树高、单一TLS数据估算的样地平均树高与野外实测平均树高的比较。The following table shows the comparison of the average tree height of the plots estimated based on the fusion data, the average tree height of the plots estimated by the single TLS data and the average tree height measured in the field.
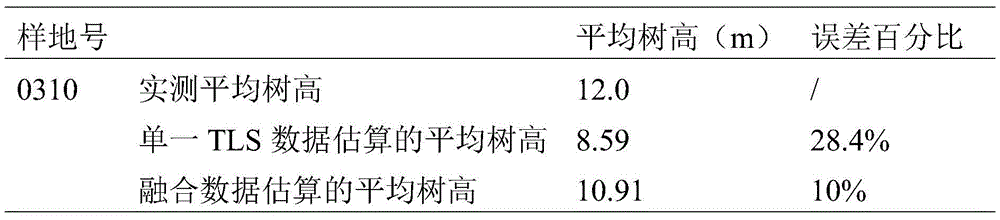
从上表可以得出,基于融合数据估算的样地平均树高精度明显提升,其估算误差可以降到10%,满足了林业参数调查的精度要求。From the above table, it can be concluded that the high precision of the average tree estimated based on the fusion data is significantly improved, and the estimation error can be reduced to 10%, which meets the accuracy requirements of the forestry parameter survey.
本领域内的技术人员应明白,本申请的实施例可提供为方法、系统、或计算机程序产品。因此,本申请可采用完全硬件实施例、完全软件实施例、或结合软件和硬件方面的实施例的形式。而且,本申请可采用在一个或多个其中包含有计算机可用程序代码的计算机可用存储介质(包括但不限于磁盘存储器、CD-ROM、光学存储器等)上实施的计算机程序产品的形式。As will be appreciated by those skilled in the art, the embodiments of the present application may be provided as a method, a system, or a computer program product. Accordingly, the present application may take the form of an entirely hardware embodiment, an entirely software embodiment, or an embodiment combining software and hardware aspects. Furthermore, the present application may take the form of a computer program product embodied on one or more computer-usable storage media (including, but not limited to, disk storage, CD-ROM, optical storage, etc.) having computer-usable program code embodied therein.
本申请是参照根据本申请实施例的方法、设备(系统)、和计算机程序产品的流程图和/或方框图来描述的。应理解可由计算机程序指令实现流程图和/或方框图中的每一流程和/或方框、以及流程图和/或方框图中的流程和/或方框的结合。可提供这些计算机程序指令到通用计算机、专用计算机、嵌入式处理机或其他可编程数据处理设备的处理器以产生一个机器,使得通过计算机或其他可编程数据处理设备的处理器执行的指令产生用于实现在流程图一个流程或多个流程和/或方框图一个方框或多个方框中指定的功能的装置。The present application is described with reference to flowchart illustrations and/or block diagrams of methods, apparatus (systems), and computer program products according to embodiments of the present application. It will be understood that each flow and/or block in the flowchart illustrations and/or block diagrams, and combinations of flows and/or blocks in the flowchart illustrations and/or block diagrams, can be implemented by computer program instructions. These computer program instructions may be provided to the processor of a general purpose computer, special purpose computer, embedded processor or other programmable data processing device to produce a machine such that the instructions executed by the processor of the computer or other programmable data processing device produce Means for implementing the functions specified in a flow or flow of a flowchart and/or a block or blocks of a block diagram.
这些计算机程序指令也可存储在能引导计算机或其他可编程数据处理设备以特定方式工作的计算机可读存储器中,使得存储在该计算机可读存储器中的指令产生包括指令装置的制造品,该指令装置实现在流程图一个流程或多个流程和/ 或方框图一个方框或多个方框中指定的功能。These computer program instructions may also be stored in a computer-readable memory capable of directing a computer or other programmable data processing apparatus to function in a particular manner, such that the instructions stored in the computer-readable memory result in an article of manufacture comprising instruction means, the instructions The apparatus implements the functions specified in the flow or flows of the flowcharts and/or the block or blocks of the block diagrams.
这些计算机程序指令也可装载到计算机或其他可编程数据处理设备上,使得在计算机或其他可编程设备上执行一系列操作步骤以产生计算机实现的处理,从而在计算机或其他可编程设备上执行的指令提供用于实现在流程图一个流程或多个流程和/或方框图一个方框或多个方框中指定的功能的步骤。These computer program instructions can also be loaded on a computer or other programmable data processing device to cause a series of operational steps to be performed on the computer or other programmable device to produce a computer-implemented process such that The instructions provide steps for implementing the functions specified in the flow or blocks of the flowcharts and/or the block or blocks of the block diagrams.
以上所述,仅是本发明的较佳实施例而已,并非是对本发明作其它形式的限制,任何熟悉本专业的技术人员可能利用上述揭示的技术内容加以变更或改型为等同变化的等效实施例。但是凡是未脱离本发明技术方案内容,依据本发明的技术实质对以上实施例所作的任何简单修改、等同变化与改型,仍属于本发明技术方案的保护范围。The above are only preferred embodiments of the present invention, and are not intended to limit the present invention in other forms. Any person skilled in the art may use the technical content disclosed above to make changes or modifications to equivalent changes. Example. However, any simple modifications, equivalent changes and modifications made to the above embodiments according to the technical essence of the present invention without departing from the content of the technical solutions of the present invention still belong to the protection scope of the technical solutions of the present invention.
Claims (8)


Priority Applications (1)
| Application Number | Priority Date | Filing Date | Title |
|---|---|---|---|
| CN201910321231.5A CN110033484B (en) | 2019-04-22 | 2019-04-22 | High canopy density forest sample plot tree height extraction method combining UAV image and TLS point cloud |
Applications Claiming Priority (1)
| Application Number | Priority Date | Filing Date | Title |
|---|---|---|---|
| CN201910321231.5A CN110033484B (en) | 2019-04-22 | 2019-04-22 | High canopy density forest sample plot tree height extraction method combining UAV image and TLS point cloud |
Publications (2)
| Publication Number | Publication Date |
|---|---|
| CN110033484A CN110033484A (en) | 2019-07-19 |
| CN110033484B true CN110033484B (en) | 2022-05-24 |
Family
ID=67239552
Family Applications (1)
| Application Number | Title | Priority Date | Filing Date |
|---|---|---|---|
| CN201910321231.5A Expired - Fee Related CN110033484B (en) | 2019-04-22 | 2019-04-22 | High canopy density forest sample plot tree height extraction method combining UAV image and TLS point cloud |
Country Status (1)
| Country | Link |
|---|---|
| CN (1) | CN110033484B (en) |
Families Citing this family (16)
| Publication number | Priority date | Publication date | Assignee | Title |
|---|---|---|---|---|
| CN110580468B (en) * | 2019-09-10 | 2023-07-18 | 南京林业大学 | A Method of Single Timber Structure Parameter Extraction Based on Image Matching Point Cloud |
| US11861855B2 (en) * | 2020-06-18 | 2024-01-02 | Deka Products Limited Partnership | System and method for aerial to ground registration |
| CN113205548A (en) * | 2021-04-01 | 2021-08-03 | 广西壮族自治区自然资源遥感院 | Automatic registration method and system for forest unmanned aerial vehicle and foundation point cloud |
| CN113793367B (en) * | 2021-11-17 | 2022-02-15 | 西南交通大学 | Visual measurement and power identification system and method for engineering structure corner displacement |
| CN114387288A (en) * | 2022-01-17 | 2022-04-22 | 滁州学院 | Single standing tree three-dimensional information extraction method based on vehicle-mounted laser radar point cloud data |
| CN114969166B (en) * | 2022-03-01 | 2024-04-26 | 国家林业和草原局调查规划设计院 | A high-precision grouping evaluation method for estimating CHM trees in mountainous forest areas using aerial laser radar |
| CN114281871B (en) * | 2022-03-01 | 2022-10-18 | 国家林业和草原局调查规划设计院 | Precision verification method for estimating mountain forest region CHM tree height by aviation laser radar |
| CN114777703B (en) * | 2022-04-25 | 2024-04-16 | 贵州省第三测绘院(贵州省国土资源遥感监测中心) | Precise positioning method and device for forestry sample plots based on distance matching |
| CN115100250A (en) * | 2022-06-13 | 2022-09-23 | 北京林业大学 | Method for extracting high parameters of forest tree |
| CN115049790B (en) * | 2022-07-01 | 2025-11-21 | 中山大学 | Forest scene voxel model construction method and system |
| CN118521880A (en) * | 2022-11-24 | 2024-08-20 | 浙江领见数智科技有限公司 | Method and device for extracting tobacco plants based on unmanned aerial vehicle multispectral data |
| CN116665081B (en) * | 2023-07-31 | 2023-10-13 | 自然资源部第一海洋研究所 | Coastal vegetation aboveground biomass estimation method, computer equipment and medium |
| CN118015685B (en) * | 2024-04-09 | 2024-07-02 | 湖北楚天龙实业有限公司 | Method and system for identifying one-card |
| CN118799363B (en) * | 2024-06-17 | 2025-03-25 | 西南交通大学 | A method for registration of UAV and ground-based forest point cloud |
| CN118711073B (en) * | 2024-08-30 | 2024-10-25 | 中国科学院、水利部成都山地灾害与环境研究所 | Method for extracting tree height based on laser radar unmanned aerial vehicle image |
| CN120182597B (en) * | 2025-02-28 | 2025-10-17 | 华中农业大学 | A method, device, medium and equipment for splitting single trees in high-canopy forests |
Citations (3)
| Publication number | Priority date | Publication date | Assignee | Title |
|---|---|---|---|---|
| US7212670B1 (en) * | 2002-05-03 | 2007-05-01 | Imagetree Corp. | Method of feature identification and analysis |
| CN106815850A (en) * | 2017-01-22 | 2017-06-09 | 武汉地普三维科技有限公司 | The method that canopy density forest reserves very high is obtained based on laser radar technique |
| CN108594262A (en) * | 2018-07-05 | 2018-09-28 | 南京林业大学 | High method is set in a kind of combination unmanned plane and the extraction of ground laser radar |
-
2019
- 2019-04-22 CN CN201910321231.5A patent/CN110033484B/en not_active Expired - Fee Related
Patent Citations (3)
| Publication number | Priority date | Publication date | Assignee | Title |
|---|---|---|---|---|
| US7212670B1 (en) * | 2002-05-03 | 2007-05-01 | Imagetree Corp. | Method of feature identification and analysis |
| CN106815850A (en) * | 2017-01-22 | 2017-06-09 | 武汉地普三维科技有限公司 | The method that canopy density forest reserves very high is obtained based on laser radar technique |
| CN108594262A (en) * | 2018-07-05 | 2018-09-28 | 南京林业大学 | High method is set in a kind of combination unmanned plane and the extraction of ground laser radar |
Non-Patent Citations (1)
| Title |
|---|
| 基于无人机影像匹配点云的苗圃单木冠层三维分割;陈崇成等;《农业机械学报》;20180225(第02期);全文 * |
Also Published As
| Publication number | Publication date |
|---|---|
| CN110033484A (en) | 2019-07-19 |
Similar Documents
| Publication | Publication Date | Title |
|---|---|---|
| CN110033484B (en) | High canopy density forest sample plot tree height extraction method combining UAV image and TLS point cloud | |
| Chen et al. | An end-to-end shape modeling framework for vectorized building outline generation from aerial images | |
| CN107093205B (en) | A detection and reconstruction method for building windows in 3D space based on UAV images | |
| US9767604B2 (en) | Image analysis method by analyzing point cloud using hierarchical search tree | |
| US10043097B2 (en) | Image abstraction system | |
| CN104331699B (en) | A kind of method that three-dimensional point cloud planarization fast search compares | |
| Chen et al. | Building change detection with RGB-D map generated from UAV images | |
| CN108107444B (en) | A method for identifying foreign objects in substations based on laser data | |
| CN103218787B (en) | Multi-source heterogeneous remote sensing image reference mark automatic acquiring method | |
| WO2019042232A1 (en) | Fast and robust multimodal remote sensing image matching method and system | |
| CN102708370B (en) | Method and device for extracting multi-view angle image foreground target | |
| Hu et al. | Research on a single-tree point cloud segmentation method based on UAV tilt photography and deep learning algorithm | |
| Cheng et al. | Building boundary extraction from high resolution imagery and lidar data | |
| Fan et al. | A robust oriented filter-based matching method for multisource, multitemporal remote sensing images | |
| CN111160433B (en) | High-speed matching method and system for high-resolution image feature points | |
| CN116703895B (en) | Small sample 3D visual detection method and system based on generation countermeasure network | |
| CN103186899B (en) | A kind of Feature Points Extraction of affine Scale invariant | |
| Qin | A mean shift vector-based shape feature for classification of high spatial resolution remotely sensed imagery | |
| CN106295657A (en) | A kind of method extracting human height's feature during video data structure | |
| CN115496784A (en) | A Point Cloud Registration Method Based on Normalized 4D Feature Vectors | |
| CN117274627A (en) | A multi-temporal snow remote sensing image matching method and system based on image conversion | |
| Wang | Automatic extraction of building outline from high resolution aerial imagery | |
| Song et al. | Image matching and localization based on fusion of handcrafted and deep features | |
| CN116091706B (en) | Three-dimensional reconstruction method for deep learning matching of multi-modal remote sensing images | |
| Ni et al. | Applications of 3d-edge detection for als point cloud |
Legal Events
| Date | Code | Title | Description |
|---|---|---|---|
| PB01 | Publication | ||
| PB01 | Publication | ||
| SE01 | Entry into force of request for substantive examination | ||
| SE01 | Entry into force of request for substantive examination | ||
| GR01 | Patent grant | ||
| GR01 | Patent grant | ||
| CF01 | Termination of patent right due to non-payment of annual fee |
Granted publication date: 20220524 |
|
| CF01 | Termination of patent right due to non-payment of annual fee |